
In the highly competitive apparel manufacturing industry, keeping track of key performance indicators (KPIs) is essential for maximizing efficiency, reducing costs, and maintaining high-quality standards. That’s why we have developed the Apparel Manufacturing KPI Dashboard in Google Sheets — a ready-to-use, easy-to-customize tool to help manufacturers monitor their crucial metrics effectively.Apparel Manufacturing KPI Dashboard in Google Sheets
This dashboard offers a powerful way to visualize monthly and yearly performance data, compare with past results, and identify areas for improvement. Whether you are a factory manager, production supervisor, or quality control specialist, this dashboard can empower you to make smarter decisions and boost your manufacturing operations.Apparel Manufacturing KPI Dashboard in Google Sheets
What Is the Apparel Manufacturing KPI Dashboard in Google Sheets?
Click to buy Apparel Manufacturing KPI Dashboard in Google Sheets
The Apparel Manufacturing KPI Dashboard in Google Sheets is a structured, interactive template designed to capture, analyze, and display key metrics related to apparel production. It covers essential aspects such as production volume, quality, machine downtime, delivery rates, and labor productivity.
With this dashboard, you can easily track your manufacturing goals, spot trends, and ensure you meet targets month over month and year over year.
Key Features of the Apparel Manufacturing KPI Dashboard in Google Sheets
This dashboard includes 6 thoughtfully designed worksheets that make managing and analyzing KPIs straightforward:
1. Dashboard Sheet Tab
-
The main control center for your KPIs.
-
Select the month from a dropdown to filter the entire dashboard data dynamically.
-
View Month-To-Date (MTD) and Year-To-Date (YTD) actuals, targets, and previous year figures.
-
Conditional formatting highlights your KPI progress with intuitive up and down arrows, making it easy to see where you stand.


Click to buy Apparel Manufacturing KPI Dashboard in Google Sheets
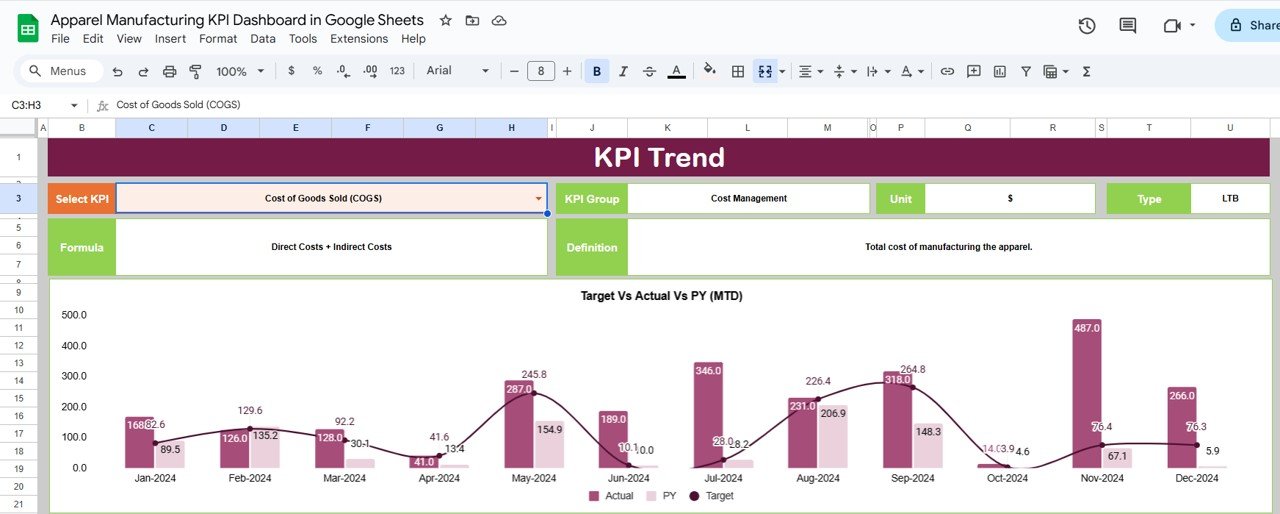
2. KPI Trend Sheet Tab
-
Focus on any KPI by selecting it from a dropdown.
-
Get detailed KPI information such as group/category, unit, whether it’s “Lower the Better” or “Upper the Better,” along with the calculation formula and definition.
-
Analyze trends and measure performance over time.

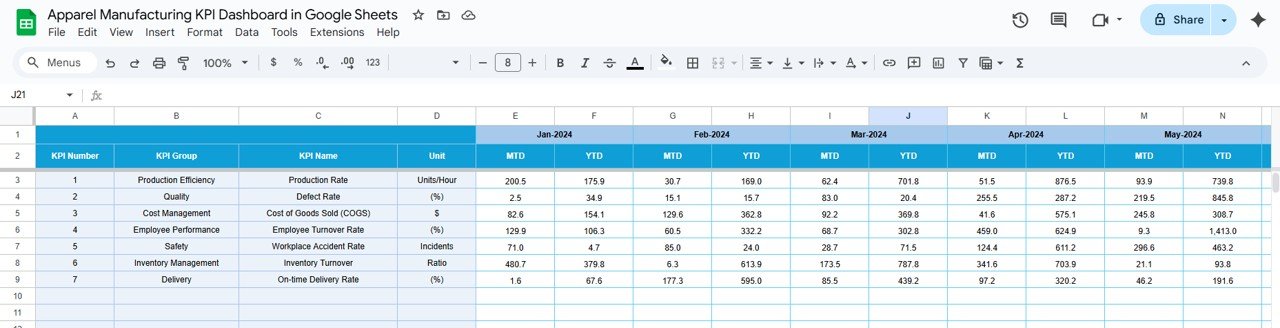
3. Actual Number Sheet Tab
-
Enter actual performance data for the month and year.
-
Easily update with new numbers as production progresses.

Click to buy Apparel Manufacturing KPI Dashboard in Google Sheets
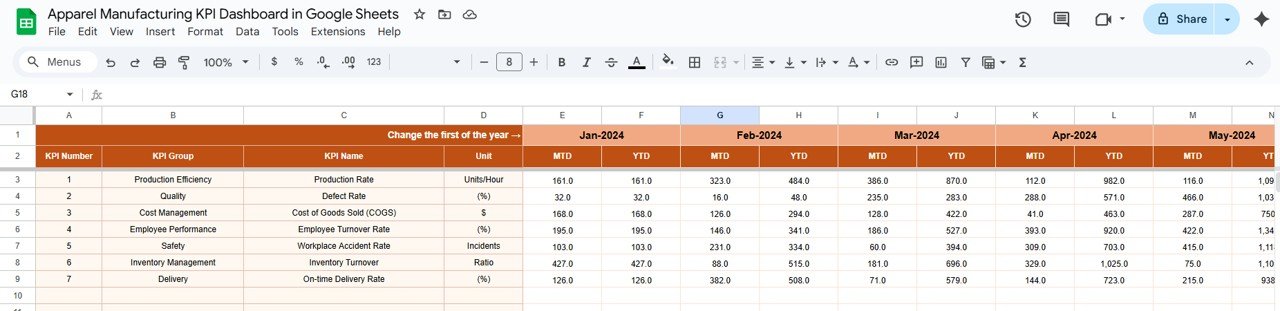
4. Target Sheet Tab
-
Set your monthly and yearly target values for each KPI.
-
Helps to keep the entire team aligned on goals.

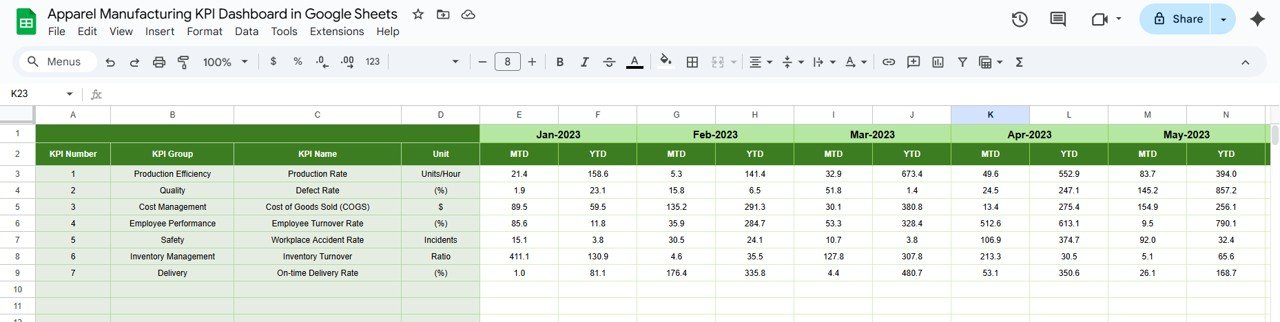
5. Previous Year Number Sheet Tab
-
Input last year’s data for accurate benchmarking.
-
Compare current performance to historical results.

Click to buy Apparel Manufacturing KPI Dashboard in Google Sheets
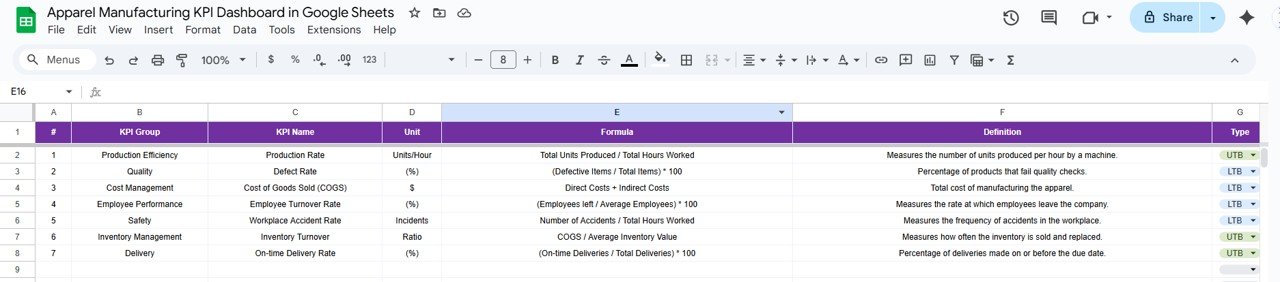
6. KPI Definition Sheet Tab
-
Maintain a master list of all KPIs with clear names, groups, units, formulas, and definitions.
-
Keeps your dashboard organized and easy to update

Why Use This Apparel Manufacturing KPI Dashboard?
-
Get Clear Visibility: Track all critical metrics in one place with real-time data.
-
Stay on Target: Monitor actual results versus goals and adjust your processes accordingly.
-
Identify Bottlenecks: Quickly pinpoint problem areas such as high defect rates or machine downtimes.
-
Improve Efficiency: Use labor productivity and energy consumption insights to optimize your operations.
-
Enhance Quality: Maintain lower scrap and defect rates to boost product quality.
-
Boost Delivery Performance: Stay ahead with on-time delivery monitoring.
-
Ensure Safety: Track and reduce workplace incidents for a safer environment.
-
Data-Driven Decisions: Make informed choices backed by actionable data.
Best Practices for Using the Dashboard
Click to buy Apparel Manufacturing KPI Dashboard in Google Sheets
-
Regularly Update Your Data: Enter actual numbers promptly for accurate monitoring.
-
Set Realistic Targets: Define achievable monthly and yearly goals for continuous improvement.
-
Review Trends Monthly: Use the KPI Trend sheet to observe patterns and make strategic changes.
-
Engage Your Team: Share the dashboard insights with your team to foster accountability.
-
Leverage Conditional Formatting: Quickly identify KPIs that are off-target.
-
Benchmark Against Last Year: Use previous year data for comparative analysis.
-
Customize KPIs: Adjust or add KPIs to match your unique manufacturing needs.
Conclusion
Click to buy Apparel Manufacturing KPI Dashboard in Google Sheets
The Apparel Manufacturing KPI Dashboard in Google Sheets is a versatile, user-friendly tool designed to enhance your production management. By keeping a close eye on your KPIs, you can increase efficiency, improve quality, reduce costs, and deliver better products on time.
Don’t wait to make data your competitive advantage—get started with this dashboard today and transform your apparel manufacturing operations!
Frequently Asked Questions (FAQs)
What software do I need to use this dashboard?
You only need Google Sheets, which is free and accessible online from any device.
Can I customize the KPIs in the dashboard?
Yes! You can add or modify KPIs in the KPI Definition sheet as per your business requirements.
How often should I update the dashboard?
For best results, update the actual data monthly or more frequently if possible.
Is this dashboard suitable for small and large manufacturers?
Absolutely! The dashboard is flexible and scalable for any apparel manufacturing operation size.
Can I share this dashboard with my team?
Yes, Google Sheets makes collaboration easy, so you can share it with colleagues and stakeholders.
Visit our YouTube channel to learn step-by-step video tutorials
Youtube.com/@NeotechNavigators
Click to buy Apparel Manufacturing KPI Dashboard in Google Sheets