Curious about how your investments are performing? Want a quick way to see Track Your Profits & Losses without complicated software? This guide will show you how to create an Investment Portfolio Tracker in Google Sheets. You’ll be able to monitor your investments, view profit or loss percentages, and even get actionable insights to help you make smarter decisions.
In this guide, we’ll break down the setup step-by-step, using formulas that anyone can apply—no advanced knowledge needed!
What Information Do You Need?
Before we dive in, here’s what you’ll need to track:
- Investment Name: Each stock, ETF, or fund you’re tracking.
- Purchase Date: When you made the investment.
- Purchase Price: How much you paid per share.
- Quantity: The number of shares you bought.
- Current Price: The current market price of the stock.
Once you have these details ready, we can easily calculate:
Total Investment (how much you invested initially)
Current Value (the value if sold at today’s price)
Profit/Loss (the difference between your investment and its current value)
Profit/Loss Percentage (how much you gained or lost as a percentage)
Let’s Get Started with Your Data
Imagine you have a list of investments in Google Sheets. Enter the data into columns, starting at A3 and going down to E18 (or as many rows as you need). Here’s how it might look:
With this setup, we’re ready to start calculating your investment performance!
Adding Formulas to Track Your Profits & Losses Performance
Now, let’s get into the fun part! With just a few simple formulas, you’ll be able to view everything from your Total Investment to your Profit/Loss Percentage.
Step 1: Calculate Total Investment
First, calculate how much you initially invested in each stock. Multiply the Purchase Price by the Quantity:
=C4 * D4
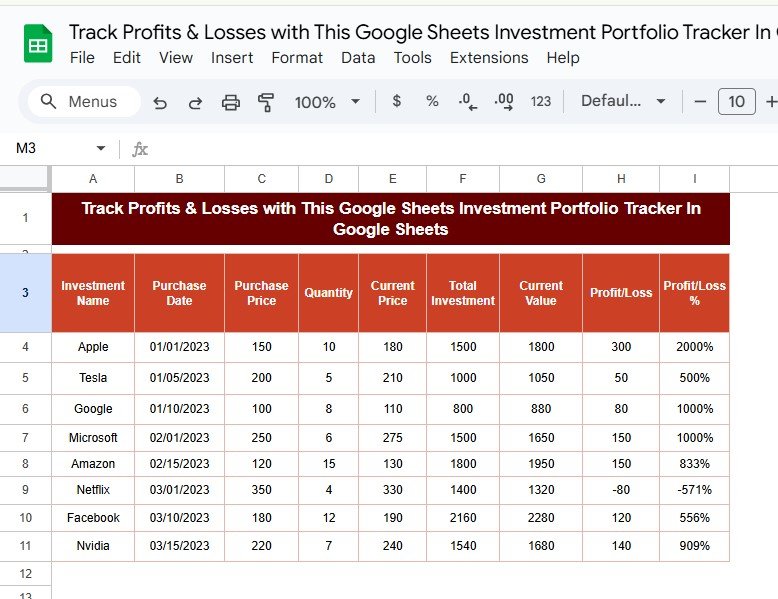
For example, if you purchased Apple shares at $150 each and bought 10 shares, then =150 * 10 = 1500. This amount, 1500, is your Total Investment.
Step 2: Calculate Current Value
Now, let’s see how much your investment is worth today. Multiply the Current Price by the Quantity:
=E4 * D4
In the case of Apple, if the current price is $180, then =180 * 10 = 1800. This 1800 is your Current Value.
Step 3: Calculate Profit or Loss
To find out if you’re in the green (or red), subtract the Total Investment from the Current Value:
=G4 - F4
Using Apple as an example, if the Current Value is 1800 and the Total Investment is 1500, then =1800 – 1500 = 300. This 300 represents your Profit!
Step 4: Calculate Profit/Loss Percentage
Finally, let’s calculate the percentage change to see how much you gained or lost relative to your investment. Simply divide the Profit/Loss by the Total Investment, then multiply by 100:
=(H4 / F4) * 100
So, for Apple, if the profit is 300 and the Total Investment is 1500, then (300 / 1500) * 100 = 20%. This means you have a 20% profit.
Putting It All Together
After applying each formula, you’ll end up with a table like this:
Formula Breakdown
Here’s a quick recap of what each formula is doing:
- Total Investment: Shows the amount you initially invested.
- Current Value: Displays how much your investment is worth at today’s price.
- Profit/Loss: Indicates the difference between the current value and the initial investment.
- Profit/Loss Percentage: Shows the profit or loss as a percentage, making it easier to see performance at a glance.
Benefits of Using This Google Sheets Tracker
Why should you use this tracker? Here are some compelling reasons:
- Real-Time Updates: Update the current price column, and your entire table refreshes with the latest profit or loss information.
- Quick Insights: See exactly which investments are performing well and which ones need attention.
- Informed Decisions: Get a clearer view of your portfolio’s performance and decide where to invest more or pull back.
Wrapping Up
Tracking your investments shouldn’t be a chore. With this easy Google Sheets setup, you can get a complete view of each stock’s performance and see your gains and losses at a glance. Plus, it’s free, accessible from anywhere, and highly customizable. Whether you’re a seasoned investor or just getting started, this tracker helps you stay informed and confident in your investment choices.
Visit our YouTube channel to learn step-by-step video tutorials
Youtube.com/@NeotechNavigators

