Managing energy and utility operations efficiently requires careful tracking of facility output, downtime, emissions, and energy sources. The Energy & Utility Dashboard in Google Sheets is a ready-to-use tool that enables you to monitor and analyze key metrics related to your facilities, energy sources, and environmental impact. With its intuitive layout and powerful features, this dashboard simplifies the process of tracking performance and improving operational efficiency.
In this article, we will explore the features of the Energy & Utility Dashboard in Google Sheets and explain how it can help you effectively manage energy and utility operations.
What is the Energy & Utility Dashboard in Google Sheets?
The Energy & Utility Dashboard in Google Sheets is a dynamic tool designed to help energy and utility managers monitor key performance indicators (KPIs) such as energy output, downtime, emissions, and facility efficiency. It enables businesses to track these metrics in real time, offering insights into how energy resources are utilized and where improvements can be made.
Key Features of the Energy & Utility Dashboard
1) Dashboard Sheet Tab: Key Performance Metrics
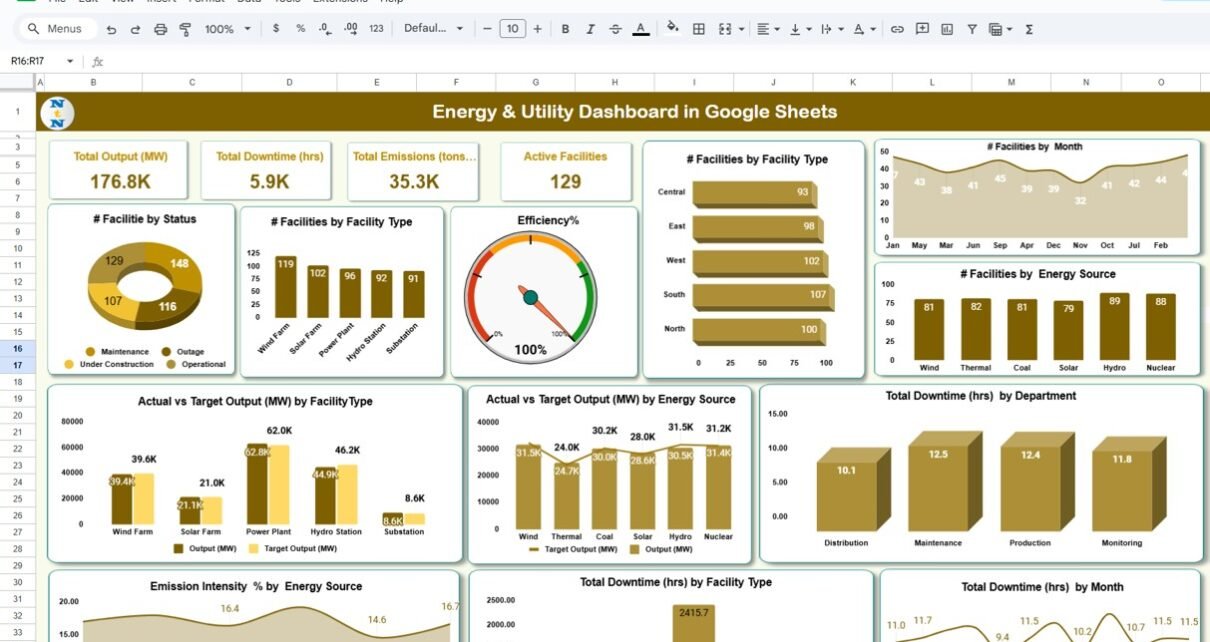
The Dashboard Sheet Tab provides an overview of the key performance indicators (KPIs) and visual insights into your energy and utility operations. Key features include:
Cards:
- Total Output (MW): Displays the total energy output across all facilities in megawatts (MW).
- Total Downtime (hrs): Shows the total downtime hours across all facilities.
- Total Emissions (tons CO2): Tracks the total emissions in tons of CO2.
- Active Facilities: Displays the number of active facilities in operation.
- Efficiency %: Shows the overall efficiency percentage of energy production.
Charts:
- # Facilities by Status: Displays the number of facilities by their operational status (e.g., operational, under maintenance).
- # Facilities by Facility Type: Categorizes facilities by their type (e.g., Solar Farm, Hydro Station).
- Efficiency %: Tracks the efficiency percentage of each facility.
- # Facilities by Energy Source: Categorizes facilities by energy source (e.g., Solar, Wind, Thermal).
- Actual vs Target Output (MW) by Energy Source: Compares actual energy output against target output by energy source.
- Total Downtime (hrs) by Department: Breaks down downtime by different departments (e.g., Maintenance, Production).
- Emission Intensity % by Energy Source: Tracks emissions intensity as a percentage by energy source.
- Total Downtime (hrs) by Facility Type: Breaks down downtime by facility type (e.g., Solar Farm, Wind Farm).
- Total Downtime (hrs) by Month: Shows downtime distribution over months.
This page provides an overall snapshot of the operational performance of your energy facilities, making it easy to monitor efficiency and identify any issues or bottlenecks.

Click to buy Energy & Utility Dashboard in Google Sheets
2) Search Sheet Tab: Quick Data Retrieval
The Search Sheet Tab allows you to search for specific data based on keywords and field names. Key features include:
-
Search by Search Keyword and Field Name: You can search for specific facilities or metrics by entering keywords or selecting field names (e.g., Facility Type, Energy Source).
-
Total Record Count: Displays the total number of records in the dataset.
-
Filtered Data: The relevant records are displayed after applying the search criteria.
This sheet is useful for quickly retrieving specific information, such as facility performance or emissions data, without needing to sift through the entire dataset.

3) Data Sheet Tab: Comprehensive Data Entry
Click to buy Energy & Utility Dashboard in Google Sheets
The Data Sheet Tab serves as the main input sheet for entering and tracking data. Key columns include:
- Facility ID: A unique identifier for each facility.
- Facility Name: The name of the facility (e.g., “New Justin Substation”).
- Energy Source: The type of energy source used (e.g., Solar, Wind, Thermal).
- Facility Type: The type of facility (e.g., Solar Farm, Hydro Station).
- Region: The region where the facility is located (e.g., North, South).
- Department: The department responsible for the facility (e.g., Maintenance, Production).
- Status: The operational status of the facility (e.g., Operational, Under Maintenance).
- Start Date: The date when the facility was started.
- Output (MW): The energy output in megawatts.
- Target Output (MW): The target energy output in megawatts.
- Downtime (hrs): The number of hours the facility was down.
- Emissions (tons CO2): The amount of CO2 emissions generated by the facility.
- Emission Intensity (tons/MW): The emissions intensity, calculated as tons of CO2 per megawatt of energy produced.
- Efficiency (%): The efficiency percentage of the facility.
- Month & Year: The data’s corresponding month and year.
This sheet is where you will input all of the data that is used in the dashboard to track performance, making it the backbone of the entire tool.

Benefits of Using the Energy & Utility Dashboard
The Energy & Utility Dashboard in Google Sheets provides several key benefits for energy and utility businesses:
-
Centralized Data Management: All operational data is stored in one place, making it easy to track performance and identify areas for improvement.
-
Real-Time Insights: The dashboard is updated in real time, providing you with the latest data to make informed decisions.
-
Customizable: The dashboard is fully customizable, allowing you to modify charts, add new fields, and adjust metrics to fit your specific business needs.
-
Visual Data Representation: The cards and charts provide a visual representation of key metrics, helping you quickly assess performance.
-
Enhanced Decision-Making: By monitoring KPIs like Total Output, Downtime, Emissions, and Efficiency, the dashboard enables better decision-making to optimize facility performance and reduce environmental impact.
Best Practices for Using the Energy & Utility Dashboard
Click to buy Energy & Utility Dashboard in Google Sheets
To get the most out of the Energy & Utility Dashboard, consider these best practices:
-
Update Data Regularly: Ensure that all data is updated frequently to keep the dashboard reflective of current operations.
-
Monitor Key Metrics: Regularly review key metrics such as Total Output, Emissions, Downtime, and Efficiency to identify potential areas for improvement.
-
Analyze Trends Over Time: Use the Monthly Trend chart to track how performance metrics evolve month over month.
-
Leverage the Search Functionality: Use the Search Sheet Tab to quickly locate specific facilities or data points, making it easier to perform audits and reviews.
-
Collaborate with Team Members: Share the dashboard with your team to ensure everyone has access to real-time data and is aligned on key performance goals.
Conclusion
The Energy & Utility Dashboard in Google Sheets is an essential tool for managing and optimizing your energy and utility operations. With its easy-to-use interface, customizable features, and real-time insights, this dashboard helps you track key performance metrics, reduce downtime, monitor emissions, and improve facility efficiency. By using this tool, you can make more informed decisions, optimize energy usage, and ensure that your facilities are performing at their best.
Frequently Asked Questions (FAQs)
Click to buy Energy & Utility Dashboard in Google Sheets
1. How do I update the Energy & Utility Dashboard?
You can update the dashboard by entering new data into the Data Sheet Tab. The charts and cards will automatically update based on the new information.
2. Can I track multiple energy sources and facility types?
Yes, the dashboard allows you to track multiple energy sources (e.g., Solar, Wind, Thermal) and facility types (e.g., Solar Farm, Hydro Station), providing a comprehensive view of your operations.
3. How do I monitor facility performance?
Use the Overview Page and various charts (e.g., Actual vs Target Output, Efficiency, Downtime) to monitor the performance of each facility.
4. Can I share the dashboard with my team?
Yes, since the dashboard is created in Google Sheets, you can easily share it with your team for real-time collaboration and updates.
5. Is the dashboard customizable for my needs?
Yes, the dashboard is fully customizable. You can modify the layout, adjust metrics, and add new data fields to suit your specific operational needs.
Visit our YouTube channel to learn step-by-step video tutorials
Youtube.com/@NeotechNavigators