Managing personal investments requires clarity, discipline, and continuous monitoring. However, many individuals still track their investments using scattered spreadsheets, bank statements, or mobile apps that do not provide a consolidated performance view. As a result, it becomes difficult to evaluate portfolio growth, risk exposure, returns, and goal alignment.Personal Investment KPI Dashboard in Google Sheets
A Personal Investment KPI Dashboard in Google Sheets solves this problem by offering a centralized, interactive, and easy-to-use performance tracking system. It converts raw investment data into meaningful KPIs, trends, and comparisons, helping investors make informed decisions.Personal Investment KPI Dashboard in Google Sheets
What Is a Personal Investment KPI Dashboard in Google Sheets?
A Personal Investment KPI Dashboard is a ready-to-use analytical tool that tracks the performance of individual investments such as stocks, mutual funds, ETFs, bonds, fixed deposits, and other assets.
Because the dashboard runs on Google Sheets, it offers:
- Real-time updates
- Cloud access from any device
- Automatic KPI calculations
- Monthly and yearly performance tracking
- Target vs actual comparison
It allows individuals to evaluate whether their investments align with financial goals such as wealth creation, retirement planning, or income generation.
Key Features of the Personal Investment KPI Dashboard
Click to Buy Personal Investment KPI Dashboard in Google Sheets
This dashboard is designed with 6 structured worksheets, each serving a specific purpose.
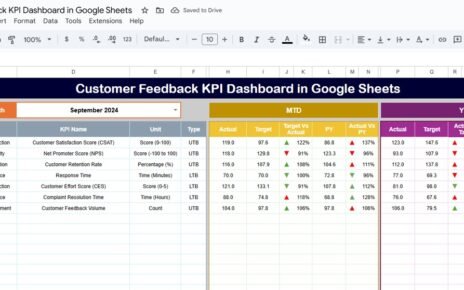
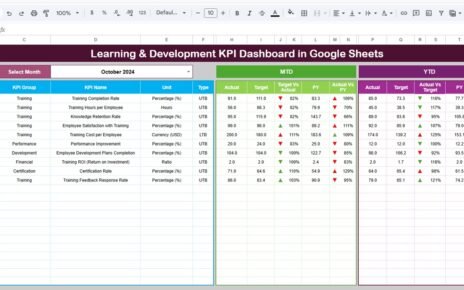
Dashboard Sheet Tab (Main Page)
The Dashboard Sheet is the summary view of all investment KPIs.
🔹 Month Selection
-
On cell D3, you can select the month from a dropdown.
-
Once selected, the entire dashboard updates automatically.
Metrics Displayed
For each KPI, the dashboard shows:
MTD (Month-to-Date)
-
Actual
-
Target
-
Previous Year
-
Target vs Actual (with up/down arrows)
-
Previous Year vs Actual
YTD (Year-to-Date)
-
Actual
-
Target
-
Previous Year
-
Target vs Actual
-
Previous Year vs Actual
Conditional formatting with green and red arrows instantly highlights performance improvements or declines.

Click to Buy Personal Investment KPI Dashboard in Google Sheets
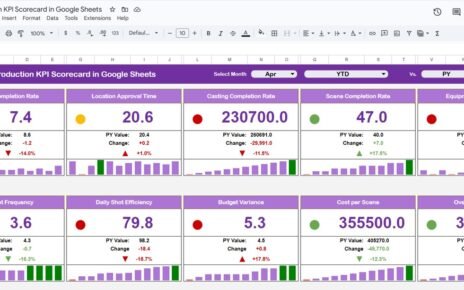
KPI Trend Sheet Tab
This sheet focuses on deep analysis of one KPI at a time.
🔹 How It Works
-
Select the KPI name from the dropdown in cell C3
The sheet displays:
- KPI Group
- KPI Unit
- KPI Type (Lower the Better / Upper the Better)
- KPI Formula
- KPI Definition
🔹 Trend Analysis
Month-wise trends help identify:
- Growth consistency
- Volatility
- Long-term performance patterns

Click to Buy Personal Investment KPI Dashboard in Google Sheets
Actual Number Sheet Tab
This sheet stores actual investment performance values.
🔹 Key Inputs
-
Enter MTD and YTD actual values
-
Select the first month of the year in cell E1
-
The structure adjusts automatically for all months
This sheet acts as the primary data source for the dashboard.

Click to Buy Personal Investment KPI Dashboard in Google Sheets
Target Sheet Tab
This sheet allows you to define expected performance goals.
🔹 Examples of Targets
-
Monthly return targets
-
Annual portfolio growth targets
-
Asset allocation targets
Targets help compare expectations against real outcomes.

Click to Buy Personal Investment KPI Dashboard in Google Sheets
Previous Year Number Sheet Tab
This sheet stores last year’s investment performance.
🔹 Benefits
-
Enables year-over-year comparison
-
Shows improvement or decline
-
Helps adjust long-term investment strategies

KPI Definition Sheet Tab
This sheet acts as a reference guide for all KPIs.
It includes:
- KPI Name
- KPI Group
- Unit
- Formula
- Definition
- KPI Type (LTB / UTB)
This ensures clarity and consistency across the dashboard.

Click to Buy Personal Investment KPI Dashboard in Google Sheets
Advantages of a Personal Investment KPI Dashboard
-
Centralized investment tracking
-
Clear visibility of returns and risk
-
Better financial decision-making
-
Goal-oriented investment planning
-
Easy performance comparison
-
No dependency on paid tools
Opportunities for Improvement
-
Add real-time market price integration
-
Include benchmark comparison (Index vs Portfolio)
-
Add goal-based tracking (retirement, education)
-
Include tax impact analysis
-
Add rebalancing alerts
Best Practices for Using the Dashboard
Click to Buy Personal Investment KPI Dashboard in Google Sheets
-
Update values monthly
-
Review asset allocation quarterly
-
Compare ROI with benchmarks
-
Keep targets realistic
-
Use YTD trends for long-term planning
-
Secure the file with access controls
Conclusion
A Personal Investment KPI Dashboard in Google Sheets provides a structured, insightful, and flexible way to track investment performance. It helps individuals monitor returns, manage risk, and stay aligned with financial goals. With automated calculations, trend analysis, and target comparison, the dashboard transforms investment tracking into a clear and actionable process.
Frequently Asked Questions (FAQs)
Click to Buy Personal Investment KPI Dashboard in Google Sheets
1. Who should use this dashboard?
Individual investors, professionals, and long-term planners.
2. Can beginners use it?
Yes, it is simple and beginner-friendly.
3. Does it support multiple asset types?
Yes, equities, debt, cash, and more.
4. Is it customizable?
Yes, KPIs and targets can be modified.
5. Do I need finance expertise?
No, basic understanding is enough.
Visit our YouTube channel to learn step-by-step video tutorials
Youtube.com/@NeotechNavigators
Watch the step-by-step video tutorial:
Click to Buy Personal Investment KPI Dashboard in Google Sheets