


In today’s data-driven world, the ability to connect and visualize data from various sources is critical for making informed decisions. One such powerful feature is Power BI’s capability to connect to web data sources. Power BI to Web Connectivity By connecting Power BI to the web, users can access live data from websites, APIs, and web-based services and integrate it into their reports and dashboards. This article will walk you through Power BI’s web connectivity feature, providing examples to showcase its versatility and utility.
What is Power BI Web Connectivity?
Power BI is a business analytics tool developed by Microsoft, designed to visualize data and share insights across an organization or embed them in an app. Power BI’s web connectivity feature enables users to import data from websites, REST APIs, and various web-based services directly into Power BI for analysis.
By leveraging this functionality, users can access dynamic and frequently updated data, which is essential for real-time reporting and decision-making. Whether you need to pull data from a public web page, access a JSON file from an API, or pull in structured data from a web service, Power BI’s web connectivity makes it all possible.
Benefits of Power BI to Web Connectivity
Power BI web connectivity offers several advantages for users:
- Real-Time Data Access: By connecting directly to web sources, you can pull real-time data into your reports and dashboards, ensuring that the insights are always up-to-date.
- Diverse Data Sources: Power BI allows connections to a variety of web data sources, including REST APIs, JSON files, and even HTML tables from websites.
- Streamlined Workflow: Connecting to web data eliminates the need for manual data imports and reduces the risk of human error, making your reporting process more efficient and automated.
- Scalability: As your data needs grow, Power BI’s web connectivity can handle large datasets from multiple sources, allowing you to scale up your operations.
- Automation: Once set up, data connections can be scheduled to refresh automatically, ensuring that your reports are updated without requiring constant attention.
Types of Web Connections in Power BI
Power BI provides various ways to connect to web-based data, each serving different use cases:
1. Web Page Scraping (HTML Tables)
One of the most straightforward ways to connect to web data is by scraping data directly from HTML tables. If a website presents structured data in a tabular format, Power BI can extract that data into a structured dataset for analysis.
- How It Works: You can use the “Web” connector in Power BI to connect to the URL of a webpage. Power BI will automatically detect any tables on the page and import them into your report.
- Example: If you want to extract stock market data from a website that provides tables of daily trading prices, you can directly link to the URL, and Power BI will import the data into a table format.
2. Connecting to Web APIs (REST API)
Many modern applications provide data through APIs, which are commonly in JSON or XML format. Power BI can connect to these APIs, enabling you to pull real-time or historical data into your reports.
- How It Works: Power BI allows you to connect to REST APIs by providing the API’s URL, along with any necessary headers and authentication tokens. The API’s response is typically a JSON object, which Power BI can parse and convert into tabular data.
- Example: Connecting to a weather service API to get the latest weather data for a specific region. This allows you to track and visualize changes in weather patterns in real time.
3. OData Feeds
OData (Open Data Protocol) is a standardized protocol used by many web services to expose data to users. Power BI supports OData connections, allowing users to query data directly from OData feeds.
- How It Works: You can connect to any OData service by providing the feed URL, and Power BI will handle the authentication and data extraction process.
- Example: You can connect to OData services provided by SharePoint, Microsoft Dynamics, or other enterprise systems, making it easier to integrate business data into your reports.
Steps to Connect Power BI to Web Data (Example: Web API)
Step 1: Open Power BI Desktop
First, open Power BI Desktop on your computer.
Step 2: Go to the Home Tab
On the Home tab, click on the Get Data button, and then select Web from the list of available data connectors.


Step 3: Provide the Web URL
In the dialog box that appears, enter the URL of the web data source (such as an API or a webpage containing a table).


Step 4: Configure Web API (If Applicable)
If you are connecting to a web API, you will need to enter additional parameters, such as headers and authentication tokens. These will be provided by the API service you are connecting to.
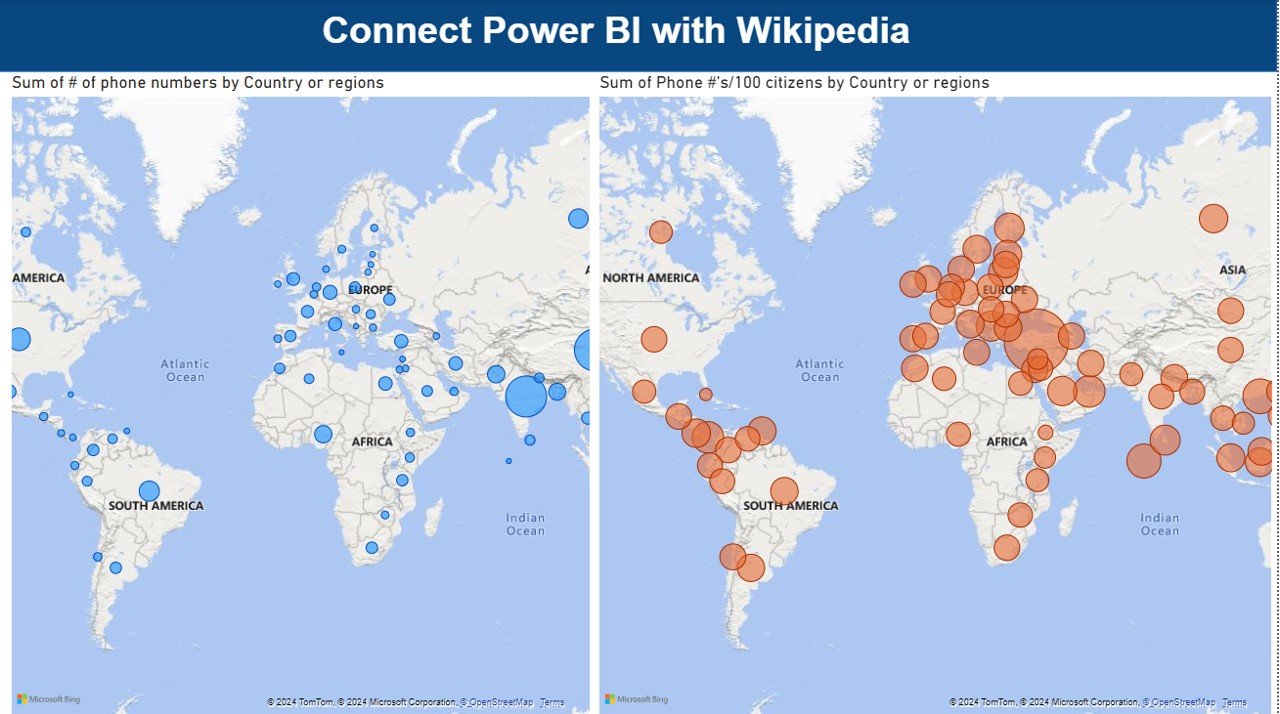
- Example API URL: https://en.wikipedia.org/wiki/List_of_countries_by_number_of_mobile_numbers_in_use
Step 5: Load Data
After configuring the connection, click OK. Power BI will fetch the data and show a preview. You can now transform the data using Power Query to clean and shape it as needed.
Step 6: Refresh the Data
Once your connection is set up, you can schedule automatic refreshes to pull the latest data from the web source into Power BI without manual intervention.
Example: Connecting Power BI to a Public API (Weather Data)
Let’s walk through an example where we connect Power BI to a public API to retrieve real-time weather data. For this, we will use the OpenWeatherMap API.
1. Get Your API Key
Visit the Open Weather Map website and register for a free account to get your API key.

2. Enter the API URL in Power BI
Open Power BI Desktop, click on Get Data, and then select Web. Enter the following URL:
Make sure to replace your_api_key with the key you obtained.
3. Transform the Data
After connecting, Power BI will show the raw data. Click on Transform Data to open the Power Query Editor, where you can structure and filter the data. For instance, you can extract the temperature and humidity values for visualization.
4. Load the Data
Once you are satisfied with the data structure, click Close & Load to import the data into Power BI for visualization.
5. Visualize the Data
Now that the weather data is loaded, you can create visualizations such as temperature charts, humidity levels, and more to display in your report.
Troubleshooting Common Issues
While Power BI’s web connectivity is powerful, you may encounter some common issues, such as:
- Authentication Errors: Some web sources require authentication (API tokens or OAuth). Ensure that the correct credentials are provided in Power BI’s connection setup.
- Data Parsing Errors: When working with JSON or XML data from APIs, Power BI may have trouble parsing nested or complex data structures. In such cases, use Power Query to flatten the data.
- Data Refresh Issues: Sometimes, web data may not refresh correctly if the source has changed its structure or if there are connectivity issues. Ensure that your web URL and API parameters are correct.
Conclusion
Power BI’s web connectivity feature is a game-changer for anyone looking to connect and analyze web-based data. Whether it’s scraping tables from a website, pulling data from a REST API, or connecting to OData feeds, Power BI provides flexible and robust tools to integrate live data into your reports. By following the simple steps outlined in this guide, you can harness the power of web connectivity to create dynamic, data-driven dashboards that provide real-time insights for your business.
Visit our YouTube channel to learn step-by-step video tutorials
Youtube.com/@NeotechNavigators
Watch the step-by-step video tutorial:

Click here to download the practice file