
Project management is an essential component of running any successful business, and staying on top of key performance indicators (KPIs) is crucial for achieving objectives and maintaining progress. With a Project Management KPI Dashboard in Google Sheets, teams can easily monitor their project performance, compare goals against actual data, and track progress over time. This guide will walk you through creating a comprehensive and easy-to-use KPI dashboard in Google Sheets.
In this article, we’ll explore the various KPIs you should track in your Project Management KPI Dashboard, their definitions, formulas to aggregate them, and whether they should be a lower or upper value for better performance. We will also discuss the features of the dashboard template, its worksheets, and how to use it efficiently to manage your projects.
Key Features of the Project Management KPI Dashboard in Google Sheets
This Project Management KPI Dashboard is a ready-to-use template in Google Sheets that provides a holistic view of your project’s progress. Below are the features of this KPI Dashboard:
1. Dashboard Sheet Tab
Click to buy Project Management KPI Dashboard in Google Sheets
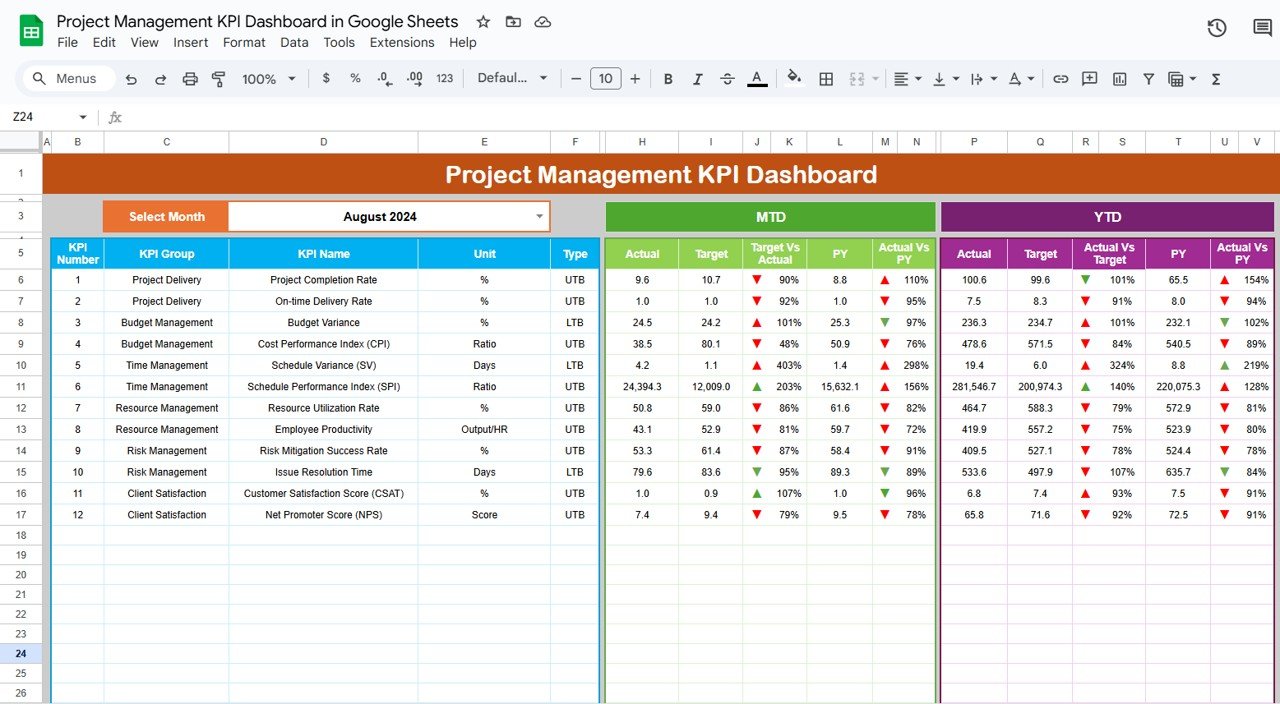
This is the main sheet where all the key performance indicators (KPIs) are displayed.
Key Features:
Select the month from the dropdown menu in cell D3, and the entire dashboard will update with the corresponding data for that month.
View MTD Actual, Target, Previous Year (PY) data, Target vs Actual, and PY vs Actual, with conditional formatting (up/down arrows) indicating performance against targets.
View YTD Actual, Target, Previous Year data, Target vs Actual, and PY vs Actual, again with conditional formatting to show if the actual numbers meet or fall short of the targets.

Click to buy Project Management KPI Dashboard in Google Sheets
2. KPI Trend Sheet Tab
This tab allows you to track KPIs over time.
Key Features:
- Select the KPI name from the dropdown (range C3) to see the KPI Group, Unit of KPI, Type of KPI, and whether the KPI’s value should be “Lower the Better” or “Upper the Better”.
- The formula for calculating each KPI is displayed along with its definition, helping you understand how each KPI is tracked.


Click to buy Project Management KPI Dashboard in Google Sheets
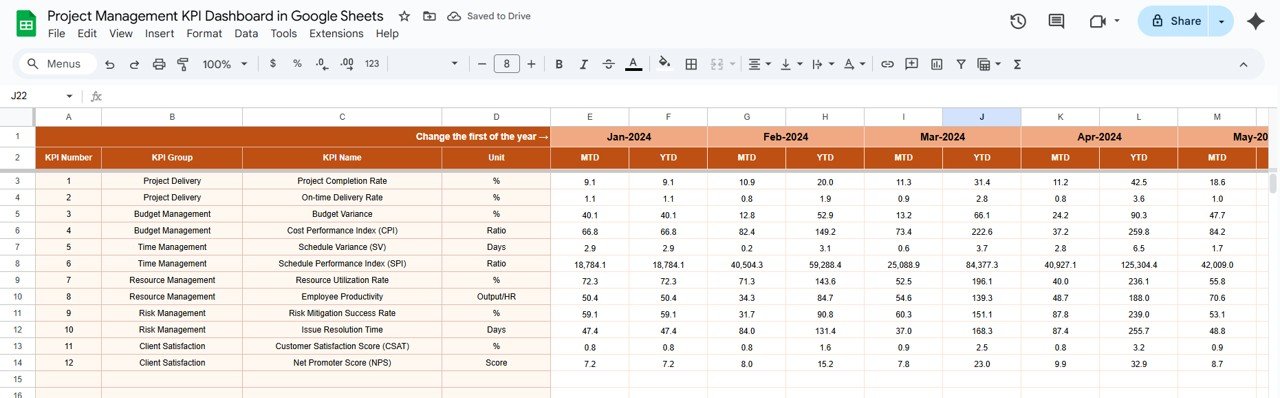
3. Actual Number Sheet Tab
Enter your actual data for MTD (Month-to-Date) and YTD (Year-to-Date) progress for a given month.
Key Features:
- Use range E1 to input the first month of the year, and enter actual numbers accordingly.

Click to buy Project Management KPI Dashboard in Google Sheets
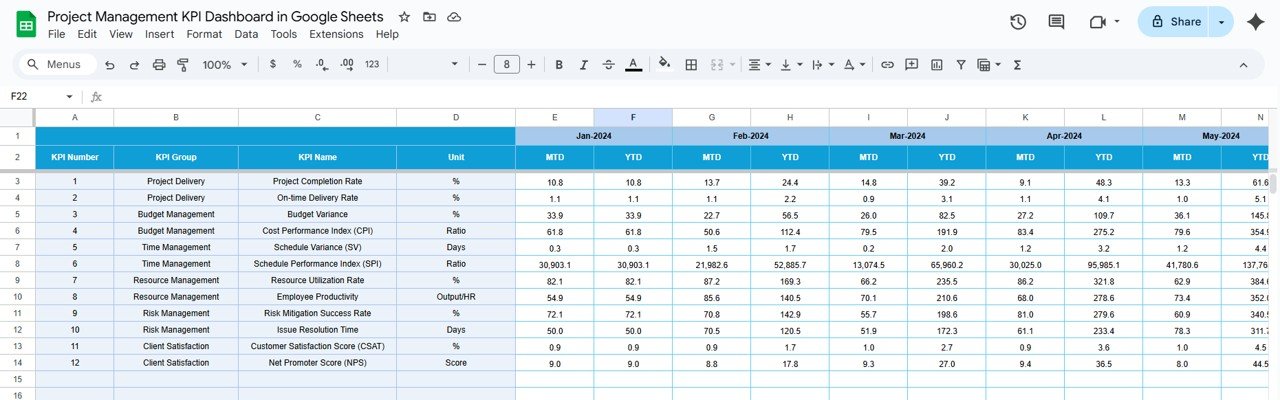
4. Target Sheet Tab
In this tab, you can enter the target numbers for each KPI for both MTD and YTD.
Key Features:
- Targets are set based on the goals for each KPI for the selected period.

Click to buy Project Management KPI Dashboard in Google Sheets
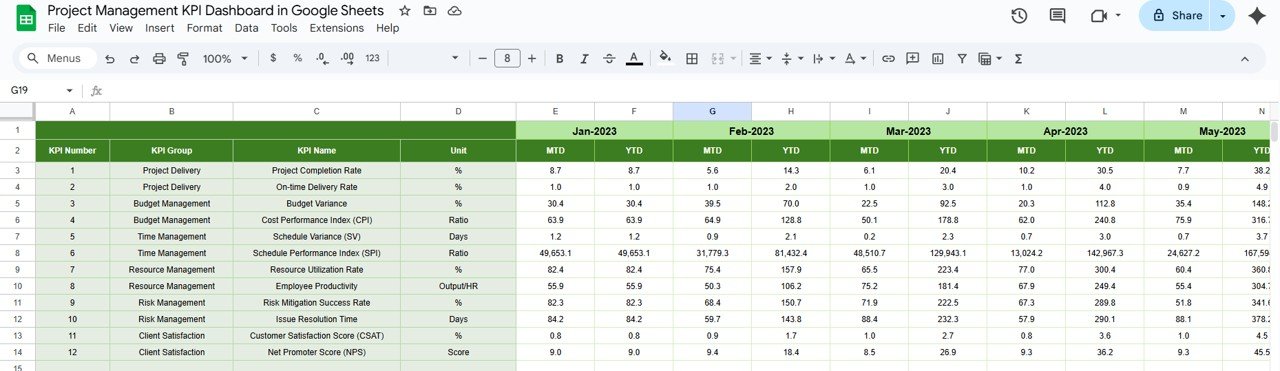
5. Previous Year Number Sheet Tab
This sheet allows you to track data from the previous year for comparison.
Key Features:
- Enter the same numbers as you’ve entered for the current year to compare your progress and identify any trends or improvements.

Click to buy Project Management KPI Dashboard in Google Sheets
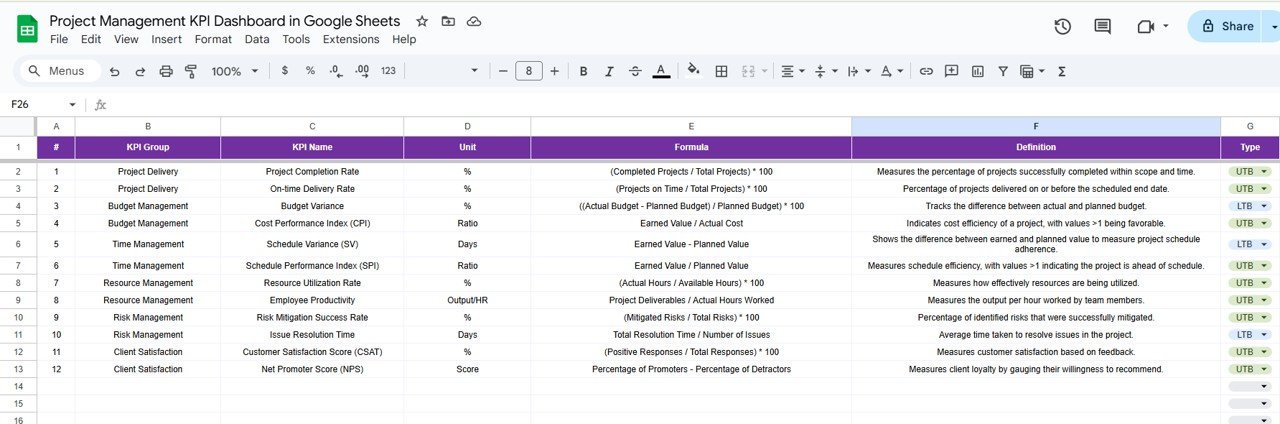
6. KPI Definition Sheet Tab
This tab serves as a reference for each KPI.
Key Features:
- Enter the KPI name, KPI group, unit, formula, and definition to ensure everyone on the team understands how the KPI is calculated and what it represents.

Click to buy Project Management KPI Dashboard in Google Sheets
Advantages of Using a Project Management KPI Dashboard
A well-organized KPI Dashboard in Google Sheets offers many benefits for project management teams:
- Centralized Information: The dashboard consolidates all key performance data in one place, making it easier for team members and stakeholders to track and evaluate performance.
-
Real-Time Updates: With the ability to select the month and update data, the dashboard ensures real-time tracking of project progress and KPIs.
-
Easy Customization: You can easily tailor the dashboard to reflect the specific KPIs that matter most to your organization and adjust the data input for ongoing project assessments.
-
Clear Performance Indicators: The conditional formatting (up/down arrows) quickly identifies areas where performance is on track or where corrective action may be needed, promoting better decision-making.
-
Historical Comparison: The Previous Year data helps you track historical performance trends, identify patterns, and benchmark against past results.
-
User-Friendly Interface: Google Sheets provides an easy-to-use interface, with dropdown menus and dynamic data inputs, making it simple for team members to input and interpret data.
Opportunities for Improvement in Project Management KPI Dashboards
Click to buy Project Management KPI Dashboard in Google Sheets
While this template is a solid foundation for project management tracking, there are always opportunities to enhance its functionality and usability:
-
Integration with Other Tools: Consider integrating the dashboard with other project management tools, such as Trello, Asana, or Jira, to automatically pull data into the Google Sheets dashboard. This would minimize manual data entry and ensure data consistency.
-
Add More KPIs: Depending on your project’s needs, you can add additional KPIs to track areas like resource allocation, risk management, and customer satisfaction.
-
Improve Data Visualization: You can further improve the data visualization by incorporating more sophisticated charts, graphs, and pivot tables, making trends and outliers even easier to spot.
-
Automated Alerts: Set up email notifications or alerts within Google Sheets using Google Apps Script when a KPI crosses a threshold (e.g., when a target is missed). This ensures immediate action and attention.
Best Practices for Using the Project Management KPI Dashboard
To maximize the effectiveness of the Project Management KPI Dashboard in Google Sheets, here are some best practices to follow:
-
Regular Updates: Update the actual numbers on a regular basis (preferably weekly or monthly), so your team has the most up-to-date data to work with. Regular updates ensure that decisions are based on current performance.
-
Collaborative Access: Share the dashboard with relevant team members to ensure transparency and allow for collaboration. Google Sheets makes it easy to give different levels of access to different users.
-
Establish Clear Targets: Set clear and realistic targets for each KPI. Targets should be aligned with your project goals and should be based on historical data, industry benchmarks, and stakeholder expectations.
-
Monitor Variance: Continuously monitor the variance between the Target vs Actual and PY vs Actual data. Understanding these variances helps identify areas that require attention and can lead to improvements.
-
Provide Detailed KPI Definitions: insure that all users understand what each KPI represents by providing clear definitions and formulas. The KPI Definition Sheet is a great reference tool for this purpose.
-
Leverage Conditional Formatting: Use conditional formatting (such as up and down arrows) to quickly visualize where the project is performing well and where improvements are needed. This helps in making quicker decisions.
Frequently Asked Questions (FAQs) with Answers
Click to buy Project Management KPI Dashboard in Google Sheets
Q1: What are the main KPIs I should track in a Project Management KPI Dashboard?
A1: Common KPIs to track include Project Completion Rate, On-time Delivery Rate, Budget Variance, Cost Performance Index (CPI), and Schedule Variance (SV). These KPIs measure project progress, cost efficiency, and timeline adherence.
Q2: Can I customize the Project Management KPI Dashboard to include other KPIs?
A2: Yes, you can easily customize the dashboard by adding additional KPIs that are relevant to your specific project needs. Google Sheets allows you to tailor the dashboard as required.
Q3: How often should I update the dashboard with actual data?
A3: It’s best to update the dashboard monthly or weekly, depending on your project’s timeline. Regular updates help keep the dashboard accurate and actionable.
Q4: How do I use the KPI Definition Sheet tab?
A4: The KPI Definition Sheet is a reference guide where you enter each KPI’s name, group, unit, formula, and definition. This ensures everyone understands how the KPIs are measured and calculated.
Q5: Can I integrate this dashboard with other tools for automation?
A5: Yes, you can integrate Google Sheets with tools like Zapier to automate the data flow from other project management tools, reducing manual entry and ensuring accurate data.
Conclusion
A Project Management KPI Dashboard in Google Sheets is an invaluable tool for tracking and managing the performance of your projects. It allows you to track KPIs, compare actual vs. target data, and gain insights into areas of improvement. By using this dashboard, you ensure that your team stays on track, delivers projects efficiently, and achieves key business goals. With features like customizable inputs, real-time data updates, and a user-friendly interface, this dashboard can help you make data-driven decisions that lead to successful project outcomes.
Visit our YouTube channel to learn step-by-step video tutorials
Youtube.com/@NeotechNavigators
Click to buy Project Management KPI Dashboard in Google Sheets
Watch the step-by-step video Demo:
