
In today’s data-driven world, businesses rely on Key Performance Indicators (KPIs) to measure and track various aspects of their operations. When it comes to ensuring high standards of quality, especially in production, customer service, or product delivery, a Quality KPI Dashboard is a crucial tool for monitoring performance.
In this article, we’ll guide you through how to create a Quality KPI Dashboard in Google Sheets, highlighting the key features, KPIs to track, and the benefits of using such a dashboard. We will also share some best practices and opportunities for improvement to help you maximize the dashboard’s effectiveness.
What is a Quality KPI Dashboard?
A Quality KPI Dashboard is a visual representation of key metrics that help businesses measure the quality of their processes, products, or services. By tracking the right KPIs, organizations can ensure that they meet customer expectations, reduce defects, and continually improve their offerings.
A Google Sheets dashboard provides a convenient and flexible platform for tracking quality metrics. It allows you to input data, track trends, and visualize KPIs, all within an easy-to-use interface that supports collaboration across teams.
Click to buy Quality KPI Dashboard in Google Sheets
Key Features of the Quality KPI Dashboard in Google Sheets
We’ve designed a Quality KPI Dashboard in Google Sheets that is both intuitive and powerful. Below are the key features of the dashboard:
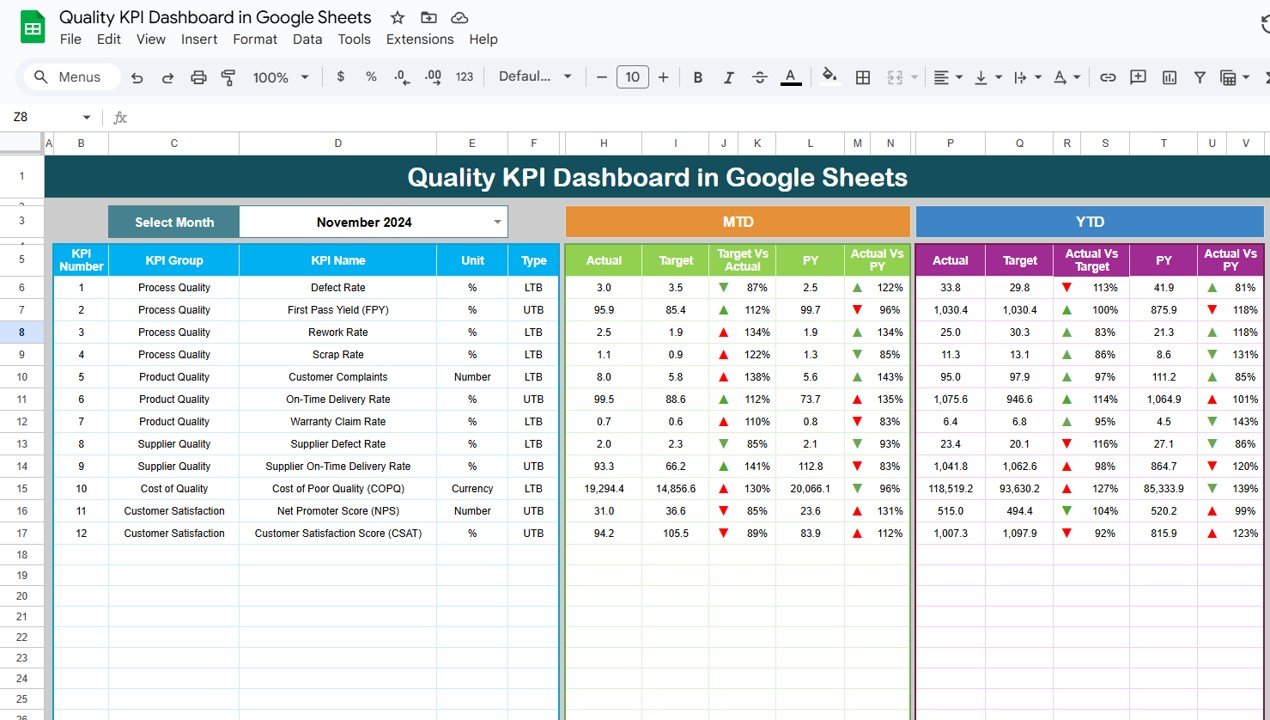
1. Dashboard Sheet Tab
The Dashboard Sheet is where you’ll find a high-level overview of your KPIs. Key features include:
-
Month Selection: In cell D3, you can select the month from a dropdown. This will automatically update all the data displayed on the dashboard for the selected month.
-
MTD (Month-to-Date) and YTD (Year-to-Date): The dashboard shows metrics for both MTD and YTD, including Actuals, Targets, and Previous Year data.
-
Target vs. Actual: A side-by-side comparison of your targets and actual performance is displayed with conditional formatting (up/down arrows) to quickly identify areas for improvement.

Click to buy Quality KPI Dashboard in Google Sheets
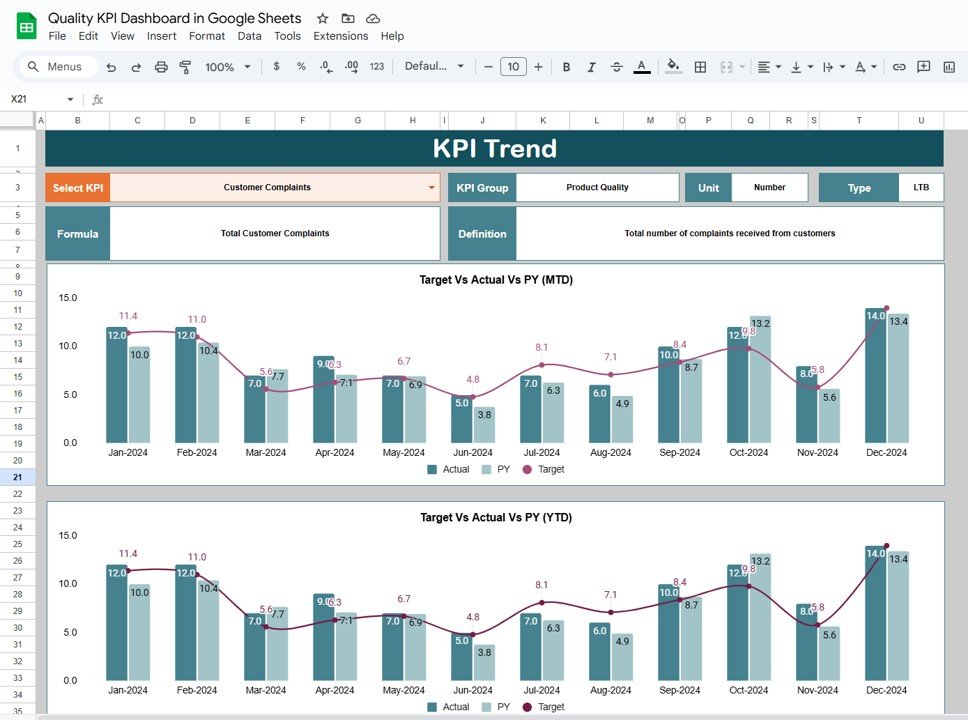
2. KPI Trend Sheet Tab
The KPI Trend Sheet helps you track the performance of each KPI over time. Features include:
-
KPI Selection: You can select the KPI name from a dropdown in C3.
-
KPI Group and Unit: This section displays the KPI group and its corresponding unit of measurement.
-
KPI Type: You can specify if the KPI is one where “Lower is Better” or “Upper is Better.”
-
KPI Formula and Definition: Detailed information about how each KPI is calculated, along with its definition.

Click to buy Quality KPI Dashboard in Google Sheets
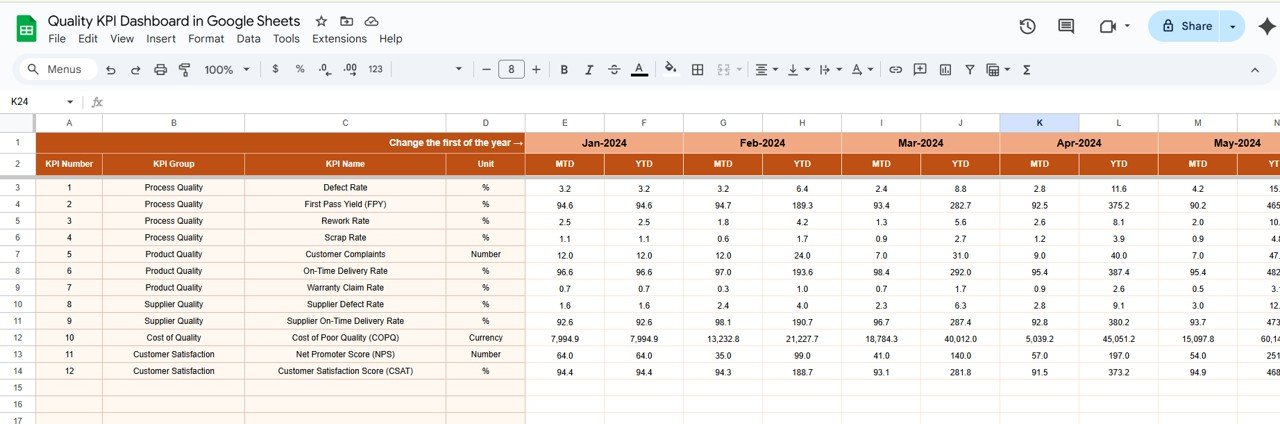
3. Actual Numbers Sheet Tab
This tab is used to input the actual numbers for both MTD and YTD data. Simply select the first month of the year in E1 and input the relevant data to update the dashboard.

Click to buy Quality KPI Dashboard in Google Sheets
4. Target Sheet Tab
Here, you can enter target values for each KPI for both MTD and YTD. This allows you to set performance goals and compare them to actual results.


Click to buy Quality KPI Dashboard in Google Sheets
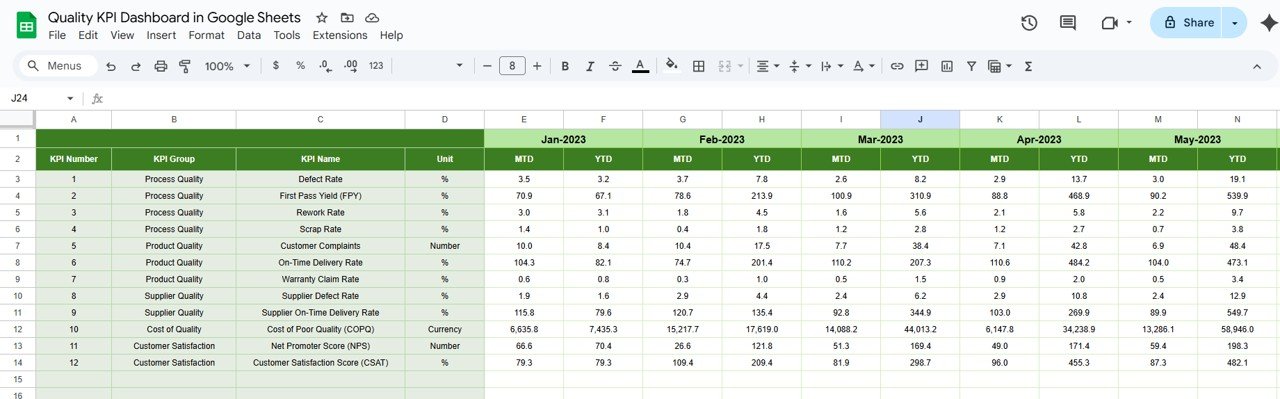
5. Previous Year Numbers Sheet Tab
This sheet enables you to input previous year data, helping you to track year-over-year changes in your KPIs.

Click to buy Quality KPI Dashboard in Google Sheets
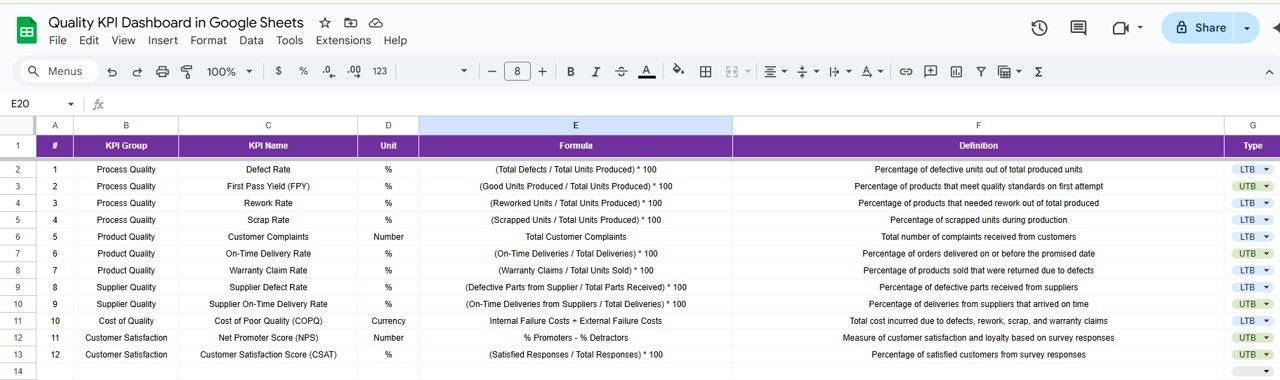
6. KPI Definition Sheet Tab
In this sheet, you define each KPI, including:
-
KPI Name
-
KPI Group
-
Unit
-
Formula
-
Definition

Click to buy Quality KPI Dashboard in Google Sheets
Advantages of Using a Quality KPI Dashboard
A Quality KPI Dashboard provides several advantages that help businesses improve their quality standards:
- Real-Time Insights: The dashboard allows managers to view real-time data, making it easier to identify quality issues as soon as they arise. This can help to quickly address problems and prevent them from escalating.
- Data-Driven Decision Making: With accurate data on quality metrics, managers can make informed decisions regarding production, quality control processes, and customer service improvements.
- Increased Efficiency: By tracking quality KPIs like First Pass Yield and On-Time Delivery, businesses can identify inefficiencies in their processes and work to streamline operations.
- Improved Customer Satisfaction: By focusing on KPIs like Customer Complaints Rate and Customer Satisfaction (CSAT), businesses can ensure that their products and services consistently meet customer expectations.
- Enhanced Product Quality: Tracking quality metrics such as Defect Rate and Product Returns Rate allows businesses to identify areas where product quality can be improved, leading to fewer returns and higher customer satisfaction.
Opportunities for Improvement in Quality KPI Dashboards
Click to buy Quality KPI Dashboard in Google Sheets
While a Quality KPI Dashboard is a powerful tool, there are several ways to improve its effectiveness:
- Integration with Other Systems: Integrating your KPI dashboard with other systems (such as ERP or CRM) can automate data collection, reducing the need for manual data entry and providing more accurate insights.
- Advanced Data Visualizations: Using advanced charts, graphs, and heatmaps can enhance the dashboard’s visual appeal and make it easier to interpret large datasets.
- Mobile-Friendly Design: Optimizing the dashboard for mobile devices allows team members to track quality metrics on the go, ensuring that important data is accessible anytime, anywhere.
- Incorporate Employee Feedback: Including employee feedback in the dashboard can provide a more comprehensive view of the quality of processes and help identify areas for improvement.
Best Practices for Creating a Quality KPI Dashboard
Click to buy Quality KPI Dashboard in Google Sheets
To get the most out of your Quality KPI Dashboard, follow these best practices:
- Focus on the Most Important KPIs: Avoid cluttering the dashboard with too many KPIs. Instead, focus on the most impactful quality metrics that directly affect your business’s success.
- Regularly Update the Data: Ensure that the data in the dashboard is updated regularly to reflect the most accurate and current performance.
- Use Conditional Formatting: Conditional formatting (like color coding and arrows) helps quickly identify trends, such as when a KPI is above or below the target.
- Provide Context for Each KPI: Ensure that each KPI on the dashboard is accompanied by a clear definition and formula. This helps users understand the metric and its relevance.
- Monitor KPIs Continuously: Make it a practice to continuously monitor KPIs rather than just reviewing them periodically. This ensures that quality issues are spotted early and addressed promptly.
Frequently Asked Questions (FAQs)
Click to buy Quality KPI Dashboard in Google Sheets
What is a Quality KPI Dashboard?
A Quality KPI Dashboard is a visual tool used to track key performance indicators that measure the quality of products, services, or processes within a business.
How do I create a Quality KPI Dashboard in Google Sheets?
To create a Quality KPI Dashboard in Google Sheets, you need to define your KPIs, input the data for MTD and YTD metrics, and visualize the data using charts and tables.
What KPIs should I include in a Quality KPI Dashboard?
Key KPIs include Defect Rate, First Pass Yield, Customer Complaints Rate, On-Time Delivery, Product Returns Rate, and Customer Satisfaction (CSAT).
How can a Quality KPI Dashboard improve my business?
By tracking KPIs like Defect Rate and First Pass Yield, you can identify inefficiencies and improve product quality, which leads to better customer satisfaction and reduced costs.
Can I customize my Quality KPI Dashboard?
Yes, you can customize your dashboard by adding new KPIs, changing formulas, and modifying the design to suit your business’s specific needs.
Conclusion
Click to buy Quality KPI Dashboard in Google Sheets
A Quality KPI Dashboard in Google Sheets is an invaluable tool for businesses that want to improve their quality standards and ensure consistent performance. By tracking the right KPIs, making data-driven decisions, and continuously improving your processes, you can enhance product quality, increase customer satisfaction, and drive overall business success.
Visit our YouTube channel to learn step-by-step video tutorials
Youtube.com/@NeotechNavigators
Click to buy Quality KPI Dashboard in Google Sheets
Watch the step-by-step video Demo:
