The robotics industry is a dynamic and rapidly evolving sector where performance tracking is essential to ensure efficiency, productivity, and innovation. The Robotics Industry KPI Dashboard in Google Sheets is a comprehensive, ready-to-use template designed to help businesses in the robotics industry monitor key performance indicators (KPIs) in real-time. This dashboard allows you to track various metrics such as production efficiency, robotic uptime, and quality control, helping you make data-driven decisions and optimize your operations.
In this article, we will walk you through the Robotics Industry KPI Dashboard in Google Sheets, exploring its key features, the KPIs it tracks, and how it can improve performance monitoring in your robotics operations.
What is the Robotics Industry KPI Dashboard in Google Sheets?
The Robotics Industry KPI Dashboard in Google Sheets is an interactive tool designed to help robotics businesses track and analyze key performance indicators that are crucial to their operations. Whether you’re focusing on production, efficiency, quality control, or downtime, this dashboard provides a centralized view of all your important metrics.
This dashboard is built with six primary worksheets that help you monitor and manage your KPIs effectively. It’s easy to customize, provides real-time data updates, and helps you visualize trends and performance gaps.
Key Features of the Robotics Industry KPI Dashboard in Google Sheets
This template includes six worksheets, each designed to track different aspects of robotic performance:
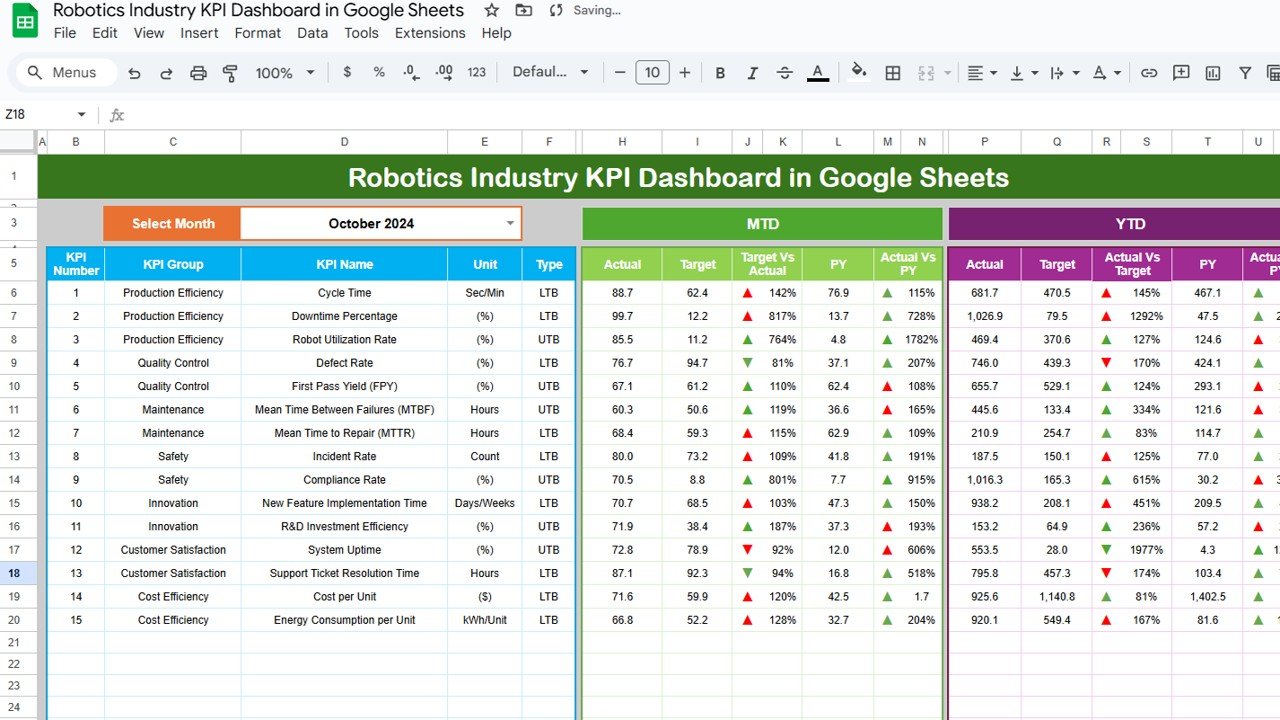
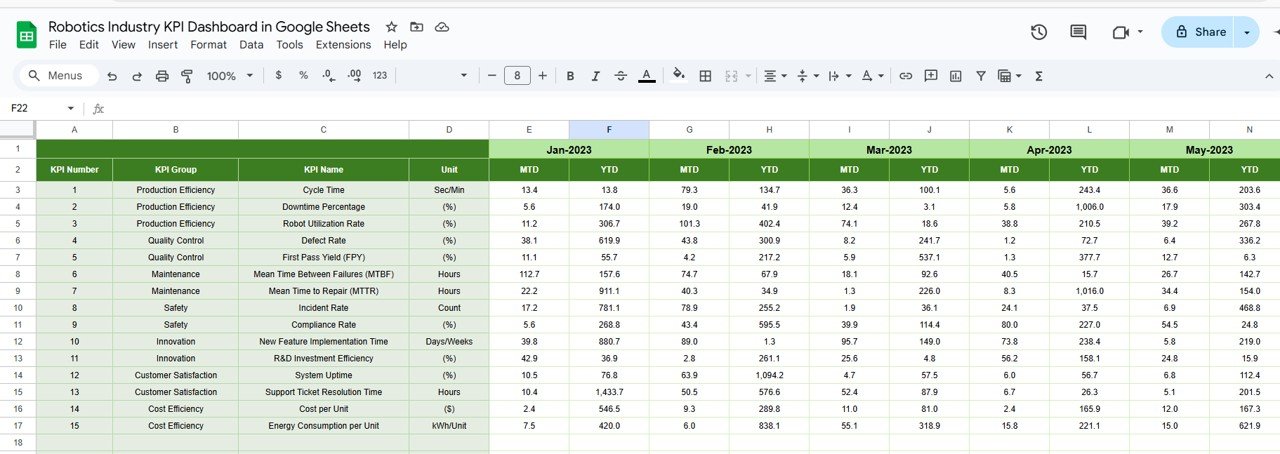
1. Dashboard Sheet Tab
The Dashboard Sheet serves as the main page of the template, providing an overview of all tracked KPIs. The key features of this sheet include:
MTD (Month-to-Date) and YTD (Year-to-Date) Metrics:
- The dashboard displays MTD and YTD actual data, target data, and previous year (PY) data for comparison.
- Conditional Formatting: Arrows (up/down) are used to indicate whether performance is above or below target and PY values.
Key Metrics Displayed:
- MTD Actual: Actual performance for the selected month.
- MTD Target: The target value for the selected month.
- PY vs Actual: Comparison of current month’s data with the same period in the previous year.
- YTD Actual: Cumulative performance for the current year.
- YTD Target vs Actual: Comparison of YTD target with actual performance.
Click to buy Robotics Industry KPI Dashboard in Google Sheets
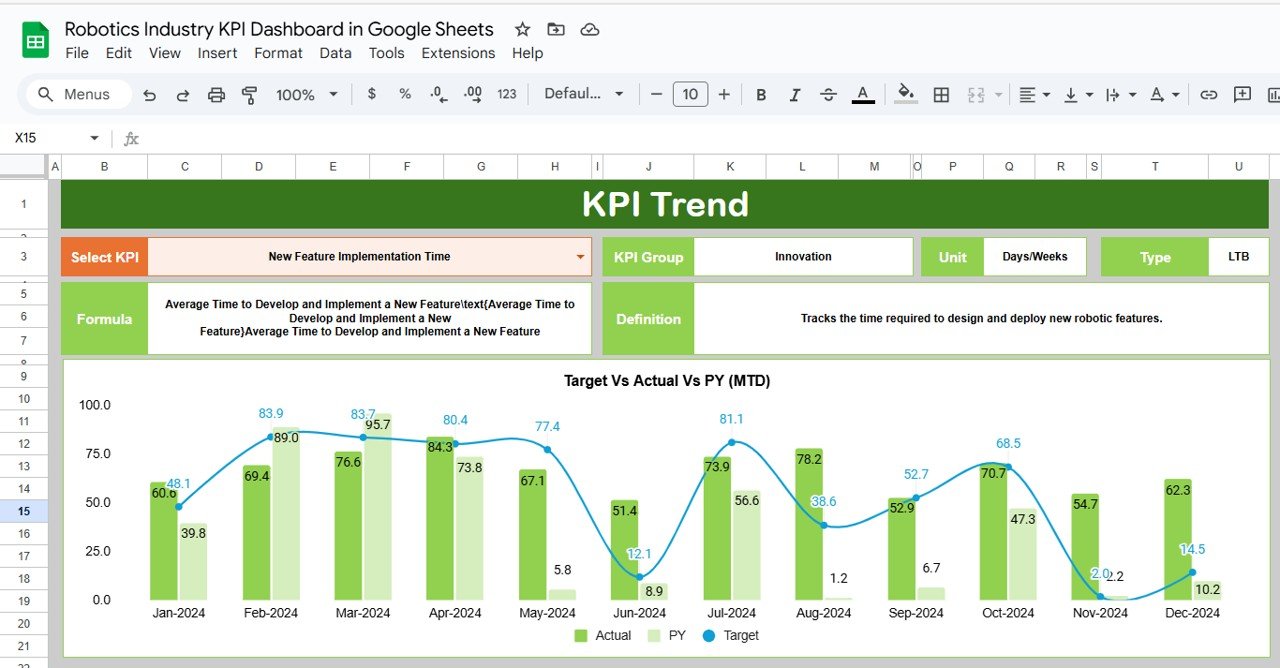
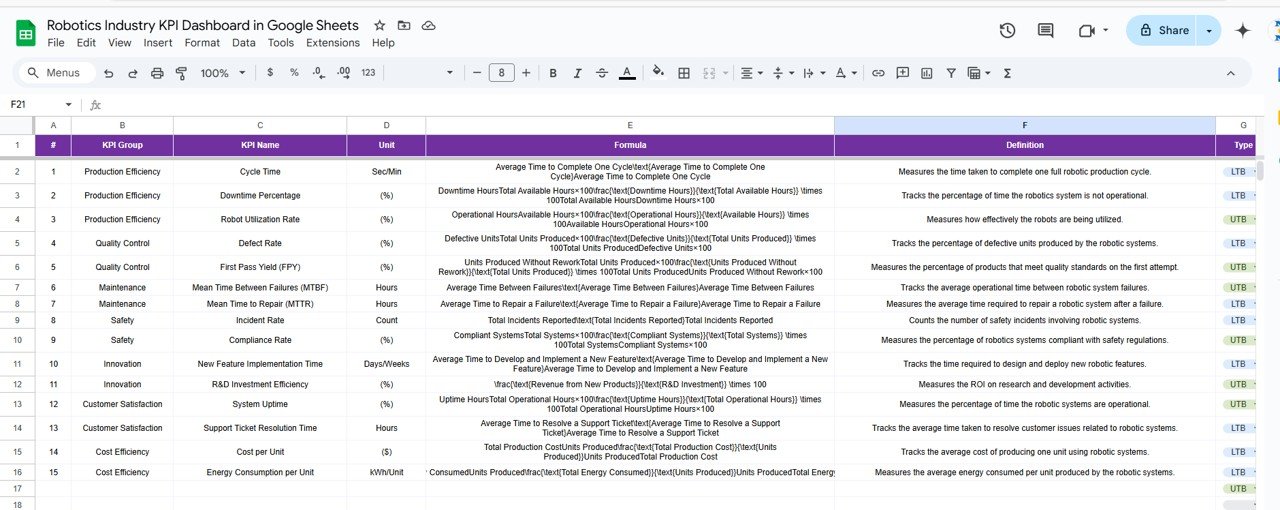
2. KPI Trend Sheet Tab
The KPI Trend Sheet allows you to track the performance of individual KPIs over time. This sheet is ideal for identifying trends and patterns in your operations.
KPI Selection Dropdown:
You can select any KPI from the dropdown in C3, and the sheet will display:
- KPI Group: The category of the KPI (e.g., production, operational efficiency, robotics downtime).
- Unit of KPI: The unit of measurement for each KPI (e.g., hours, percentage, units produced).
- Type of KPI: Whether the KPI is “Lower the Better” or “Upper the Better.”
- Formula of KPI: The formula used to calculate each KPI.
- KPI Definition: A detailed explanation of what each KPI measures and its relevance to robotics performance.
Click to buy Robotics Industry KPI Dashboard in Google Sheets
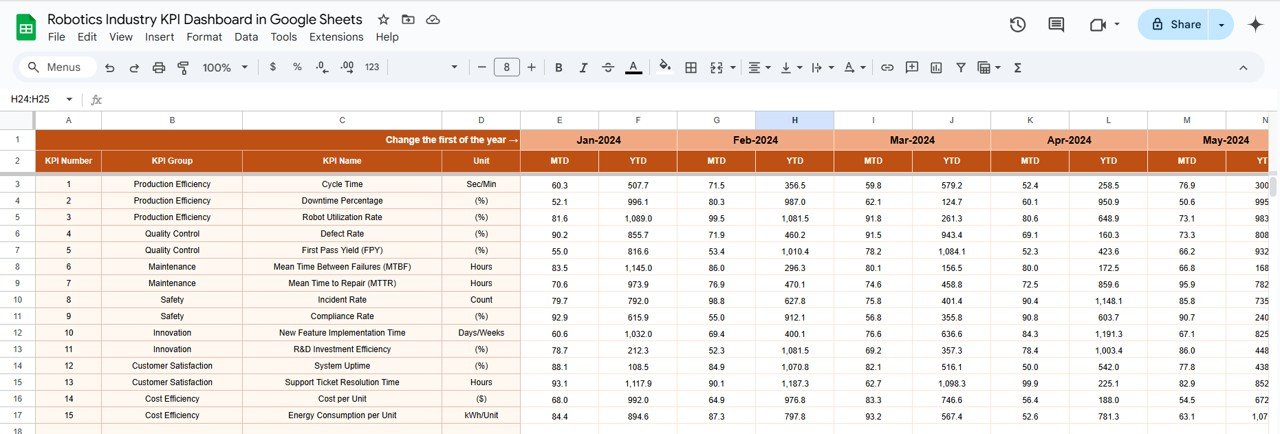
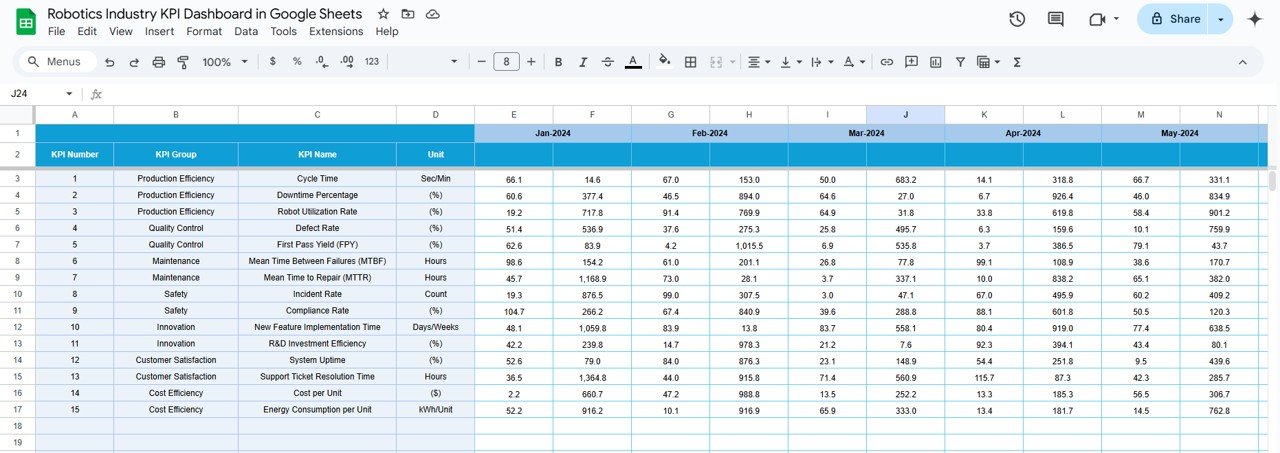
3. Actual Number Sheet Tab
The Actual Number Sheet is where you input the actual performance data for each KPI for MTD and YTD. This sheet updates the entire dashboard based on the data entered.
-
Monthly Data Entry:
Enter the actual values for each KPI based on the selected month (displayed in E1), ensuring the dashboard stays up to date.
4. Target Sheet Tab
The Target Sheet allows you to enter the target values for each KPI, both MTD and YTD. These targets serve as benchmarks for measuring performance.
-
Target Data Entry:
You input the target values for each KPI for both MTD and YTD. These values will then be compared with actual performance on the dashboard.
Click to buy Robotics Industry KPI Dashboard in Google Sheets
5. Previous Year Number Sheet Tab
The Previous Year Number Sheet stores the data from the previous year, allowing you to make year-over-year comparisons.
-
Previous Year Data Entry:
Input the previous year’s data for each KPI to track progress and identify long-term trends.
6. KPI Definition Sheet Tab
The KPI Definition Sheet provides detailed definitions for each KPI, ensuring that all stakeholders understand what each metric tracks and how it’s calculated.
-
KPI Definitions:
Each KPI is defined by its name, group, unit, formula, and explanation of its importance.
-
KPI Definition Sheet Tab Click to buy Robotics Industry KPI Dashboard in Google Sheets
Advantages of Using the Robotics Industry KPI Dashboard
-
Comprehensive Tracking:
Track all essential KPIs in one place, making it easy to monitor your robotic operations’ performance. -
Real-Time Insights:
The dashboard updates in real time as data is entered, ensuring you always have the latest performance data at your fingertips. -
Customizable for Your Needs:
Customize the dashboard to suit the specific needs of your robotics operations, from production efficiency to customer satisfaction. -
Visual Indicators:
With charts, arrows, and progress bars, the dashboard provides clear visual feedback, making it easy to identify trends and performance gaps. -
Data-Driven Decision Making:
By providing real-time performance data, the dashboard helps you make informed decisions to optimize robot efficiency, reduce downtime, and improve product quality.
Best Practices for Using the Robotics Industry KPI Dashboard
Click to buy Robotics Industry KPI Dashboard in Google Sheets
-
Regularly Update Data:
Ensure that you enter the latest data regularly to maintain an accurate and up-to-date view of your performance. -
Monitor Key KPIs:
Focus on the most important KPIs for your operations, such as robotic uptime, production efficiency, and cost per unit. -
Review Year-Over-Year Trends:
Use the Previous Year Number Sheet to track progress over time and compare current performance with historical data. -
Leverage Insights for Continuous Improvement:
Use the insights provided by the dashboard to optimize processes, improve productivity, and reduce costs in your robotics operations.
Frequently Asked Questions (FAQs)
1. How do I update the Robotics Industry KPI Dashboard?
Simply input the latest actual data for each KPI in the Actual Number Sheet, and the dashboard will automatically update.
2. Can I track multiple production lines with this dashboard?
Yes, the dashboard can be customized to track different production lines or systems. You can modify the Actual Number Sheet to suit your specific operations.
3. How can I monitor performance over time?
Use the KPI Trend Sheet to track each KPI’s performance over multiple months or years, helping you identify long-term trends.
Conclusion
Click to buy Robotics Industry KPI Dashboard in Google Sheets
The Robotics Industry KPI Dashboard in Google Sheets is an essential tool for monitoring and optimizing robotics operations. By tracking key metrics such as production efficiency, robot uptime, product quality, and energy consumption, the dashboard provides real-time insights that enable data-driven decision-making. Whether you are managing a robotics factory, conducting research, or optimizing production systems, this template helps you keep your operations on track and continuously improve performance.
Visit our YouTube channel to learn step-by-step video tutorials
Youtube.com/@NeotechNavigators
Watch the step-by-step video Demo:
Click to buy Robotics Industry KPI Dashboard in Google Sheets