
Telecom networks are complex systems that require continuous monitoring to ensure optimal performance, reliability, and customer satisfaction. Tracking key performance indicators (KPIs) is essential for telecom operators to identify issues, improve network quality, and make data-driven decisions.
A Telecom Network KPI Dashboard in Google Sheets provides an interactive, ready-to-use solution to monitor, visualize, and analyze all network KPIs in one centralized place.
In this article, we will explore the key features, advantages, and best practices of using this KPI dashboard for telecom operations.
What is a Telecom Network KPI Dashboard?
Click to Buy Telecom Network KPI Dashboard in Google Sheets
A Telecom Network KPI Dashboard is a Google Sheets-based tool that consolidates all telecom network KPIs into an organized and interactive dashboard. It helps network managers, engineers, and analysts monitor network performance, compare actual metrics against targets, and evaluate trends over time.
Key benefits of using a KPI dashboard for telecom networks:
-
Centralized monitoring of all network KPIs.
-
Quick visualization of network performance trends.
-
Comparison of current performance with targets and previous year metrics.
-
Identification of areas requiring attention or optimization.
-
Improved decision-making based on accurate data insights.
Key Features of the Telecom Network KPI Dashboard
This Telecom Network KPI Dashboard in Google Sheets includes six main worksheets that cover all aspects of network KPI tracking.
1. Dashboard Sheet Tab
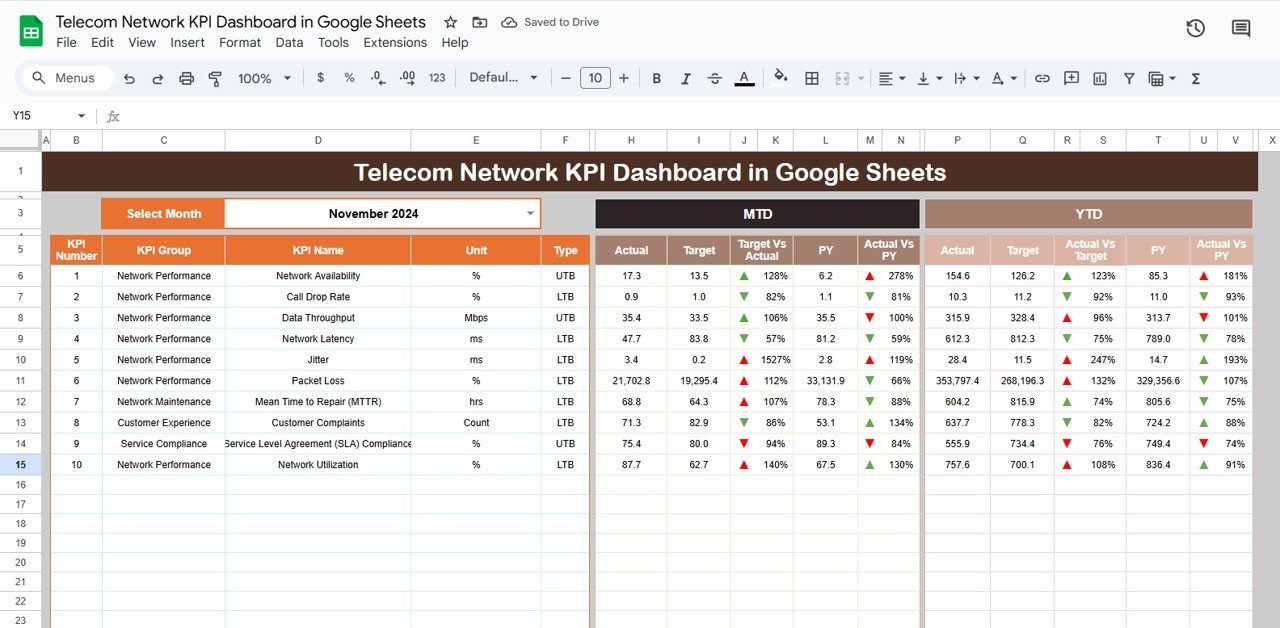
The Dashboard Sheet is the main tab that provides a complete overview of all KPIs.
Key Highlights:
-
Month Selection: Use the dropdown in cell D3 to select the month. The dashboard updates all numbers automatically.
-
MTD (Month-to-Date) Metrics: Displays Actual, Target, and Previous Year (PY) data, along with Target vs Actual and PY vs Actual comparisons with up/down conditional formatting arrows.
-
YTD (Year-to-Date) Metrics: Shows Actual, Target, and PY data for the year, with conditional formatting for performance tracking.
The Dashboard Sheet provides instant insights into telecom network performance and helps management quickly identify trends or issues.

Click to Buy Telecom Network KPI Dashboard in Google Sheets
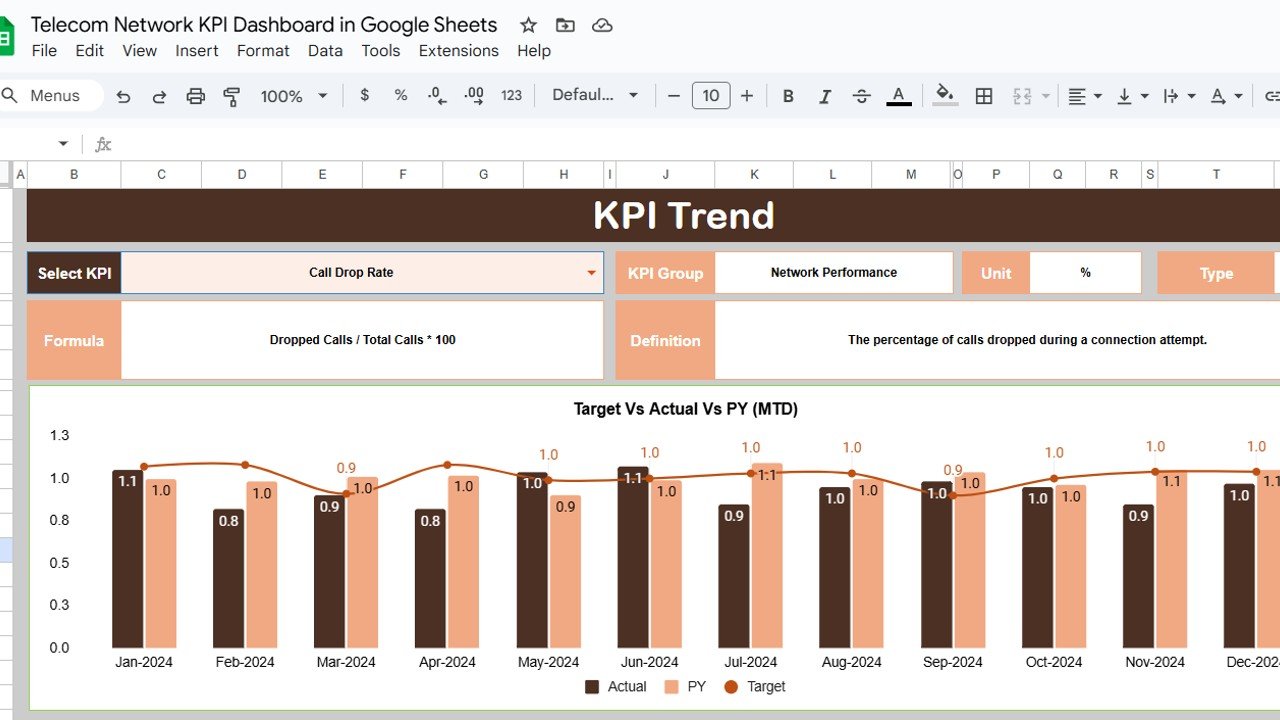
2. KPI Trend Sheet Tab
The KPI Trend Sheet allows detailed analysis of individual KPIs:
-
Select a KPI from the dropdown in cell C3.
-
Displays KPI Group, Unit, Type (Lower the Better – LTB / Upper the Better – UTB).
-
Shows the formula used for calculation and a short KPI definition.
This tab is useful for evaluating historical trends and assessing how individual KPIs are performing against targets over time.

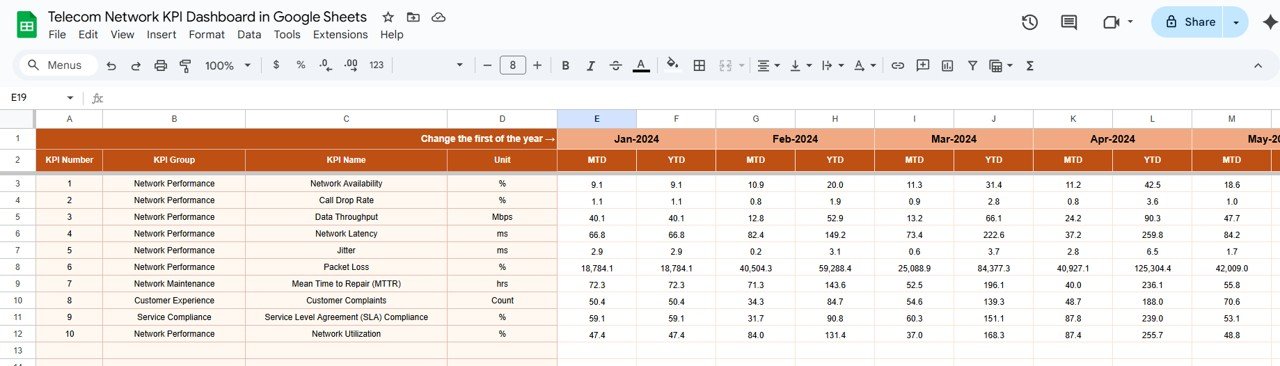
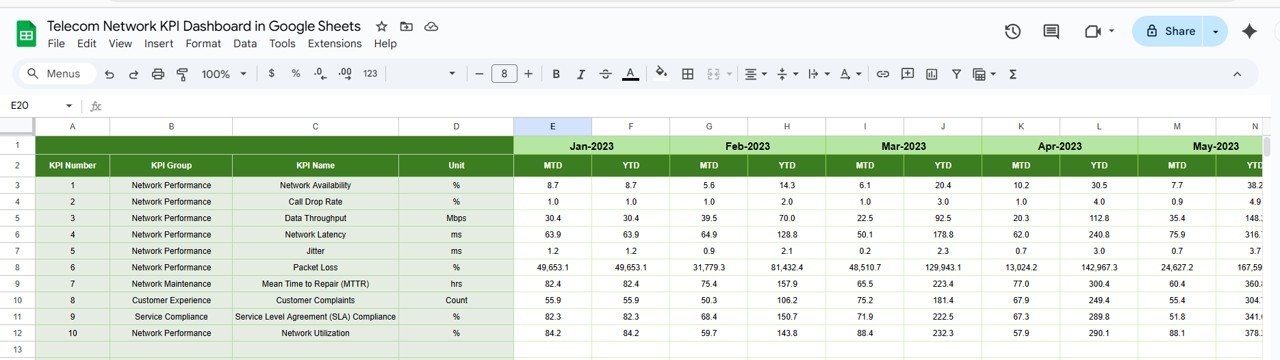
3. Actual Numbers Sheet Tab
The Actual Numbers Sheet is where network engineers input real performance data:
-
Enter MTD and YTD actual values for each KPI.
-
Change the month in cell E1 to update the dashboard dynamically.
-
This ensures the Dashboard Sheet always reflects the latest network performance.

Click to Buy Telecom Network KPI Dashboard in Google Sheets
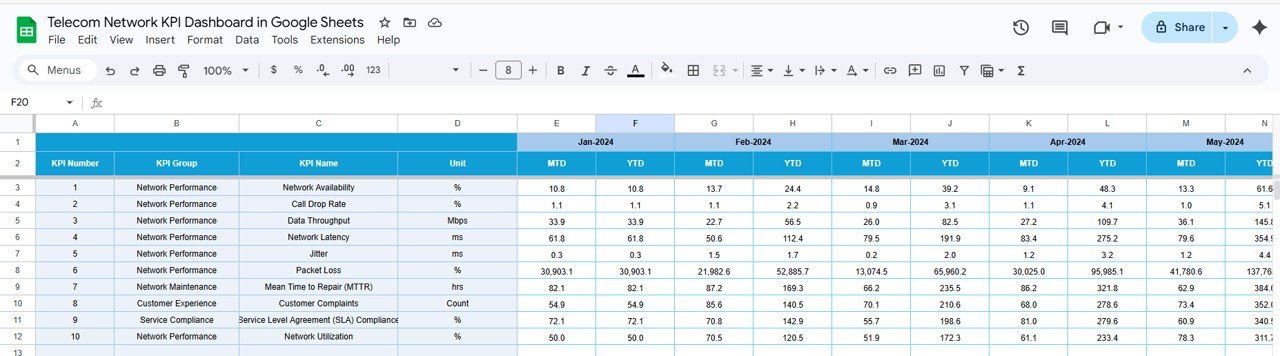
4. Target Sheet Tab
The Target Sheet allows you to define performance goals:
-
Enter monthly targets for each KPI as MTD and YTD.
-
Comparing actual performance against these targets highlights areas of overperformance or underperformance.

5. Previous Year Numbers Sheet Tab
The Previous Year Sheet helps track historical trends:
-
Enter previous year metrics for each KPI.
-
Enables easy year-over-year comparison to measure performance improvements or declines.

Click to Buy Telecom Network KPI Dashboard in Google Sheets
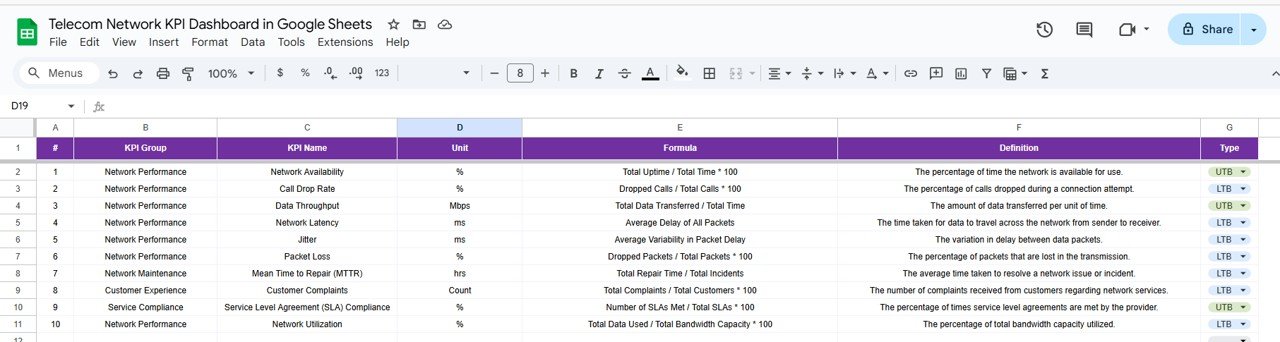
6. KPI Definition Sheet Tab
The KPI Definition Sheet provides a structured reference:
-
Enter KPI Name, KPI Group, Unit, Formula, and KPI Definition.
-
Specify if the KPI is LTB (Lower the Better) or UTB (Upper the Better).
-
Helps new users understand each KPI and ensures consistent interpretation across teams.

Advantages of Using the Telecom Network KPI Dashboard
-
Centralized Performance Monitoring: Track all network KPIs in one interactive dashboard.
-
Real-Time Insights: Update actual data to reflect current network performance instantly.
-
Trend Analysis: Compare current month’s performance against targets and previous year metrics.
-
Visual Representation: Cards, charts, and conditional formatting provide quick and easy interpretation of data.
-
Data-Driven Decisions: Make informed decisions to optimize network performance and reduce downtime.
How to Use the Telecom Network KPI Dashboard
Click to Buy Telecom Network KPI Dashboard in Google Sheets
-
Enter Actual Performance Data: Update the Actual Numbers Sheet for the current month.
-
Define Targets: Input monthly target values in the Target Sheet.
-
Review Dashboard Metrics: Monitor MTD and YTD performance in the Dashboard Sheet.
-
Analyze Trends: Use the KPI Trend Sheet to track performance over time.
-
Compare Year-Over-Year Performance: Refer to the Previous Year Numbers Sheet to assess improvements.
-
Consult KPI Definitions: Use the KPI Definition Sheet to understand each KPI and its significance.
Best Practices
-
Regular Updates: Input actual numbers promptly to maintain accuracy.
-
Consistent KPI Tracking: Ensure targets and KPIs are updated monthly.
-
Focus on Critical KPIs: Highlight key network performance metrics for quick action.
-
Use Conditional Formatting: Visual cues (arrows, color-coding) to spot deviations easily.
-
Trend Analysis: Compare trends monthly and yearly for better decision-making.
Conclusion
Click to Buy Telecom Network KPI Dashboard in Google Sheets
The Telecom Network KPI Dashboard in Google Sheets is a comprehensive tool to monitor, analyze, and manage telecom network performance. By consolidating all KPIs, providing MTD and YTD comparisons, and visualizing trends, this dashboard empowers telecom teams to ensure optimal network quality, reduce downtime, and make informed decisions based on accurate data.
Visit our YouTube channel to learn step-by-step video tutorials
Youtube.com/@NeotechNavigators
Watch the step-by-step video Demo:
