
In today’s competitive market, understanding and improving customer experience (CX) is crucial for business success. Measuring key performance indicators (KPIs) related to customer experience can help businesses identify pain points, optimize customer interactions, and drive customer satisfaction. The Customer Experience KPI Dashboard in Google Sheets is a powerful tool designed to track these essential KPIs, giving you real-time insights into your customer interactions.
In this article, we will explore the Customer Experience KPI Dashboard in Google Sheets, its features, and how it can help improve customer satisfaction through performance tracking and data-driven decisions.
What is the Customer Experience KPI Dashboard in Google Sheets?
The Customer Experience KPI Dashboard in Google Sheets is an interactive template designed to help businesses monitor the key metrics that influence customer satisfaction. This ready-to-use template provides a comprehensive view of your customer experience performance, from customer satisfaction scores and retention rates to support response times and service quality.
The dashboard contains six main worksheets, each focused on different aspects of customer experience. These sheets allow you to track performance across multiple KPIs, providing a clear and actionable overview of your customer interactions.
Key Features of the Customer Experience KPI Dashboard in Google Sheets
This dashboard is built with six key worksheets, each designed to focus on different aspects of customer experience:
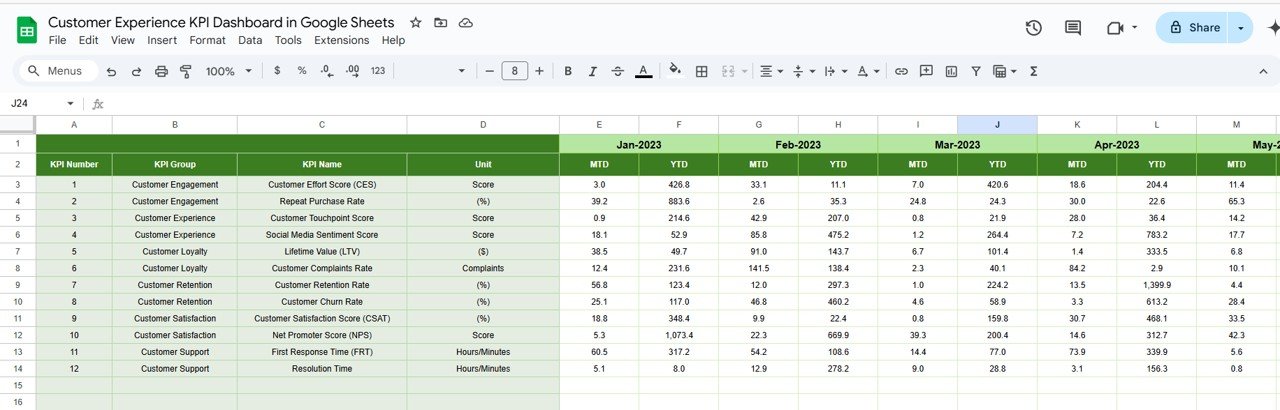
1. Dashboard Sheet Tab
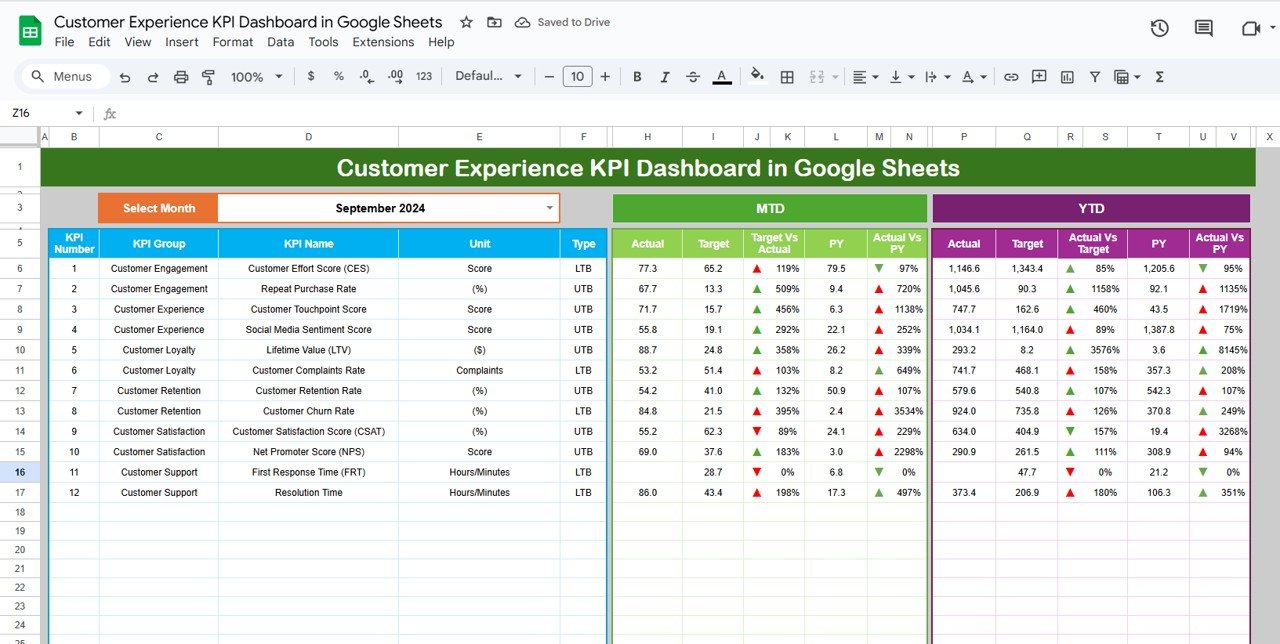
The Dashboard Sheet is the main page of the template, offering a high-level view of all the tracked KPIs. Key features include:
MTD (Month-to-Date) and YTD (Year-to-Date) Metrics:
- MTD Actual: Displays the actual data for the current month.
- MTD Target: Shows the target data for the current month.
- PY vs Actual: Compares the current month’s performance with the same period from the previous year (PY).
- YTD Actual: Cumulative actual data for the year.
- YTD Target vs Actual: Compares the YTD target with actual performance for the year.
- Conditional Formatting: Visual indicators (up/down arrows) help show whether performance is above or below the target and PY data.

Click to buy Customer Experience KPI Dashboard in Google Sheets
2. KPI Trend Sheet Tab
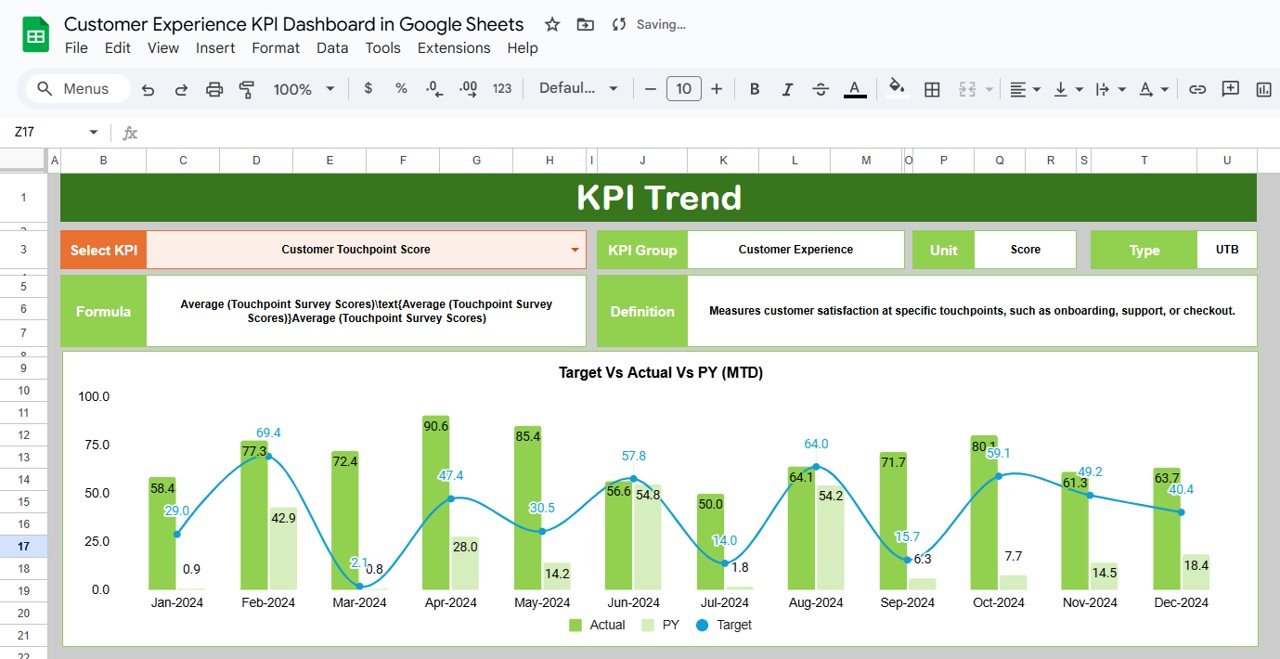
The KPI Trend Sheet helps you track individual KPIs over time, allowing you to monitor changes in customer experience performance.
KPI Selection Dropdown:
In C3, you can select a KPI, and the sheet will display:
- KPI Group: The category to which the KPI belongs (e.g., satisfaction, service quality, response time).
- Unit of KPI: The unit of measurement for the KPI (e.g., percentage, time, score).
- Type of KPI: Whether the KPI is “Lower the Better” or “Upper the Better.”
- Formula of KPI: A description of how the KPI is calculated.
- KPI Definition: An explanation of what each KPI measures and its relevance to customer experience.

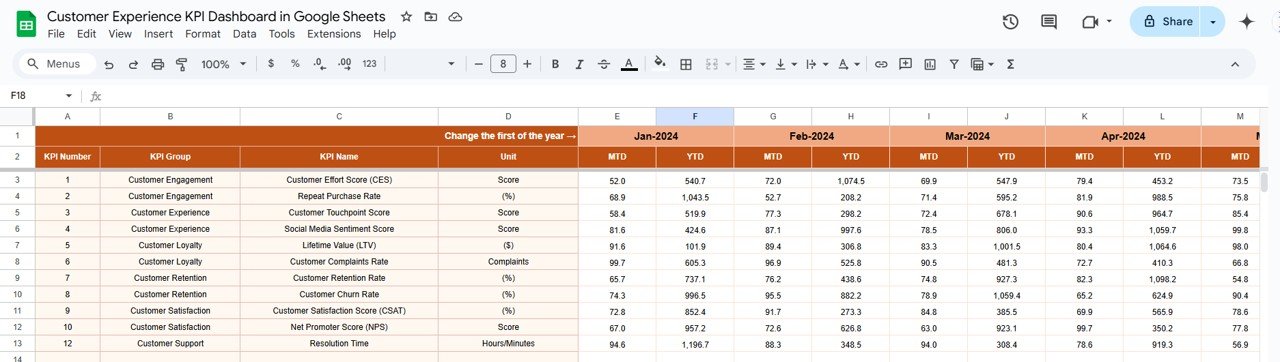
3. Actual Number Sheet Tab
The Actual Number Sheet is where you enter the actual data for MTD and YTD. This data updates the dashboard and provides real-time performance metrics.
-
Monthly Data Entry:
Enter the actual data for each KPI for the selected month (indicated in E1), and the dashboard will automatically update.

Click to buy Customer Experience KPI Dashboard in Google Sheets
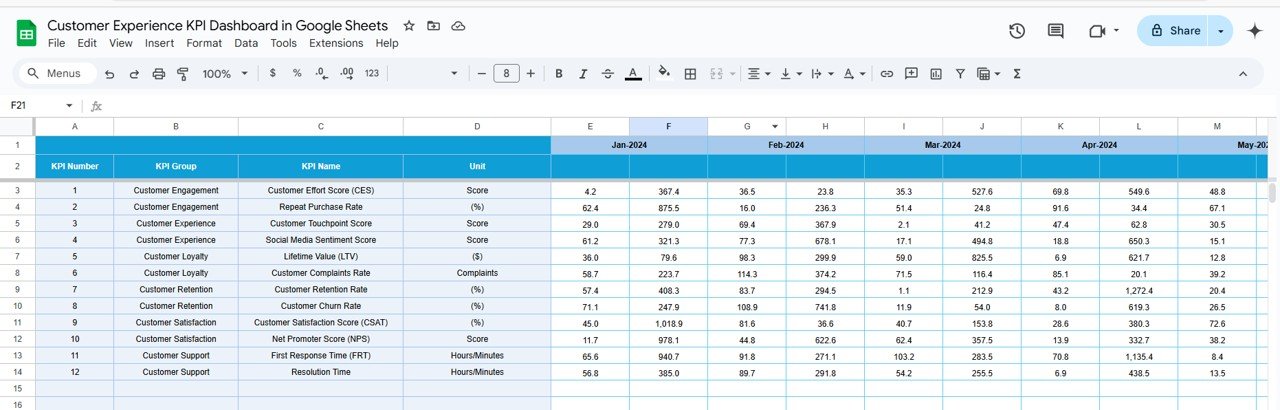
4. Target Sheet Tab
The Target Sheet allows you to enter your target values for each KPI, both MTD and YTD. These targets are used to measure performance and identify areas for improvement.
-
Target Data Entry:
Enter your target values for each KPI, and compare them with actual performance in the dashboard.

5. Previous Year Number Sheet Tab
The Previous Year Number Sheet stores the data from the previous year, enabling you to compare current performance with historical data.
-
Previous Year Data Entry:
Enter last year’s data for each KPI to assess performance improvements or declines over time.
Click to buy Customer Experience KPI Dashboard in Google Sheets
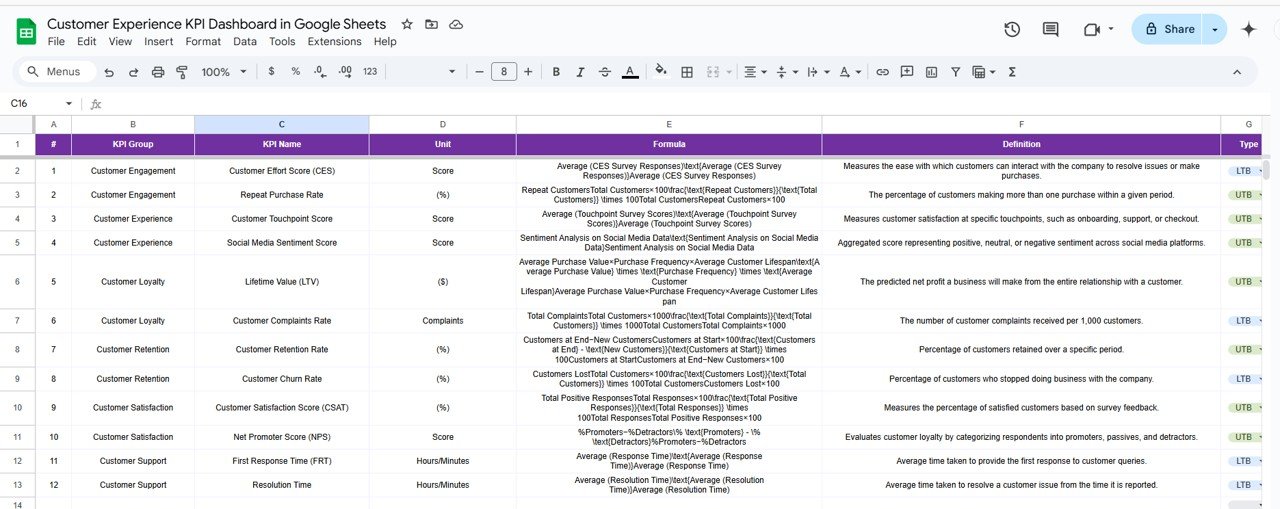
6. KPI Definition Sheet Tab
The KPI Definition Sheet provides clear definitions for each KPI, ensuring that all stakeholders understand the metrics being tracked.
-
KPI Definitions:
Each KPI is clearly defined by its name, group, unit, formula, and an explanation of what it measures and why it’s important for customer experience.

Advantages of Using the Customer Experience KPI Dashboard
-
Comprehensive Performance Tracking: Track all critical customer experience metrics in one place, from satisfaction scores and response times to case resolutions and retention rates.
-
Real-Time Insights: The dashboard updates automatically as you enter new data, ensuring that you always have the latest performance metrics available.
-
Customizable for Your Needs: The template is fully customizable, allowing you to adjust KPIs, formulas, and data points to fit your specific business needs.
-
Visual Representation of Data: With charts, graphs, and conditional formatting, the dashboard provides a visual representation of customer experience performance, making it easier to spot trends and areas for improvement.
-
Informed Decision-Making: By tracking KPIs like NPS, CSAT, and Retention Rates, you can make data-driven decisions that enhance customer loyalty, satisfaction, and overall experience.
Best Practices for Using the Customer Experience KPI Dashboard
Click to buy Customer Experience KPI Dashboard in Google Sheets
-
Regularly Update Data: Ensure that the data is entered and updated regularly, so the dashboard reflects the latest customer experience metrics.
-
Monitor Key KPIs: Focus on key KPIs such as First Response Time, Customer Satisfaction Score, and Churn Rate to monitor and improve your customer experience strategy.
-
Leverage Insights for Continuous Improvement: Use the insights from the KPI Trend Sheet to identify areas for improvement, adjust your customer experience strategy, and measure progress over time.
-
Engage with Stakeholders: Use the dashboard to collaborate with your team and stakeholders by sharing insights and tracking shared KPIs for a more unified approach to improving customer experience.
Frequently Asked Questions (FAQs)
Click to buy Customer Experience KPI Dashboard in Google Sheets
1. How do I update the Customer Experience KPI Dashboard?
Simply enter the latest data for each KPI in the Actual Number Sheet, and the dashboard will automatically update with the new performance metrics.
2. Can I track multiple customer segments with this dashboard?
Yes, the dashboard can be customized to track different customer segments by adding new columns or categories for each segment.
3. How do I compare year-over-year performance?
Enter last year’s data in the Previous Year Number Sheet to compare it with the current year’s performance and assess your improvements.
Conclusion
The Customer Experience KPI Dashboard in Google Sheets is an essential tool for monitoring and optimizing customer experience. With real-time tracking of key metrics such as satisfaction, response times, and retention rates, this dashboard helps you make informed decisions to enhance the customer journey. Whether you’re managing a small customer service team or overseeing a large organization, this dashboard provides the data-driven insights needed to improve customer satisfaction and drive business growth.
Visit our YouTube channel to learn step-by-step video tutorials
Youtube.com/@NeotechNavigators
Watch the step-by-step video Demo:

Click to buy Customer Experience KPI Dashboard in Google Sheets