
Managing daily sales efficiently is crucial for businesses to track revenue, monitor product performance, and make data-driven decisions. The Daily Sales Report Form in Google Sheets is a powerful, ready-to-use template that enables businesses to track and analyze daily sales data in an organized manner. From tracking quantities sold to monitoring sales by representative or product, this template helps streamline the reporting process. In this article, we will walk you through the key features of this form and how it can benefit your sales tracking.
What is the Daily Sales Report Form in Google Sheets?
The Daily Sales Report Form in Google Sheets is a tool designed to help businesses track daily sales activities, including product sales, sales representatives’ performance, and revenue. This form enables users to input sales data easily, view real-time metrics, and generate visual reports for analysis.
Key Features of the Daily Sales Report Form Template
Click to buy Daily Sales Report Form in Google Sheets
1. Daily Sales Form
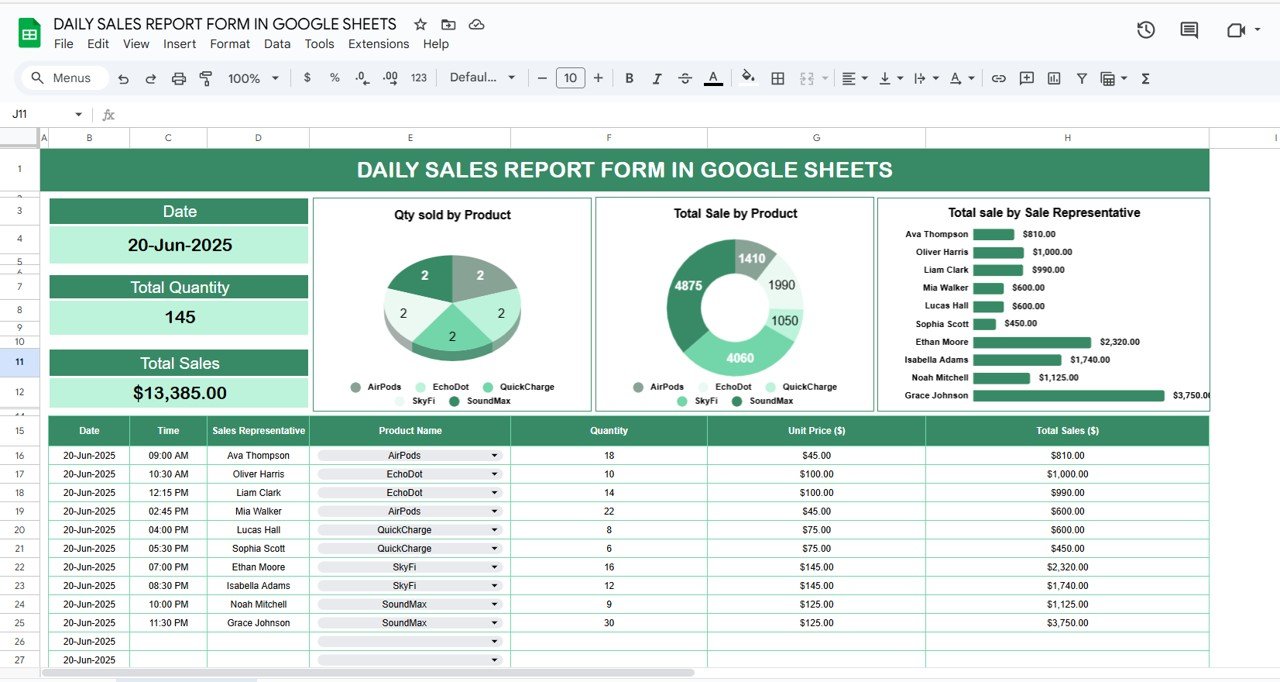
The Daily Sales Form is where you will input all sales data. This sheet includes the following features:
- Date: The date of the sale, which is selected via a dropdown (e.g., 20-Jun-2025).
- Total Quantity: Automatically calculated based on the quantity of items sold.
- Total Sales: Automatically calculated based on the total quantity sold and the unit price of the product.
Chart Analysis:
- Qty Sold by Product: A chart showing the quantity sold for each product.
- Total Sale by Product: A chart displaying the total sales for each product.
- Total Sale by Sales Representative: A chart displaying the total sales for each sales representative.
Sales Data Entry:
Here is an example of how you will enter your sales data:

Click to buy Daily Sales Report Form in Google Sheets
2. Dashboard Sheet
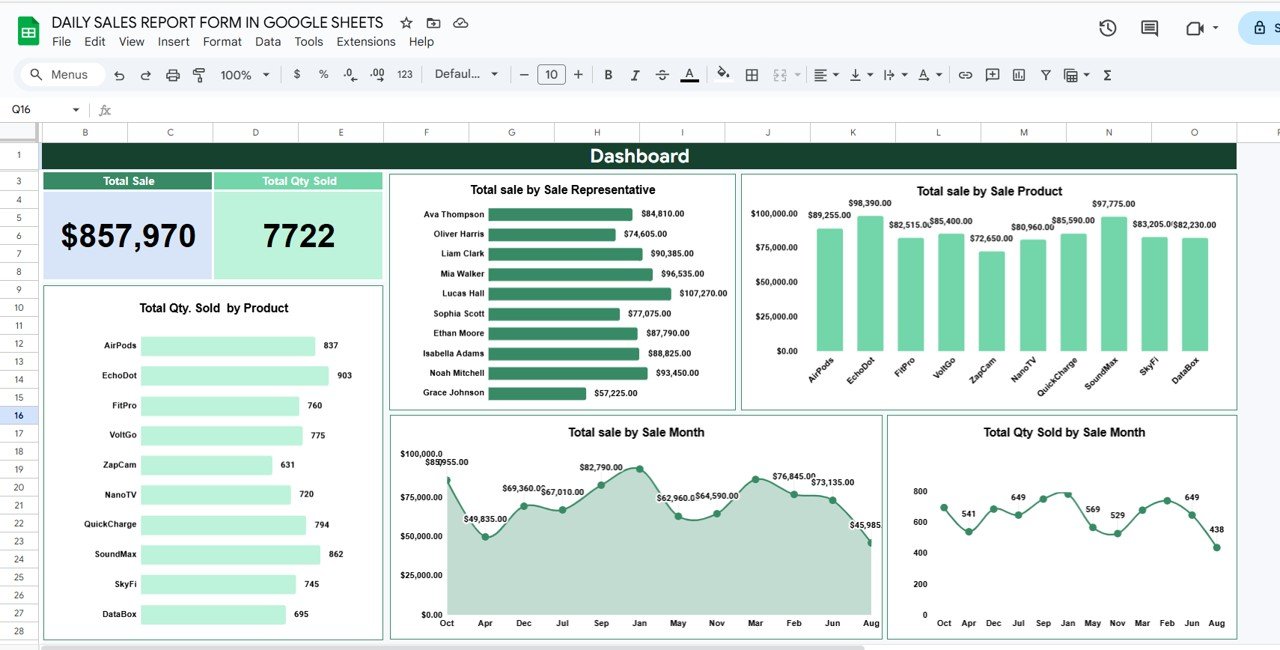
The Dashboard Sheet provides a summary of the sales performance for the selected day or month. It includes the following charts:
-
Total Sale: Displays the total sales for the day or selected period.
-
Total Quantity Sold: Shows the total quantity sold for the day.
-
Total Sale by Sales Representative: A breakdown of total sales by each sales representative.
-
Total Sale by Product: A breakdown of total sales by product.
-
Total Sale by Sales Month: A chart that shows the total sales for each month.
-
Total Quantity Sold by Sales Month: A chart showing total quantity sold by month.
-
Total Quantity Sold by Product: Displays the total quantity sold for each product.

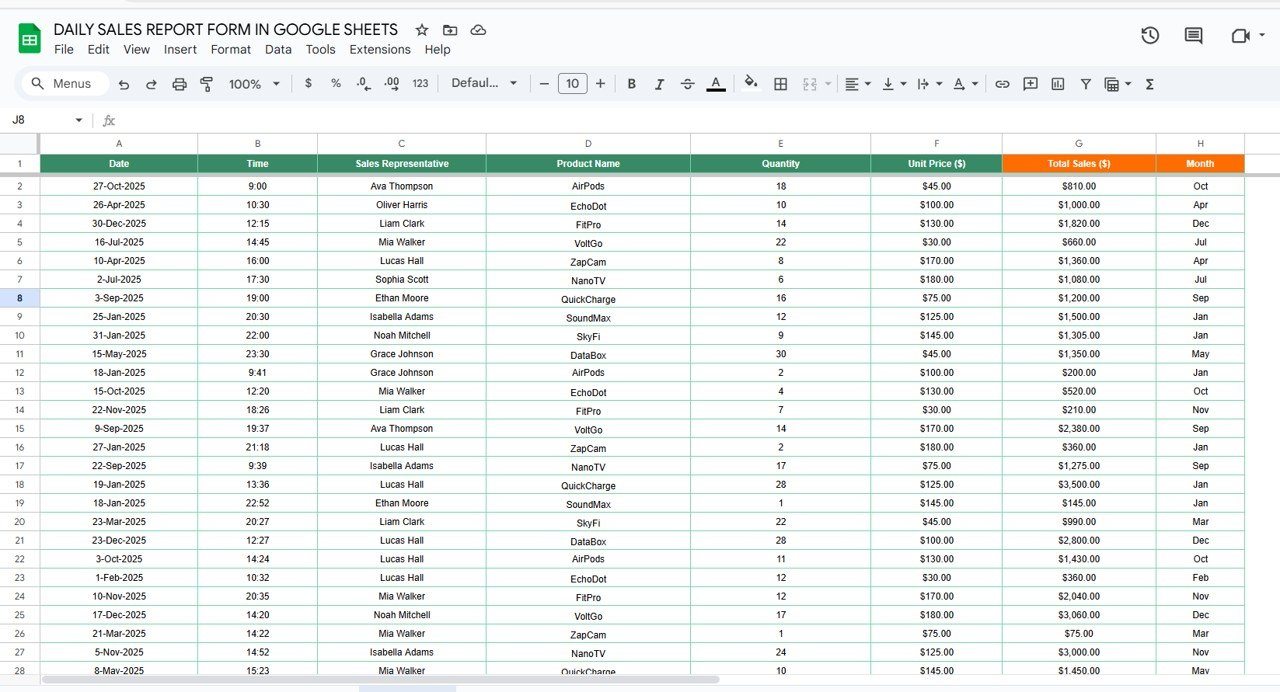
3. Database Sheet
The Database Sheet stores all the detailed sales data entered in the Daily Sales Form. This sheet functions as a data warehouse where each transaction is logged for historical analysis.

Click to buy Daily Sales Report Form in Google Sheets
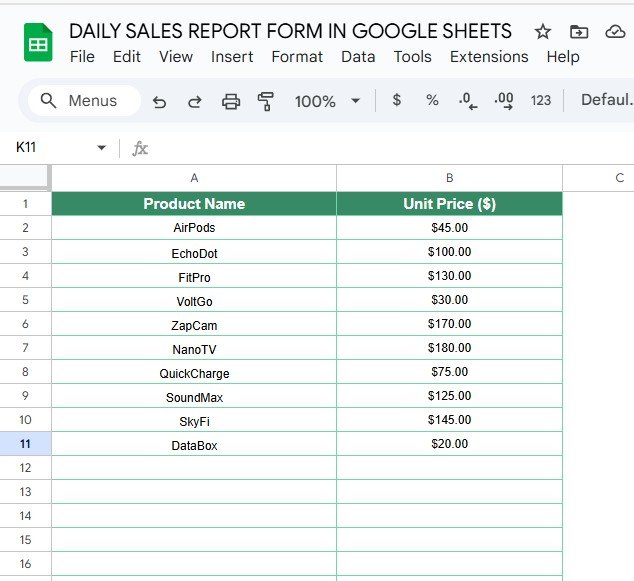
4. List Sheet
The List Sheet contains a list of products with their corresponding unit prices. This sheet allows you to easily reference and update product prices as needed.

Benefits of Using the Daily Sales Report Form
-
Streamlined Sales Tracking: Easily input and track daily sales data, ensuring that all sales transactions are recorded accurately.
-
Visual Insights: Use the charts to analyze sales performance by product, representative, and time period, helping you make data-driven decisions.
-
Automated Calculations: The form automatically calculates total quantity sold and total sales, saving time on manual calculations.
-
Customizable: You can modify the template to suit your specific sales reporting needs, including adjusting formulas or adding new fields.
-
Comprehensive Reporting: The dashboard provides a high-level summary of your sales performance, allowing you to identify trends, areas for improvement, and top-performing products.
Best Practices for Using the Daily Sales Report Form
Click to buy Daily Sales Report Form in Google Sheets
To maximize the effectiveness of the Daily Sales Report Form in Google Sheets, follow these best practices:
-
Update Daily: Ensure that you enter sales data consistently every day to maintain up-to-date records.
-
Review Performance Regularly: Use the Dashboard Sheet to review daily or monthly performance, and identify areas for improvement or optimization.
-
Track Sales Representative Performance: Use the Sales Representative charts to monitor individual performance and offer incentives or additional support where necessary.
-
Monitor Product Performance: Regularly review the Total Sale by Product chart to identify top-selling products and adjust marketing strategies accordingly.
-
Ensure Accurate Data Entry: Double-check sales data for accuracy, especially unit prices and quantities, to ensure correct total sales calculations.
Conclusion
The Daily Sales Report Form in Google Sheets is an essential tool for businesses that want to efficiently track, manage, and analyze their daily sales data. By providing automated calculations, visual charts, and a comprehensive reporting system, this template helps streamline your sales tracking process, making it easier to monitor performance, identify trends, and make data-driven decisions.
Frequently Asked Questions (FAQs)
Click to buy Daily Sales Report Form in Google Sheets
1. How do I enter sales data in the form?
You can enter sales data by filling in the Date, Time, Sales Representative, Product Name, Quantity, and Unit Price in the Daily Sales Form. The Total Sales will be automatically calculated.
2. Can I modify the form to include more data?
Yes, the template is customizable. You can add new fields or modify existing ones to suit your business needs.
3. How do I track sales performance by representative?
The Sales Performance by Sales Representative chart in the Dashboard Sheet tracks the total sales by each representative, giving you a clear view of their performance.
4. Can I track sales over time?
Yes, the Total Sale by Sales Month chart in the Dashboard Sheet tracks sales performance by month, helping you identify trends over time.
5. How can I ensure the data is accurate?
Make sure that all data is entered correctly in the Daily Sales Form and that the Unit Price and Quantity are correct. The form will automatically calculate the Total Sales based on the entered data.
Visit our YouTube channel to learn step-by-step video tutorials
Youtube.com/@NeotechNavigators
Click to buy Daily Sales Report Form in Google Sheets
Watch the step-by-step video tutorial:
