
In the modern data-driven era, businesses succeed not by collecting data—but by turning that data into actionable insights. To achieve this, teams need visibility into key performance indicators (KPIs) that show how well their data initiatives perform. This is where a Data Analytics KPI Dashboard in Google Sheets becomes invaluable.Data Analytics KPI Dashboard in Google Sheets
This dashboard empowers analysts, managers, and business leaders to monitor and measure key metrics, identify areas for improvement, and make data-backed decisions—all within an easy-to-use and collaborative Google Sheets environment.Data Analytics KPI Dashboard in Google Sheets
What Is the Data Analytics KPI Dashboard in Google Sheets?
Click to buy Data Analytics KPI Dashboard in Google Sheets
The Data Analytics KPI Dashboard in Google Sheets is a fully customizable, ready-to-use template that tracks both monthly and yearly trends across your organization’s data processes.
You can track MTD (Month-to-Date), YTD (Year-to-Date), and previous year performance, all in one place. With visual indicators like up/down arrows and conditional formatting, this dashboard is designed to help you react quickly to performance shifts.
Let’s explore what makes this dashboard so effective.Data Analytics KPI Dashboard in Google Sheets
Key Features of the Dashboard Template
The dashboard consists of 6 worksheet tabs, each serving a specific function:
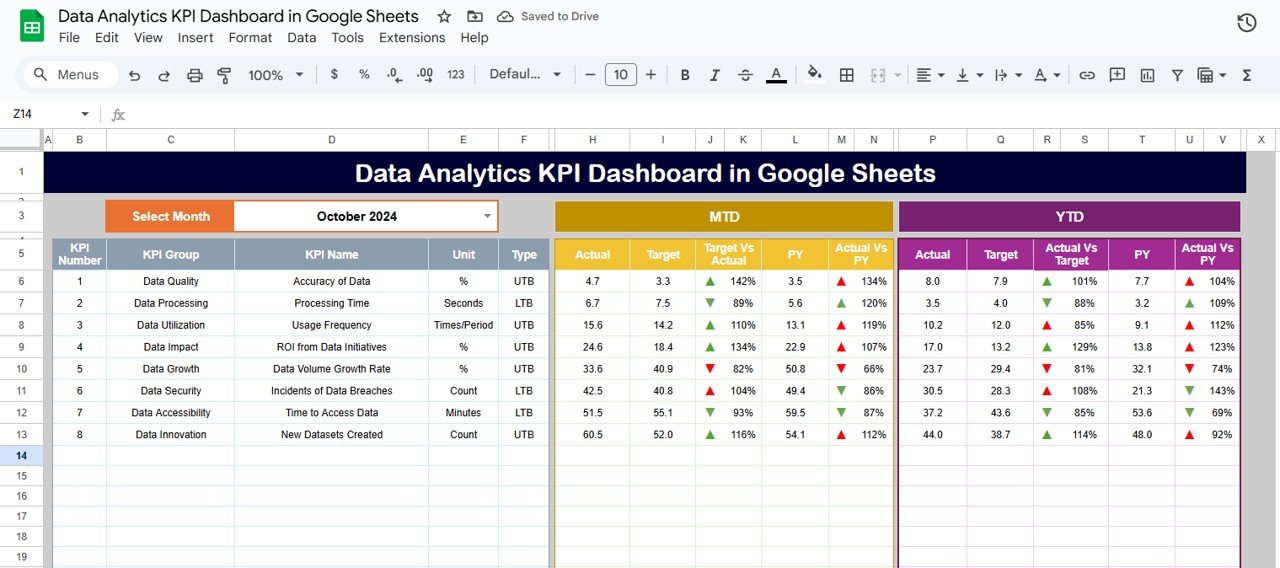
1. Dashboard Sheet Tab
-
This is the main visual dashboard.
-
Select a month from cell D3—all visuals and stats auto-update.
-
View MTD & YTD Actuals, Targets, and Previous Year comparisons.
-
Dynamic conditional formatting with up/down arrows for performance insight.

Click to buy Data Analytics KPI Dashboard in Google Sheets
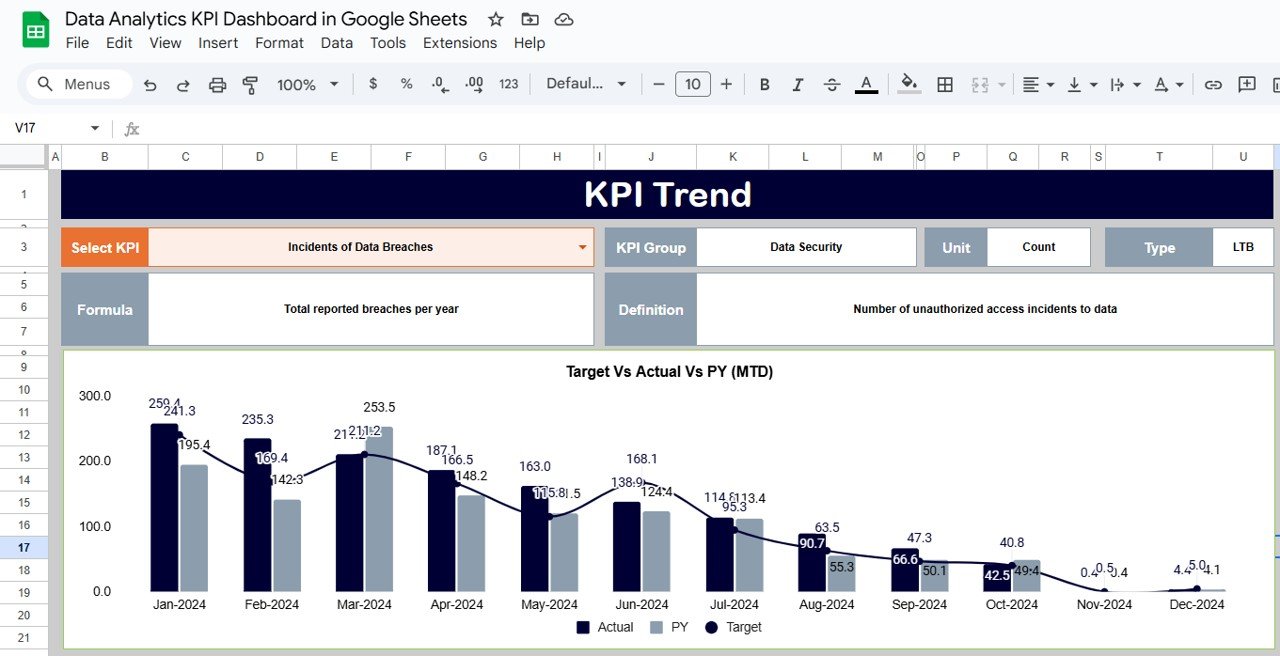
2. KPI Trend Sheet
-
Choose a KPI from dropdown in cell C3.
-
View its group, unit, performance type (UTB/LTB), formula, and definition.
-
Useful for training new users or understanding each metric in detail.

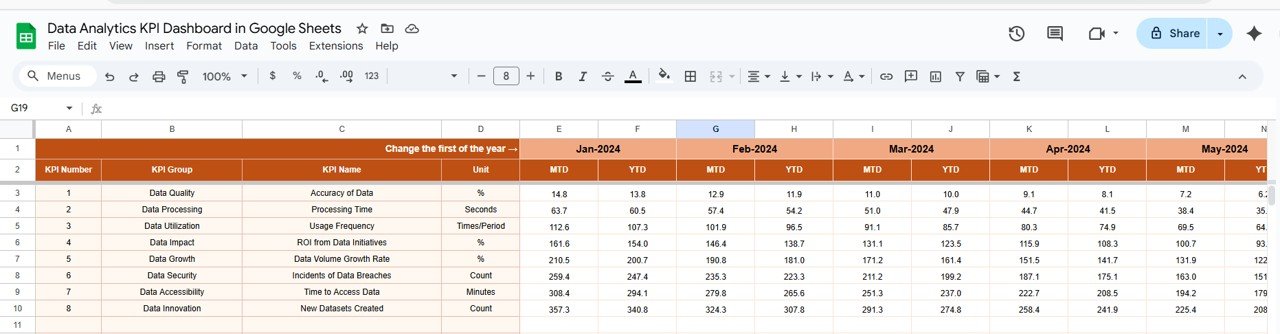
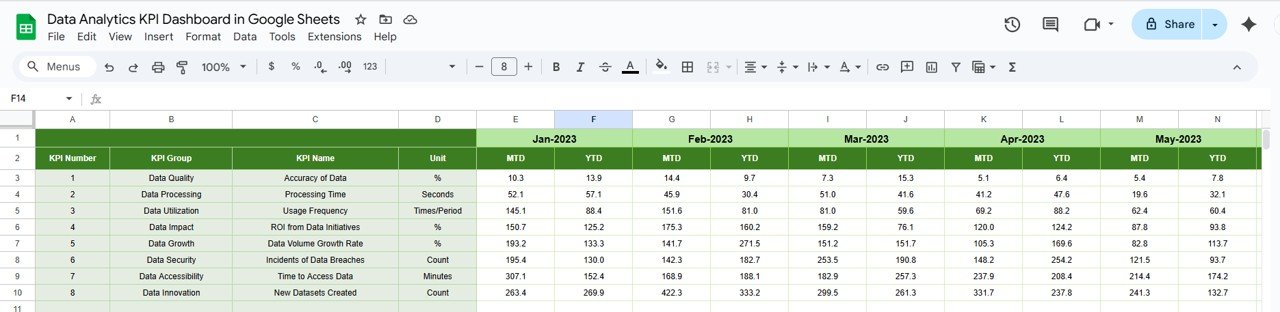
3. Actual Numbers Sheet
-
Input actual data by month.
-
Works with month selector in cell E1.
-
Tracks both MTD and YTD for all KPIs.

Click to buy Data Analytics KPI Dashboard in Google Sheets
4. Target Sheet
-
Enter your monthly and yearly targets.
-
Compare actuals vs targets automatically on the dashboard.

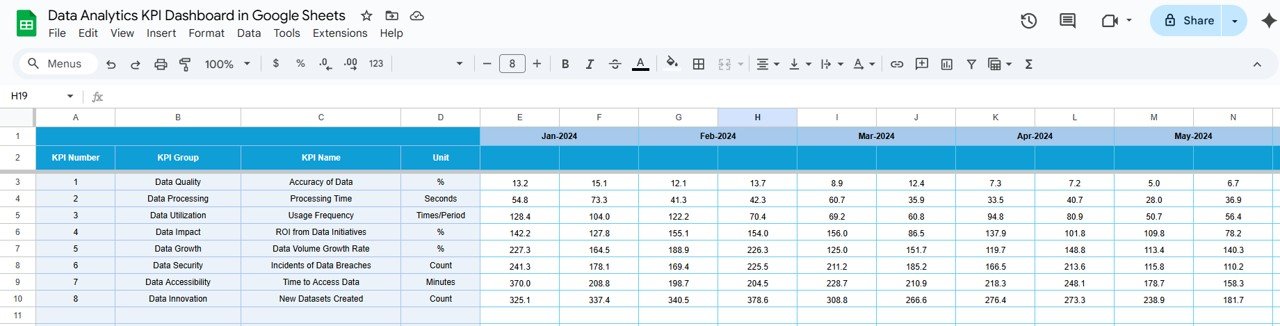
5. Previous Year Numbers Sheet
-
Populate prior year MTD and YTD values for comparative analysis.

Click to buy Data Analytics KPI Dashboard in Google Sheets
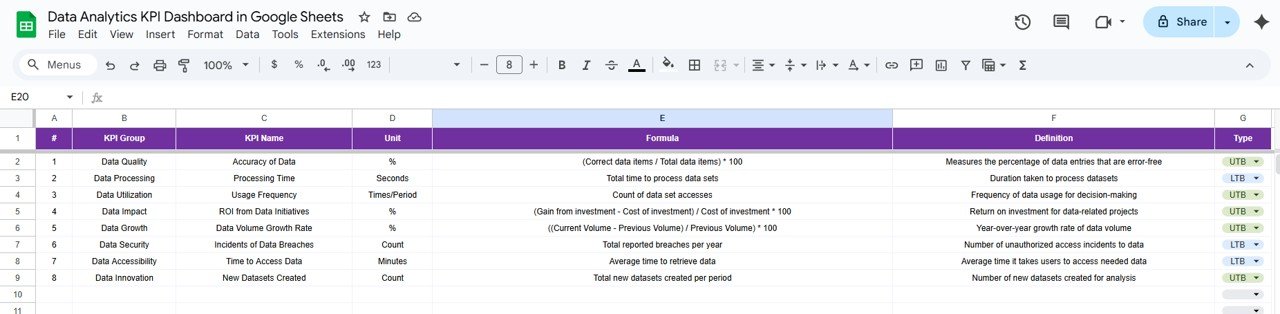
6. KPI Definition Sheet
Define every KPI clearly with:
- KPI Group
- Unit of Measure
- Formula to aggregate
- Complete KPI Definition
- Indicator Type: LTB (Lower the Better) or UTB (Upper the Better)

Advantages of Using the Data Analytics KPI Dashboard
- No Need for Expensive Tools: Google Sheets is free, lightweight, and powerful enough for many organizations.
- Real-Time Collaboration: Multiple stakeholders can access and update data simultaneously.
- Visual Storytelling with Data; Conditional formatting and arrow symbols make it easy to interpret trends.
- Performance Visibility; You can instantly identify areas performing well and those falling behind.
- Adaptability Across Departments: Use this dashboard across marketing, IT, HR, finance, and more.
- Fully Customizable; Modify KPIs, layouts, and formulas to suit your needs.
Best Practices for Data Analytics KPI Tracking
Click to buy Data Analytics KPI Dashboard in Google Sheets
-
Use Monthly Reviews: Schedule reviews to discuss trends and variances.
-
Validate Data Regularly: Ensure all entries are error-free and timely.
-
Highlight Actionable KPIs: Prioritize the metrics that directly impact decisions.
-
Train Stakeholders: Make sure everyone understands how to read and interpret KPIs.
-
Back Up Data Weekly: Google Sheets auto-saves, but backups are still wise.
Opportunities for Improvement in Your Data Analytics Tracking
Even with this dashboard, continuous improvement is key. Here are areas you can strengthen:
-
Automated Data Feeds: Integrate with Google Apps Script or APIs to auto-update values.
-
Data Integration: Pull data from sources like Google Analytics, BigQuery, or Salesforce.
-
User Segmentation: Track KPIs by region, product, or user type for deeper insights.
-
Advanced Visualizations: Add charts like line graphs or sparkline trends.
-
Access Control: Limit edit access to prevent accidental changes.
Use Cases: Who Can Benefit from This Dashboard?
Click to buy Data Analytics KPI Dashboard in Google Sheets
-
Data Analysts: Track trends, measure pipeline health, and optimize processes.
-
Marketing Teams: Measure content performance, leads, and user engagement.
-
Project Managers: Monitor project KPIs and delivery timelines.
-
Executives: Get a snapshot of business health without technical tools.
-
Startups: Run lean and smart with no-cost, high-impact analytics.
Conclusion
In summary, the Data Analytics KPI Dashboard in Google Sheets bridges the gap between raw data and meaningful insight. With a minimal learning curve, high flexibility, and rich feature set, it offers everything you need to monitor, assess, and act on your data performance.Data Analytics KPI Dashboard in Google Sheets
Whether you’re a solo analyst or leading a data team, this dashboard template will boost your visibility, drive smarter decisions, and help scale your data operations—all within the friendly confines of Google Sheets.Data Analytics KPI Dashboard in Google Sheets
Frequently Asked Questions (FAQs)
Click to buy Data Analytics KPI Dashboard in Google Sheets
Q1: Can I add my own KPIs to this dashboard?
Absolutely. Just update the KPI Definition sheet and ensure your Actual, Target, and Previous Year sheets reflect the same names.
Q2: How does the dashboard handle monthly changes?
Select the desired month from the dropdown. All KPIs automatically recalculate and adjust visuals accordingly.
Q3: Is this dashboard beginner-friendly?
Yes. You don’t need any coding knowledge. Just basic spreadsheet skills are enough to maintain and use it.
Q4: What happens if I miss entering a value?
The dashboard will either leave a blank or return a zero. You can use conditional formatting to highlight missing data.
Q5: Can I use this for multiple departments?
Yes. Create separate tabs per department or tag KPIs by department in the Definition sheet and filter accordingly.
Q6: How can I secure this dashboard?
Use Google Sheets’ built-in permission settings. Limit edit rights to data owners and view access to stakeholders.
Q7: Is this better than Excel?
For collaboration, yes. Google Sheets allows real-time editing and sharing, which Excel lacks unless used with OneDrive.
Visit our YouTube channel to learn step-by-step video tutorials
Youtube.com/@NeotechNavigators
Watch the step-by-step video Demo:
