
In today’s digital age, keeping track of e-commerce performance is essential for maximizing sales and optimizing business operations. The E-commerce Dashboard in Google Sheets is a ready-to-use tool that helps e-commerce businesses monitor key metrics such as order volume, revenue, payment methods, customer ratings, and more.
In this article, we will explain the features of the E-commerce Dashboard in Google Sheets and how it can help you efficiently manage and analyze your online store’s performance.
What is the E-commerce Dashboard in Google Sheets?
The E-commerce Dashboard in Google Sheets is an all-in-one tool that enables you to track and visualize the performance of your online store. The dashboard is designed with three sheet tabs:
Key Features of the E-commerce Dashboard in Google Sheets
Click to buy E-commerce Dashboard in Google Sheets
1) Dashboard Sheet Tab: Overview and Key Metrics
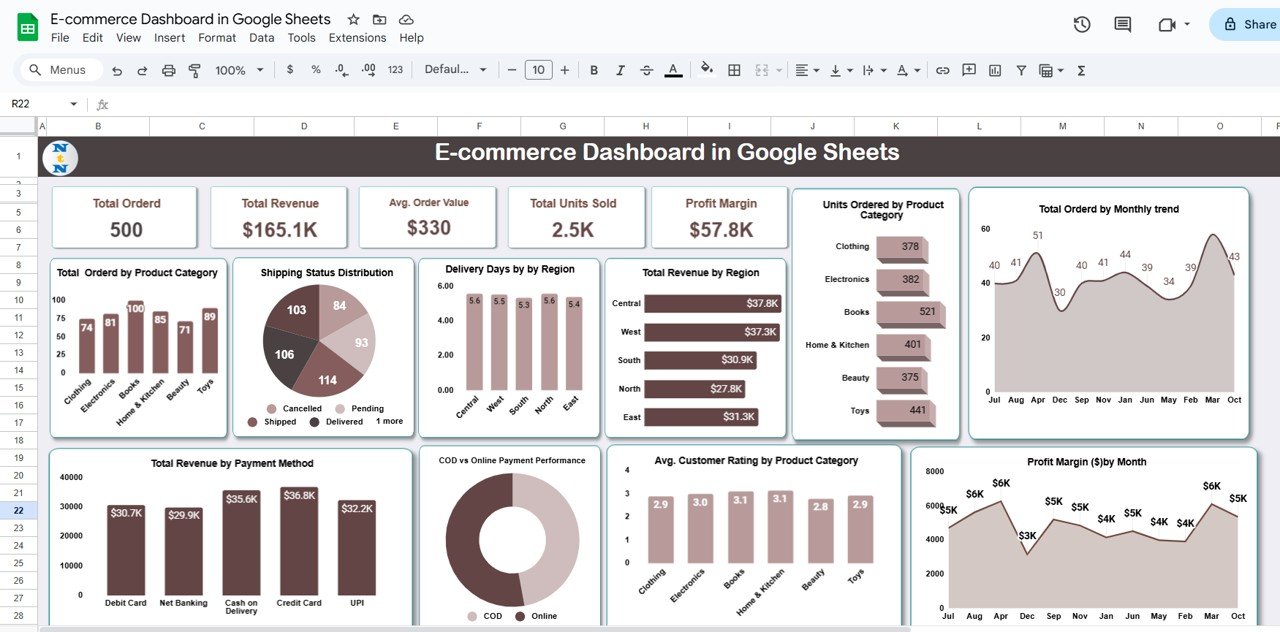
The Dashboard Sheet Tab is the main page where all the key metrics of your e-commerce business are displayed. Features include:
Cards:
- Total Ordered: Displays the total number of orders placed within a given period.
- Total Revenue: Tracks the total revenue generated by your e-commerce store.
- Avg. Order Value: Shows the average value of each order.
- Total Units Sold: Displays the total number of units sold.
- Profit Margin: Shows the profit margin for each sale.
Charts:
- Total Ordered by Product Category: Visualizes the number of orders by product category, helping you understand which products are selling the most.
- Shipping Status Distribution: Tracks the distribution of orders based on their shipping status (e.g., pending, delivered).
- Delivery Days by Region: Shows the average number of delivery days by region, helping you identify delivery performance across different locations.
- Total Revenue by Region: Displays revenue distribution by region.
- Units Ordered by Product Category: Visualizes the units sold by product category.
- Total Ordered by Monthly Trend: Tracks the trend of orders placed over time (e.g., monthly).
- Profit Margin ($) by Month: Displays the profit margin over time.
- Avg. Customer Rating by Product Category: Shows the average customer rating for products in different categories.
- COD vs Online Payment Performance: Compares cash-on-delivery (COD) versus online payment performance.
- Total Revenue by Payment Method: Tracks revenue distribution by payment method (e.g., net banking, credit card, COD).
- These charts and cards provide a comprehensive view of your e-commerce business performance, allowing you to monitor trends and identify areas for improvement.

Click to buy E-commerce Dashboard in Google Sheets
2) Search Sheet Tab: Efficient Data Filtering
The Search Sheet Tab enables you to filter and search for specific order data based on various criteria. Features include:
Search Functionality:
- Search by Search Keyword and Field Name: Allows you to filter and search by various fields such as region, order ID, payment method, and status.
Select Column and Search Keyword: Enables you to search for orders based on specific parameters, making it easier to analyze data.
This sheet helps you quickly find and view specific orders, making it an efficient tool for managing and reviewing order details.

Click to buy E-commerce Dashboard in Google Sheets
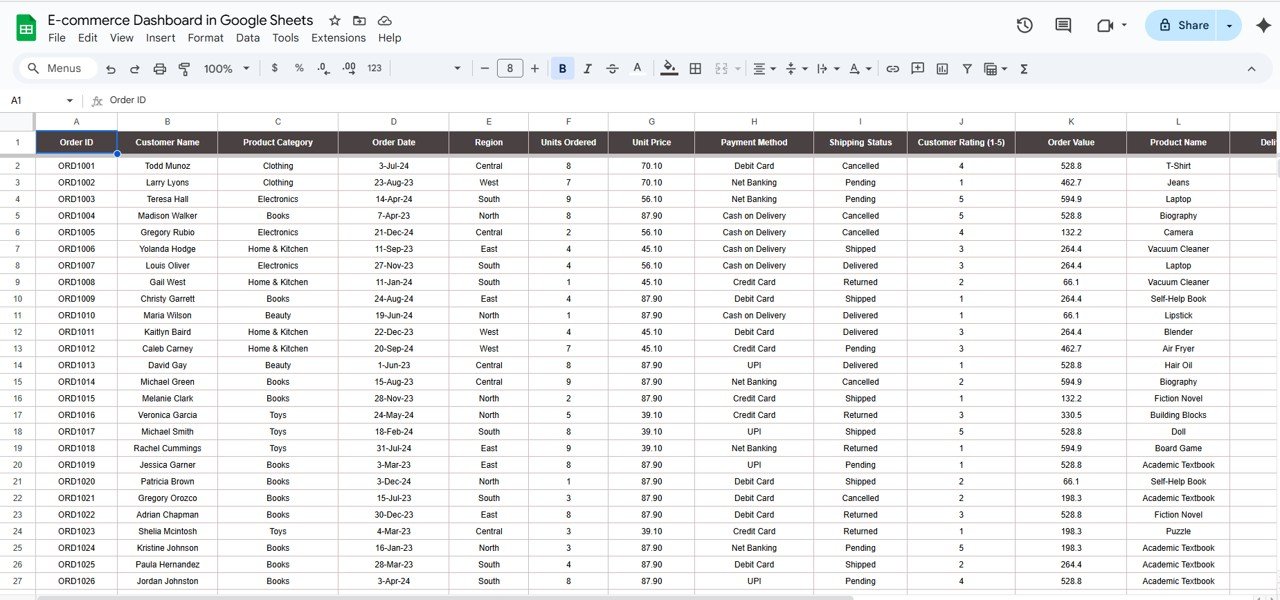
Data Sheet Tab: Raw Data Input
The Data Sheet Tab is where all the raw order data is inputted. Key fields in this sheet include:
This sheet is the central data entry point where you input all the relevant order information, which is then automatically reflected in the dashboard for analysis.
Benefits of Using the E-commerce Dashboard in Google Sheets
The E-commerce Dashboard in Google Sheets offers several key benefits for businesses:
- Centralized Data Management: All data is stored in one place, making it easy to track and manage e-commerce performance.
- Customizable: The dashboard is highly customizable, allowing you to modify it to fit your business’s specific needs.
- Real-Time Insights: The dashboard updates automatically as you enter new data, providing you with real-time insights into your business performance.
- Data Visualization: With built-in charts and cards, the dashboard provides a visual representation of key metrics, helping you make data-driven decisions.
- Easy Sharing: Since the dashboard is in Google Sheets, it is easy to share with team members or stakeholders for collaboration.
Best Practices for Using the E-commerce Dashboard
Click to buy E-commerce Dashboard in Google Sheets
To maximize the effectiveness of the E-commerce Dashboard, consider these best practices:
- Update Data Regularly: Ensure that your data is updated regularly to keep the dashboard current and relevant.
- Use the Search Function: Use the Search Sheet Tab to quickly filter and analyze data by different criteria, such as payment method, order status, or region.
- Monitor Key Metrics: Focus on key metrics such as Total Revenue, Avg. Order Value, Profit Margin, and Customer Rating to assess your business’s performance.
- Visualize Trends: Regularly analyze trends using the Monthly Trend charts to spot growth opportunities and areas for improvement.
- Customize for Specific Needs: Customize the dashboard to meet your business’s unique needs, such as adding new fields or modifying the layout.
Conclusion
The E-commerce Dashboard in Google Sheets is an invaluable tool for online retailers and e-commerce businesses. It allows you to monitor key metrics, track trends, and make data-driven decisions to optimize sales, improve customer satisfaction, and enhance operational efficiency. With its user-friendly design and powerful features, this dashboard helps you streamline your e-commerce business and keep track of vital performance indicators.
Frequently Asked Questions (FAQs)
Click to buy E-commerce Dashboard in Google Sheets
1. How do I update the dashboard with new order data?
Simply enter the new order information in the Data Sheet Tab. The dashboard and charts will automatically update to reflect the new data.
2. Can I customize the dashboard to include additional metrics?
Yes, the dashboard is highly customizable. You can add new fields or modify existing ones to meet your specific needs.
3. How do I filter the data by region or payment method?
Use the Search Sheet Tab to filter data based on various criteria, such as region, payment method, or order status.
4. Can I track customer satisfaction with this dashboard?
Yes, the Avg. Customer Rating metric allows you to monitor customer satisfaction by tracking ratings given by customers.
5. Is this dashboard suitable for businesses with multiple product categories?
Yes, the dashboard supports multiple product categories and allows you to track performance by category, region, and other parameters.
Visit our YouTube channel to learn step-by-step video tutorials
Youtube.com/@NeotechNavigators
Click to buy E-commerce Dashboard in Google Sheets
Watch the step-by-step video tutorial:
