
Freight management is essential for businesses that deal with the transportation of goods. Efficiently managing freight operations requires monitoring various key performance indicators (KPIs) that reflect the speed, cost, and overall effectiveness of the process. The Freight Management KPI Dashboard in Google Sheets is a ready-to-use tool that helps logistics and transportation managers track critical KPIs related to freight operations.
In this article, we will explain the Freight Management KPI Dashboard in Google Sheets, its features, and how it can help you optimize your freight operations by tracking performance metrics like shipping costs, delivery times, and overall efficiency.
What is the Freight Management KPI Dashboard in Google Sheets?
The Freight Management KPI Dashboard in Google Sheets is a powerful template that provides a comprehensive overview of your freight management operations. It tracks essential KPIs such as cost per shipment, delivery times, on-time performance, and more. By using this dashboard, you can quickly assess the performance of your freight operations, identify areas for improvement, and make data-driven decisions to optimize your logistics processes.
The dashboard consists of six worksheets, each focused on a different aspect of freight management. These sheets provide detailed insights into various KPIs, allowing you to track, compare, and analyze your freight performance in real-time.
Key Features of the Freight Management KPI Dashboard in Google Sheets
This dashboard contains six main worksheets, each designed to provide insights into different aspects of freight operations:
1. Dashboard Sheet Tab
The Dashboard Sheet is the main page of the template, providing an overview of all KPIs. Key features include:
MTD (Month-to-Date) and YTD (Year-to-Date) Metrics:
- MTD Actual: Displays the actual data for the current month.
- MTD Target: Shows the target data for the current month.
- PY vs Actual: Compares the current month’s performance with the same period from the previous year (PY).
- YTD Actual: Cumulative actual data for the year.
- YTD Target vs Actual: Comparison of the YTD target with actual performance for the year.
- Conditional Formatting: Visual indicators (up/down arrows) show whether the performance is above or below the target and PY data.


Click to buy Freight Management KPI Dashboard in Google Sheets
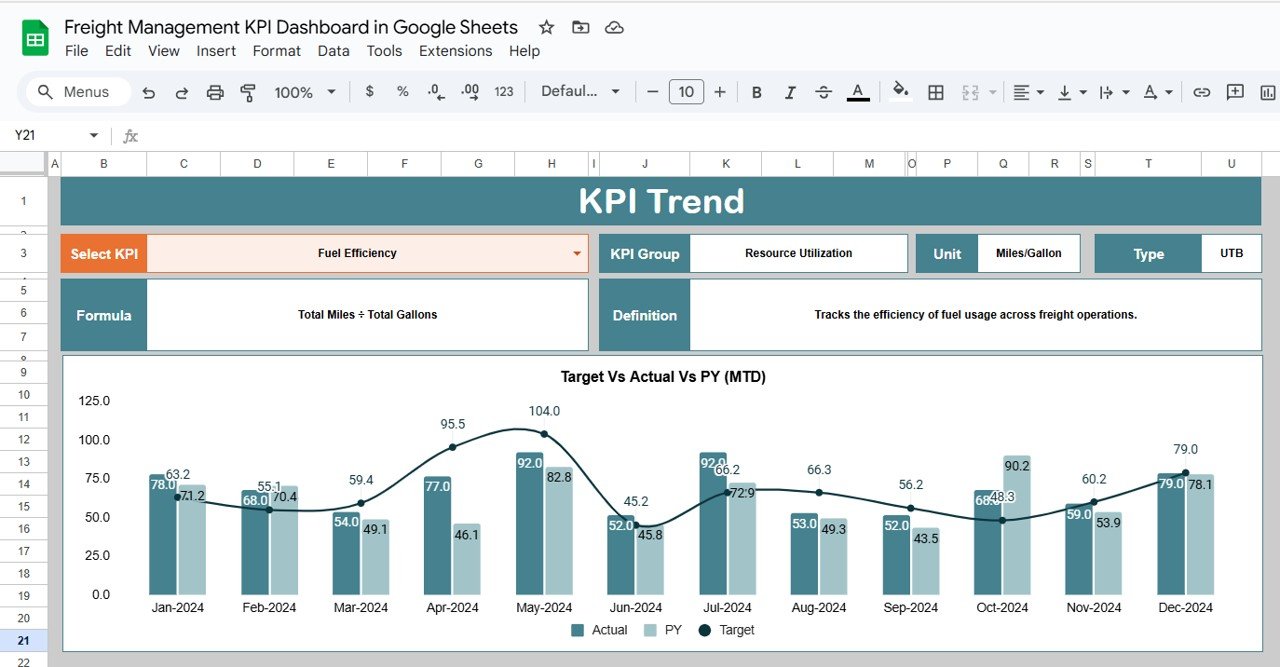
2. KPI Trend Sheet Tab
The KPI Trend Sheet helps track individual KPIs over time. This sheet is useful for identifying trends and monitoring how specific aspects of freight performance evolve.
KPI Selection Dropdown:
Select any KPI from the dropdown in C3, and the sheet will display:
- KPI Group: The category of the KPI (e.g., cost management, delivery performance, shipment tracking).
- Unit of KPI: The unit of measurement for the KPI (e.g., dollars, percentage, time).
- Type of KPI: Whether the KPI is “Lower the Better” or “Upper the Better.”
- Formula of KPI: How each KPI is calculated.
- KPI Definition: An explanation of what each KPI measures and its relevance to freight management.

Click to buy Freight Management KPI Dashboard in Google Sheets
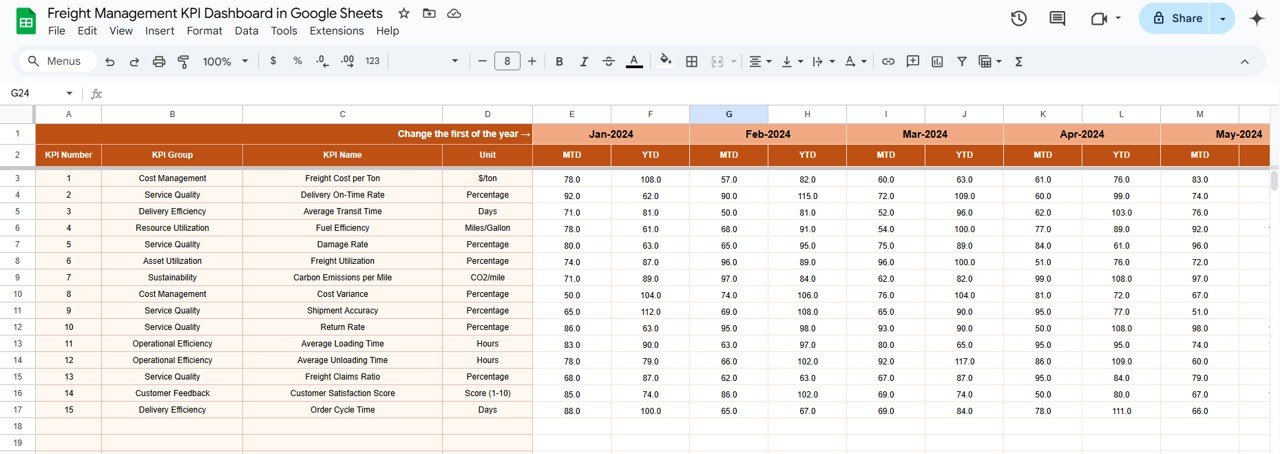
3. Actual Number Sheet Tab
The Actual Number Sheet is where you enter the actual data for MTD and YTD. This data updates the dashboard automatically.
-
Monthly Data Entry:
Enter the actual data for each KPI for the selected month (indicated in E1), and the dashboard will update with the latest performance metrics.

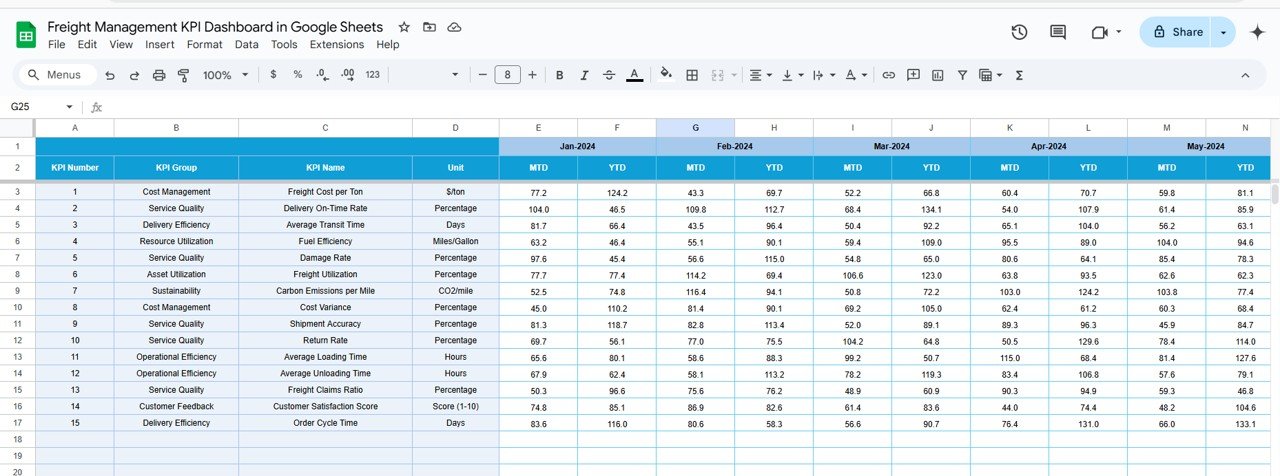
4. Target Sheet Tab
The Target Sheet allows you to set target values for each KPI, both MTD and YTD. These targets are used to assess the performance of your freight operations.
-
Target Data Entry:
Input target values for each KPI, and compare them with actual performance data on the dashboard.

Click to buy Freight Management KPI Dashboard in Google Sheets
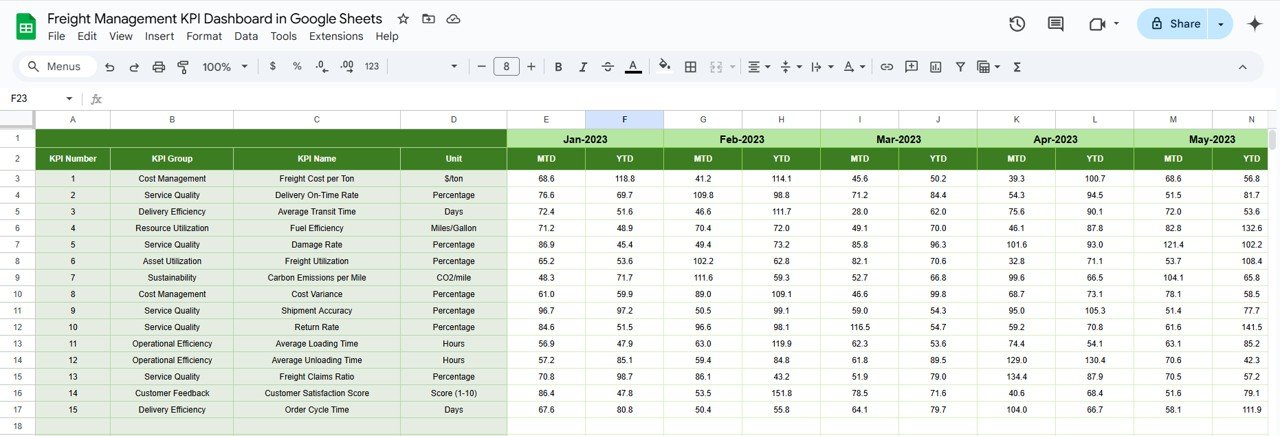
5. Previous Year Number Sheet Tab
The Previous Year Number Sheet stores the data from the previous year, enabling you to compare current performance with historical data.
-
Previous Year Data Entry:
Enter last year’s data for each KPI to compare it with the current year’s performance and evaluate growth or improvements over time.

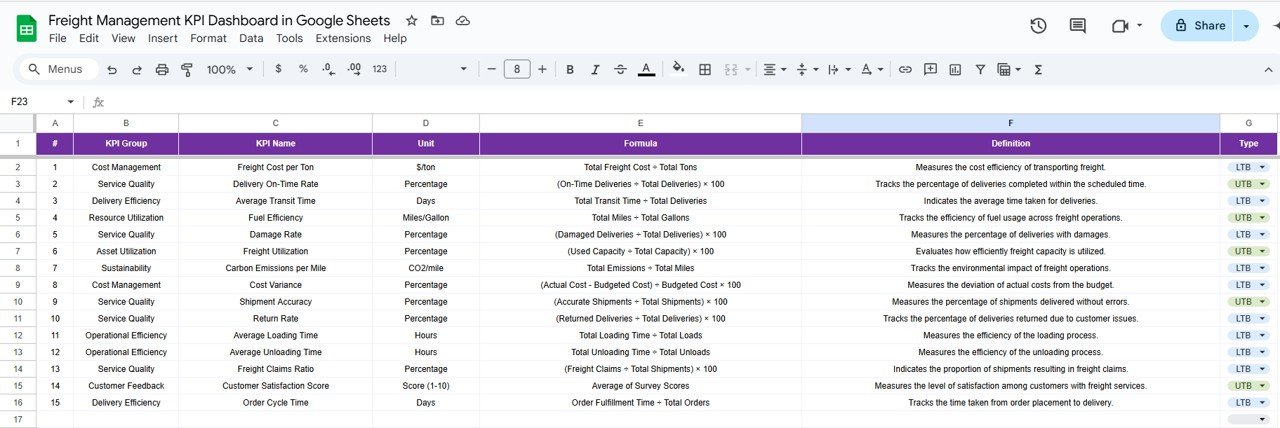
6. KPI Definition Sheet Tab
The KPI Definition Sheet provides detailed definitions for each KPI, ensuring that all stakeholders understand what each metric tracks.
-
KPI Definitions:
Each KPI is defined by its name, group, unit, formula, and description of what it tracks and why it’s important for freight management.

Click to buy Freight Management KPI Dashboard in Google Sheets
Advantages of Using the Freight Management KPI Dashboard
-
Comprehensive Monitoring: Track all essential KPIs related to freight operations in one centralized dashboard, making it easier to manage and optimize logistics processes.
-
Real-Time Insights: The dashboard automatically updates as you enter new data, providing you with up-to-date performance metrics that inform decision-making.
-
Customizable for Your Needs: The template can be customized to suit your specific needs. Add new KPIs, adjust formulas, and modify charts to match your business requirements.
-
Visual Data Representation: With clear charts, graphs, and conditional formatting, the dashboard makes it easy to visualize performance trends and identify areas for improvement.
-
Data-Driven Decisions: By tracking key performance metrics such as cost per shipment, on-time delivery rates, and customer satisfaction, the dashboard helps you make informed decisions to improve operational efficiency.
Best Practices for Using the Freight Management KPI Dashboard
-
Update Data Regularly: Ensure that the data is updated regularly to keep the dashboard accurate and reflective of current performance.
-
Focus on Key Metrics: Regularly monitor critical KPIs such as On-Time Delivery Rate, Cost per Shipment, and Freight Utilization Rate to ensure your logistics operations are running efficiently.
-
Analyze Trends and Make Adjustments: Use the KPI Trend Sheet to analyze long-term trends in your freight operations and make adjustments to improve efficiency or resolve issues.
-
Leverage Insights for Strategic Decisions: Use the dashboard’s insights to make strategic decisions about transportation routes, pricing, and customer service improvements.
Frequently Asked Questions (FAQs)
Click to buy Freight Management KPI Dashboard in Google Sheets
1. How do I update the Freight Management KPI Dashboard?
Simply enter the actual data for each KPI in the Actual Number Sheet, and the dashboard will automatically update with the latest performance metrics.
2. Can I track multiple freight operations in this dashboard?
Yes, the dashboard can be customized to track multiple freight operations or regions by adding new columns or sections.
3. How do I compare year-over-year performance?
Enter last year’s data in the Previous Year Number Sheet to make year-over-year comparisons and assess how your freight operations have improved over time.
Conclusion
The Freight Management KPI Dashboard in Google Sheets is an essential tool for tracking and optimizing freight operations. With real-time updates, customizable KPIs, and clear visual insights, this dashboard helps logistics managers monitor key metrics and make informed decisions to improve operational efficiency. Whether you’re managing a small-scale shipping operation or a large global logistics network, this dashboard will help you optimize your freight processes and achieve better results.
Visit our YouTube channel to learn step-by-step video tutorials
Youtube.com/@NeotechNavigators
Watch the step-by-step video Demo:

Click to buy Freight Management KPI Dashboard in Google Sheets