In the healthcare industry, managing patient data, monitoring revenue, and measuring satisfaction are essential tasks that require effective tools. The Healthcare Dashboard in Google Sheets is a powerful, ready-to-use template designed to streamline the process of tracking and visualizing key healthcare metrics. This dashboard helps healthcare providers monitor critical data, gain insights, and make informed decisions to improve their operations and patient care.
In this article, we’ll walk through the features and benefits of the Healthcare Dashboard in Google Sheets, explaining how it tracks patient data, revenue, satisfaction scores, and more.
What is the Healthcare Dashboard in Google Sheets?
The Healthcare Dashboard in Google Sheets is a customizable template that helps healthcare providers and administrators track vital metrics related to patient visits, sales, treatments, and satisfaction. The dashboard is designed to visualize data in real time, making it easy to monitor and analyze the performance of your healthcare organization.
The dashboard integrates multiple charts, cards, and filters, giving you a complete view of your key performance indicators (KPIs) and allowing for better decision-making.
Key Features of the Healthcare Dashboard
Click to buy Healthcare Dashboard in Google Sheets
The Healthcare Dashboard in Google Sheets consists of several key components, including cards, charts, and data sheets. Let’s break down each feature:
1. Dashboard Sheet Tab
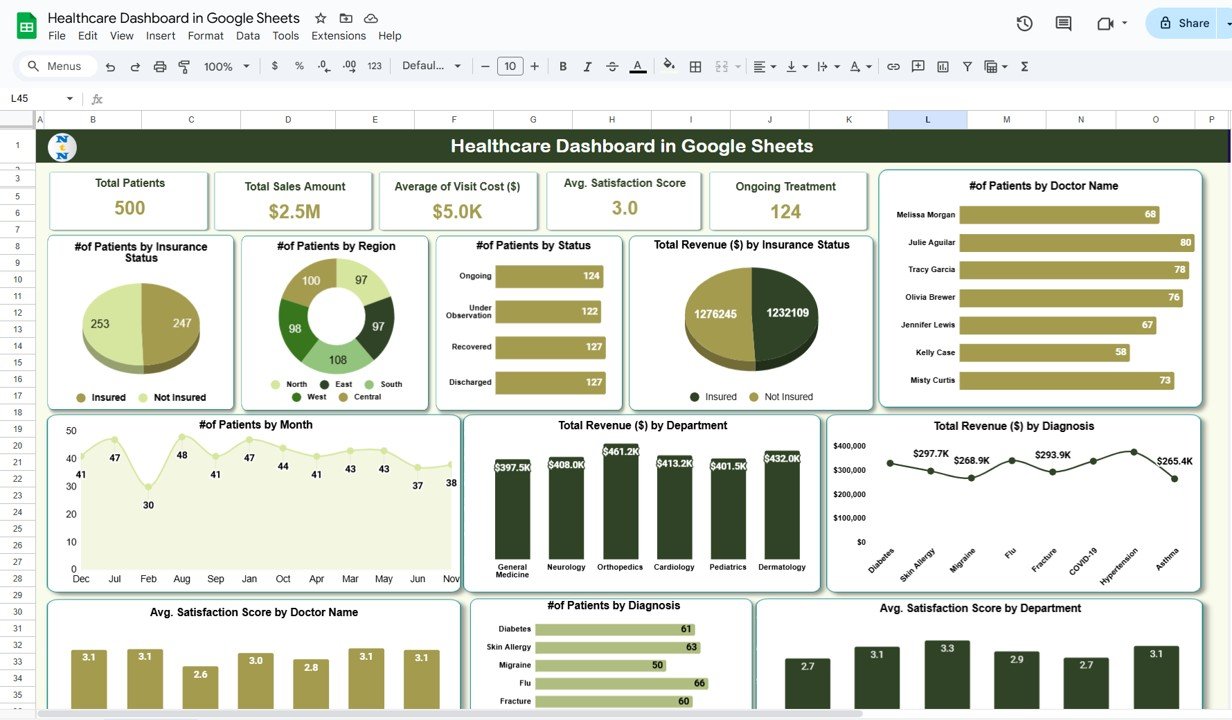
The Dashboard Sheet serves as the main hub where all the key healthcare metrics are displayed. It is divided into cards and charts for easy data visualization.
Cards:
The cards provide a quick overview of the most important metrics. They include:
-
Total Patients: Displays the total number of patients in the system.
-
Total Sales Amount: Shows the total sales amount for the specified period.
-
Average Visit Cost ($): Provides the average cost per visit.
-
Avg. Satisfaction Score: Displays the average satisfaction score provided by patients.
-
Ongoing Treatment: Shows the number of patients currently undergoing treatment.
Charts:
The charts provide visual representations of the data, making it easier to track performance trends. The charts include:
-
# of Patients by Doctor Name: Visualizes the number of patients assigned to each doctor.
-
# of Patients by Insurance Status: Displays the number of patients based on their insurance status (e.g., insured, uninsured).
-
# of Patients by Region: Shows the number of patients by geographic region.
-
# of Patients by Status: Visualizes the number of patients categorized by their current status (e.g., active, discharged).
-
Total Revenue ($) by Insurance Status: Displays the total revenue generated from patients based on their insurance status.
-
# of Patients by Month: Tracks the number of patients per month.
-
Total Revenue ($) by Department: Visualizes revenue broken down by different departments (e.g., cardiology, dermatology).
-
Total Revenue ($) by Diagnosis: Shows revenue based on patient diagnoses.
-
Avg. Satisfaction Score by Doctor Name: Displays the average patient satisfaction score for each doctor.
-
# of Patients by Diagnosis: Visualizes the number of patients based on their medical diagnoses.
-
Avg. Satisfaction Score by Department: Shows the average satisfaction score by department.

Click to buy Healthcare Dashboard in Google Sheets
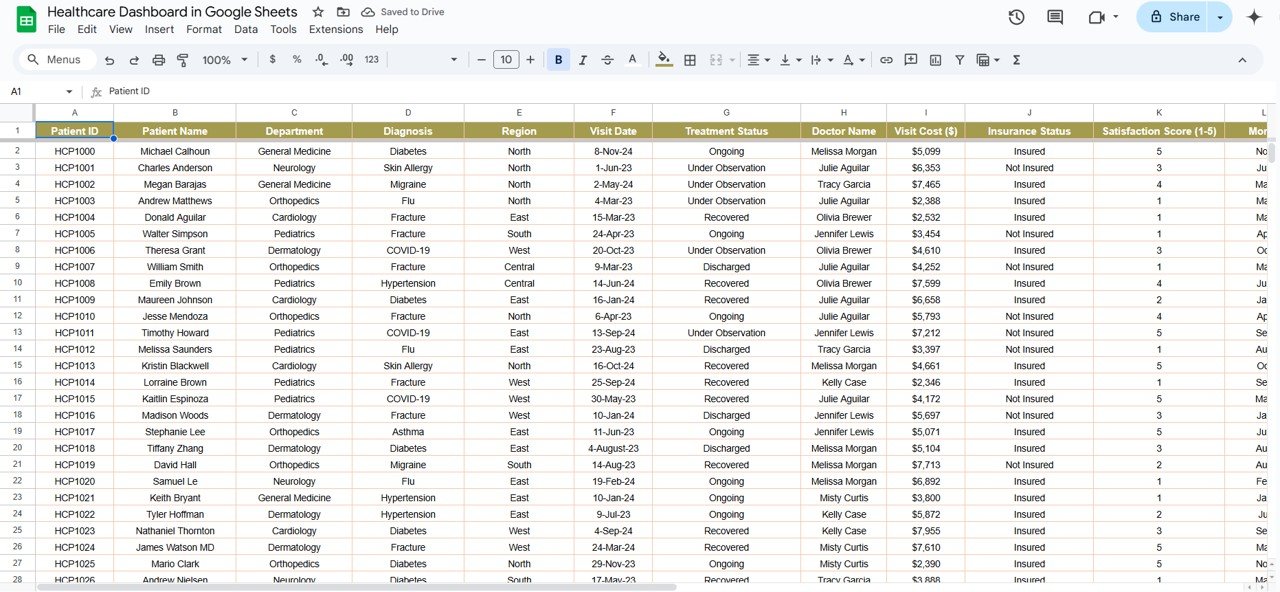
2. Data Sheet Tab
The Data Sheet Tab is where you input and manage all of the raw data that feeds into the dashboard. This data includes patient information, sales data, satisfaction scores, and more. The data sheet serves as the backbone of the dashboard, ensuring accurate reporting and visualization.

Click to buy Healthcare Dashboard in Google Sheets
Benefits of Using the Healthcare Dashboard
The Healthcare Dashboard in Google Sheets offers several key benefits for healthcare providers:
-
Centralized Data Management: All critical patient and revenue data is stored in one location, making it easy to track and manage.
-
Real-Time Insights: By updating the data sheet regularly, the dashboard provides real-time insights into your healthcare organization’s performance.
-
Visual Representation: The use of charts and graphs makes it easy to visualize trends and identify areas of improvement.
-
Customization: You can easily customize the dashboard to meet the unique needs of your healthcare organization, adding or removing KPIs as necessary.
-
Improved Decision-Making: The dashboard provides healthcare providers with the insights they need to make data-driven decisions, improving patient care and operational efficiency.
Advantages of Using the Healthcare Dashboard
Click to buy Healthcare Dashboard in Google Sheets
-
Real-Time Monitoring: Track key metrics in real time, ensuring that you can act quickly when issues arise.
-
Easy Customization: Tailor the dashboard to your specific healthcare needs by adding or removing KPIs.
-
Increased Efficiency: The dashboard simplifies the process of tracking and managing large amounts of data, reducing time spent on manual reporting.
-
Data-Driven Decisions: With easy-to-read charts and graphs, you can make informed decisions based on actual data.
Best Practices for Using the Healthcare Dashboard
To maximize the effectiveness of the Healthcare Dashboard in Google Sheets, follow these best practices:
-
Update the Data Regularly: Regularly input new data into the Data Sheet Tab to ensure that your dashboard reflects the most current information.
-
Use Slicers for Quick Analysis: Use the slicers in the Dashboard Sheet Tab to filter data by specific criteria, such as doctor, department, or diagnosis.
-
Set Realistic Targets: Ensure that your KPIs reflect realistic goals for your healthcare organization. This will help you measure performance accurately.
-
Share Insights with Your Team: Use the dashboard to communicate key insights with your team, helping them focus on areas that need attention.
Conclusion
Click to buy Healthcare Dashboard in Google Sheets
The Healthcare Dashboard in Google Sheets is a valuable tool for healthcare providers, helping them track key metrics such as patient volume, revenue, and satisfaction scores. With its easy-to-use interface, real-time insights, and customizable features, this dashboard provides healthcare organizations with the tools they need to optimize their operations, improve patient care, and make informed decisions.
Frequently Asked Questions (FAQs)
1. What KPIs are tracked in the Healthcare Dashboard?
The dashboard tracks KPIs such as total patients, revenue by insurance status, satisfaction scores, and patients by diagnosis.
2. How do I customize the Healthcare Dashboard?
You can customize the dashboard by adding or removing KPIs, adjusting formulas, or modifying the charts to fit your healthcare needs.
3. How often should I update the data in the dashboard?
It’s recommended to update the data regularly, especially after patient visits or changes in revenue, to ensure accurate tracking.
4. Can I use the Healthcare Dashboard for multiple healthcare facilities?
Yes, the dashboard can be duplicated and customized for multiple facilities, allowing you to track performance across different locations.
Visit our YouTube channel to learn step-by-step video tutorials
Youtube.com/@NeotechNavigators
Click to buy Healthcare Dashboard in Google Sheets
Watch the step-by-step video tutorial: