
In the ever-evolving healthcare insurance industry, tracking key performance indicators (KPIs) is essential for assessing the effectiveness of services, improving customer satisfaction, and managing financial health. The Healthcare Insurance KPI Dashboard in Google Sheets provides a ready-to-use solution for managing and visualizing key metrics related to healthcare insurance performance. This article will walk you through the key features of the dashboard, explain the various KPIs tracked, and guide you on how to make the most of this powerful tool.
What is a Healthcare Insurance KPI Dashboard?
A Healthcare Insurance KPI Dashboard is a visual tool designed to track and analyze key performance metrics related to healthcare insurance. These KPIs help insurance companies and providers evaluate service performance, customer satisfaction, claims efficiency, and financial health. With the Google Sheets dashboard, you can easily track these metrics in real time, compare actual performance to targets, and make data-driven decisions to improve operations and service quality.
The Google Sheets template offers a simple, yet effective way to monitor various KPIs, such as claims processing time, customer satisfaction, policy renewal rates, and more. By providing real-time data visualization and trend analysis, the dashboard makes it easier for decision-makers to stay informed and act swiftly.
Key Features of the Healthcare Insurance KPI Dashboard in Google Sheets
The Healthcare Insurance KPI Dashboard consists of six main worksheets, each serving a specific function to help you monitor and track your KPIs:
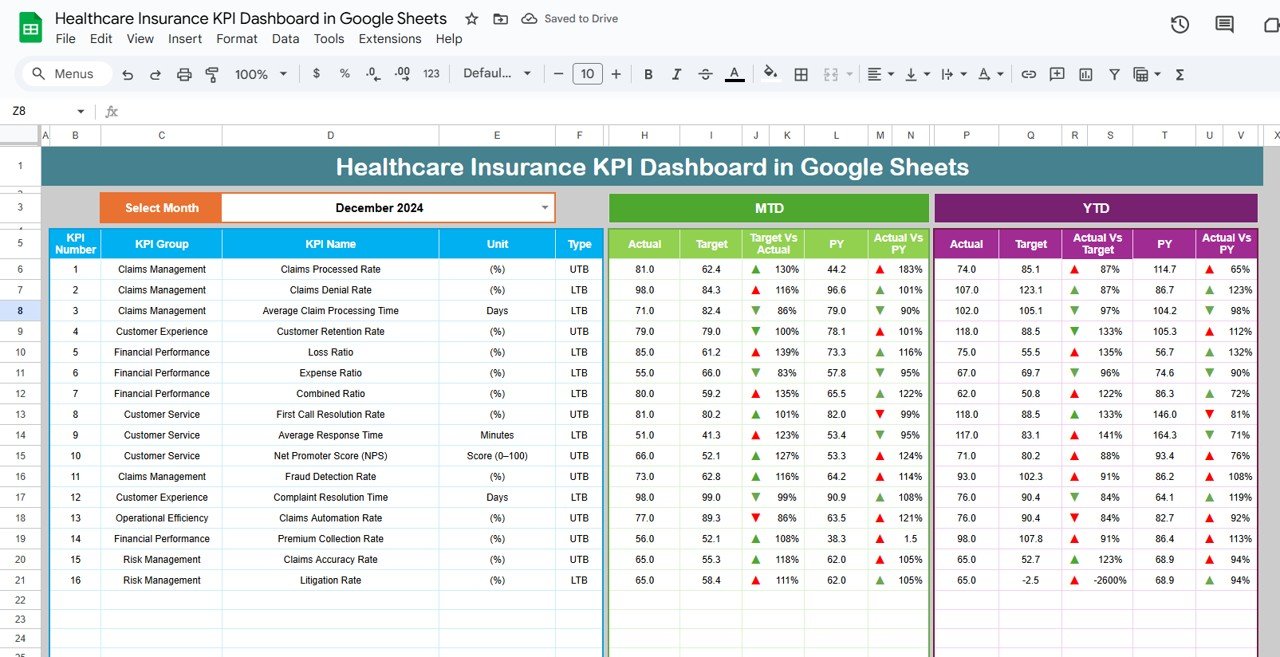
1. Dashboard Sheet Tab
The Dashboard Sheet serves as the central hub for all your KPIs and data visualizations. It includes the following key features:
Month Selection (D3): Use the dropdown to select the month, and the entire dashboard will update with the relevant data for that month.
Key Metrics:
- MTD (Month-to-Date) Actual, Target, Previous Year Data: Compare the actual performance for the current month against the target and last year’s performance.
- YTD (Year-to-Date) Actual, Target, Previous Year Data: Track the performance year-to-date and compare it with your target and previous year’s data.
Conditional Formatting: Up and down arrows show whether the actual values meet the targets for both MTD and YTD metrics.

Click to buy Healthcare Insurance KPI Dashboard in Google Sheets
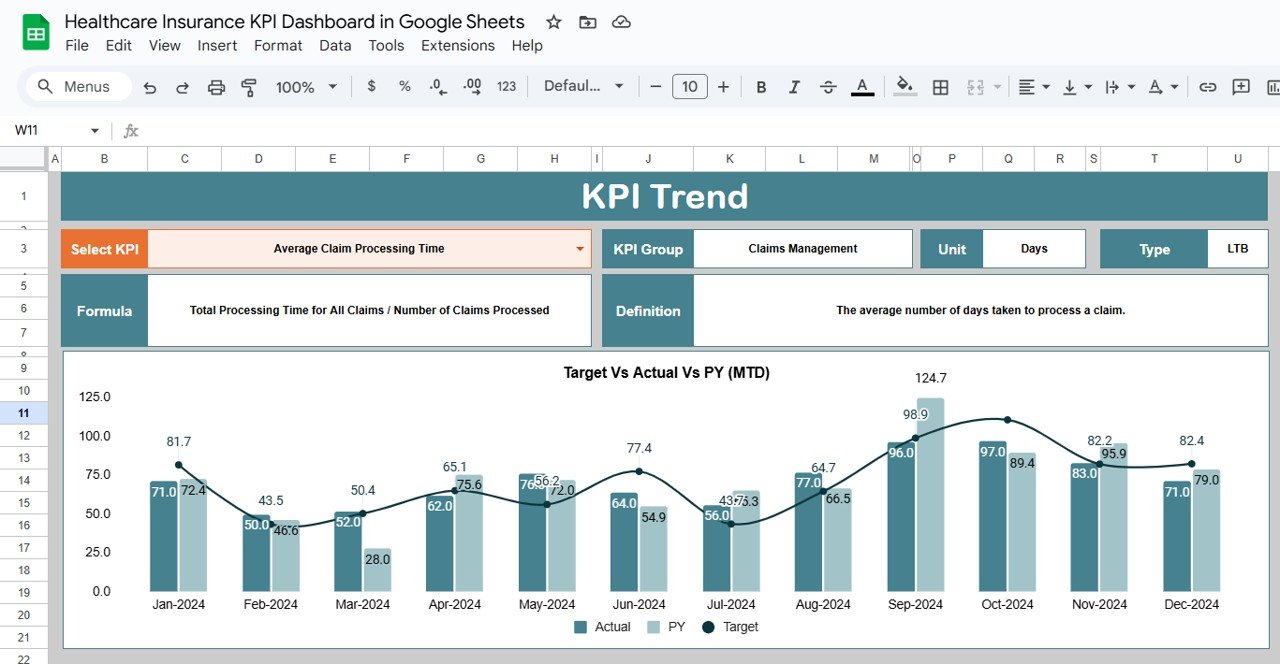
2. KPI Trend Sheet Tab
The KPI Trend Sheet helps you visualize how each KPI is performing over time:
-
KPI Selection Dropdown (C3): Select a specific KPI from the dropdown to view its historical data trends for the selected time period.
-
KPI Group, Unit, and Type: Displays the group (e.g., claims processing, policy management), unit of measurement, and whether the KPI is “Lower the Better” (LTB) or “Upper the Better” (UTB).
-
Formula and Definition: Displays the formula used to calculate the KPI, along with a detailed definition.

Click to buy Healthcare Insurance KPI Dashboard in Google Sheets
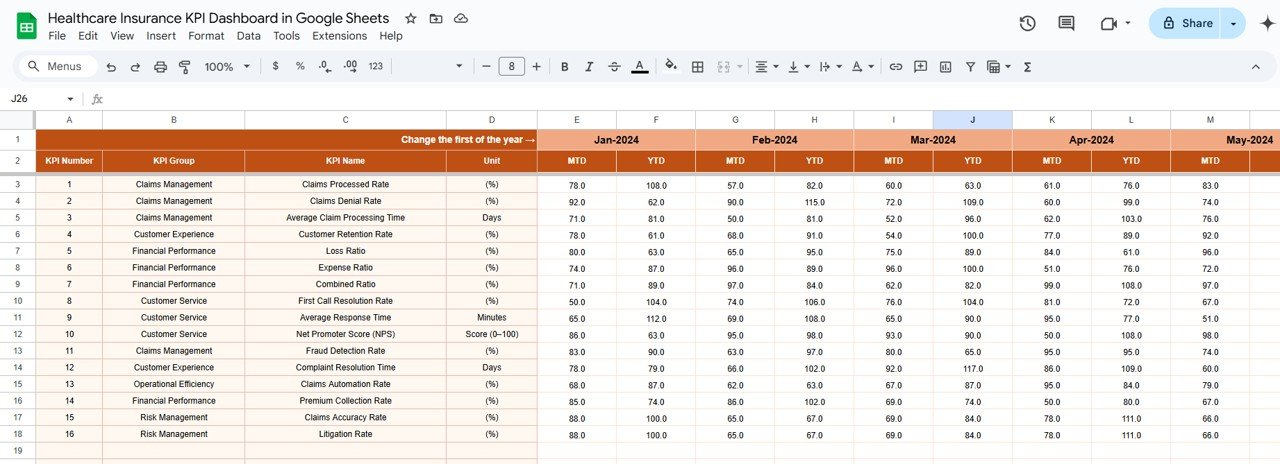
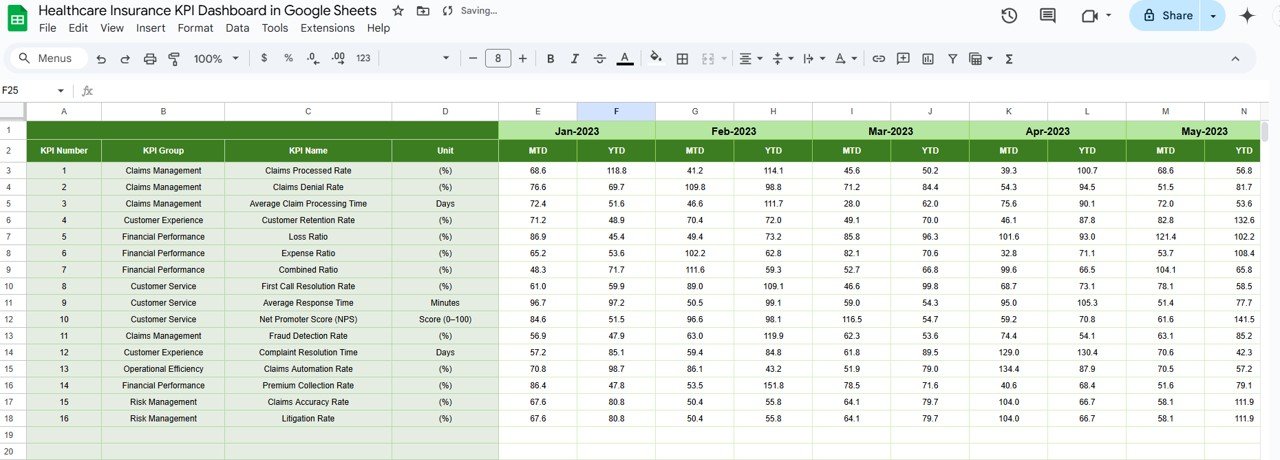
3. Actual Numbers Sheet Tab
The Actual Numbers Sheet is where you input the actual performance data for each KPI:
-
YTD and MTD Input: Enter the actual values for both Month-to-Date and Year-to-Date metrics.
-
Dynamic Month Selection (E1): Select the first month of the year, and the data will automatically update to reflect performance for that period.

Click to buy Healthcare Insurance KPI Dashboard in Google Sheets
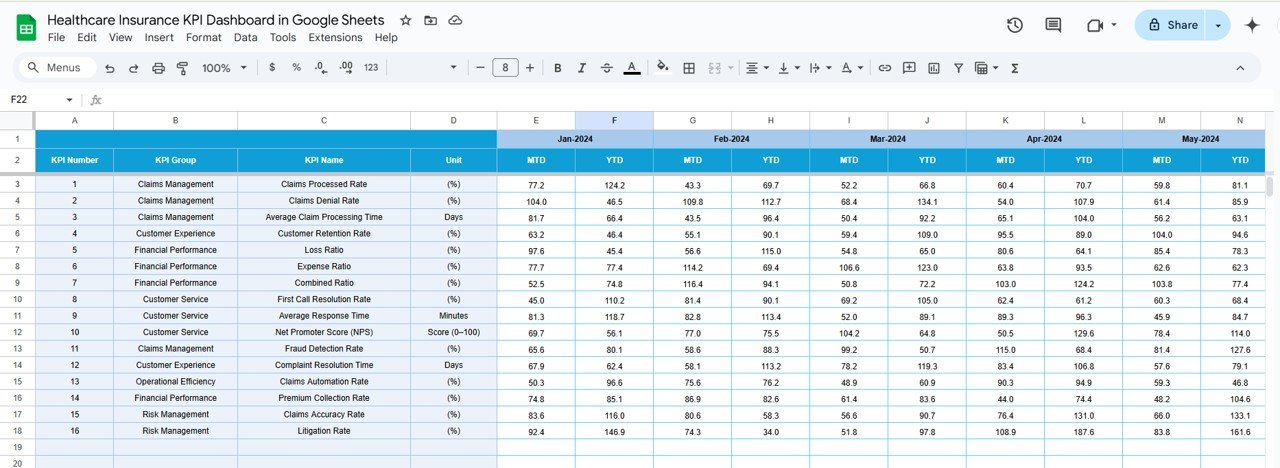
4. Target Sheet Tab
The Target Sheet allows you to input the target values for each KPI:
-
Monthly and YTD Targets: Enter the target numbers for each KPI for both the MTD and YTD performance.
-
Data Entry: This sheet allows you to set and adjust performance targets for various KPIs throughout the year.

Click to buy Healthcare Insurance KPI Dashboard in Google Sheets
5. Previous Year Number Sheet Tab
This sheet enables you to input data from the previous year for comparison:
-
Historical Comparison: Enter the previous year’s data to compare current performance with historical trends for better decision-making.

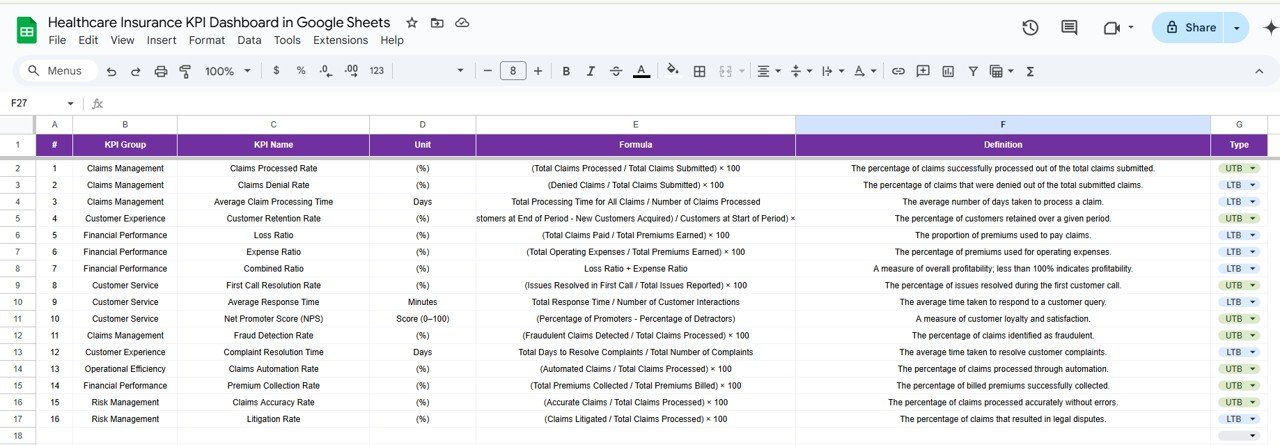
6. KPI Definition Sheet Tab
The KPI Definition Sheet is where you can define and clarify each KPI:
-
KPI Name, Group, Unit: Define the KPI’s name, group, and unit of measurement.
-
Formula and Definition: Include the formula used for calculation and a detailed explanation of what the KPI measures.

Advantages of Using the Healthcare Insurance KPI Dashboard
Click to buy Healthcare Insurance KPI Dashboard in Google Sheets
The Healthcare Insurance KPI Dashboard offers several significant advantages:
-
Real-Time Tracking: The dashboard allows you to monitor performance data in real time, making it easy to spot trends and respond quickly to changes.
-
Data-Driven Insights: By tracking and comparing KPIs, you can make informed, data-driven decisions to improve customer satisfaction, claims processing, and operational efficiency.
-
Customizable: The dashboard is highly customizable, allowing you to add new KPIs or adjust existing ones based on your business needs.
-
Improved Goal Setting: The dashboard enables you to set clear performance targets for your team and track progress toward achieving those goals.
-
Visual Representation: The use of charts and visual cues (like up and down arrows) helps easily identify performance issues and successes.
Opportunity for Improvement in the Healthcare Insurance KPI Dashboard
While the Healthcare Insurance KPI Dashboard is an excellent tool, there are opportunities to enhance its effectiveness:
-
Automated Data Integration: Automating data imports from external systems (e.g., CRM or claims management platforms) can reduce manual entry and improve data accuracy.
-
Advanced Analytics: Adding predictive analytics to forecast future claims or customer behavior can help insurance companies plan better and make proactive adjustments.
-
Mobile Accessibility: Developing a mobile-friendly version of the dashboard could allow managers to track KPIs on the go, enhancing accessibility and decision-making.
-
More Detailed Reporting: Incorporating more detailed reporting features, such as automated monthly or quarterly reports, could save time and streamline communication across teams.
Best Practices for Using the Healthcare Insurance KPI Dashboard
Click to buy Healthcare Insurance KPI Dashboard in Google Sheets
To maximize the benefits of the Healthcare Insurance KPI Dashboard, consider these best practices:
-
Update Data Regularly: Regularly input actual data for MTD and YTD metrics to ensure the dashboard provides accurate, up-to-date information.
-
Focus on High-Impact KPIs: Prioritize tracking KPIs that have the most significant impact on customer satisfaction and operational performance.
-
Monitor Trends Over Time: Use the KPI Trend Sheet to observe long-term performance trends and identify areas for improvement.
-
Set Realistic Targets: Ensure that your KPIs are aligned with realistic and achievable targets to avoid setting unattainable goals.
-
Collaborate with Your Team: Share the dashboard with your team to ensure everyone is aligned on performance goals and actively working towards them.
Conclusion
The Healthcare Insurance KPI Dashboard in Google Sheets is an invaluable tool for managing and monitoring healthcare insurance services. By tracking key performance indicators like claims processing time, customer satisfaction, and policy renewal rates, you can make informed decisions that improve operational efficiency, enhance customer experience, and optimize business performance. With its customizable features and easy-to-use interface, this dashboard is a must-have tool for any healthcare insurance provider looking to stay organized and improve performance.
Frequently Asked Questions (FAQs)
1. What KPIs are tracked in the Healthcare Insurance KPI Dashboard?
The dashboard tracks KPIs like claims processing time, customer satisfaction, claims approval rate, policy renewal rate, and more.
2. How do I customize the Healthcare Insurance KPI Dashboard?
The dashboard is fully customizable. You can add new KPIs, modify formulas, and adjust the layout to fit your specific needs.
3. How is data entered into the Healthcare Insurance KPI Dashboard?
Data is entered through the Actual Numbers Sheet, with target data inputted in the Target Sheet and previous year data in the Previous Year Sheet.
4. Can the Healthcare Insurance KPI Dashboard be automated?
Yes, you can integrate the dashboard with other systems like CRM or claims management platforms to automate data entry and updates.
5. How often should I update the data in the Healthcare Insurance KPI Dashboard?
It’s recommended to update the dashboard regularly (e.g., weekly or monthly) to ensure it reflects accurate, real-time performance data.
Visit our YouTube channel to learn step-by-step video tutorials
Youtube.com/@NeotechNavigators
Watch the step-by-step video Demo:

Click to buy Healthcare Insurance KPI Dashboard in Google Sheets