In today’s fast-paced data-driven world, businesses need efficient tools to analyze and visualize information quickly. Google Sheets is one such tool that offers both flexibility and functionality when it comes to data management and visualization. One of its powerful features is the ability to create dynamic dashboards, which help decision-makers track performance, trends, and other critical metrics in real-time.
This article will walk you through the steps on how to create dynamic dashboards in Google Sheets using formulas. We will also explore how formulas can be used to update data automatically, making the dashboard more interactive and useful. Whether you’re new to Google Sheets or already familiar with it, this guide will help you leverage its full potential to build powerful, data-driven dashboards.
What is a Dynamic Dashboard in Google Sheets?
A dynamic dashboard in Google Sheets is an interactive, real-time representation of your data that automatically updates as your underlying data changes. Unlike static dashboards, which require manual adjustments, dynamic dashboards use formulas, functions, and charts to adjust to new data. These dashboards can display a variety of information, such as sales performance, inventory levels, website traffic, and more, providing you with visual insights into key metrics.
Key characteristics of dynamic dashboards include:
- Real-time updates: Dashboards automatically reflect the latest data changes.
- Interactivity: Users can filter, sort, and view data from different angles.
- Automation: Formulas reduce manual data entry and update errors.
How to Set Up Your Data for a Dynamic Dashboard
Before diving into formulas and visual elements, it’s essential to organize your data correctly. Proper data setup is the foundation of any dynamic dashboard.
Step 1: Organize Data in Google Sheets
For a dashboard to function dynamically, your data needs to be structured in a logical manner. You can start by organizing your data in tables with clear headings. Here’s how to organize the data for a sales dashboard as an example:
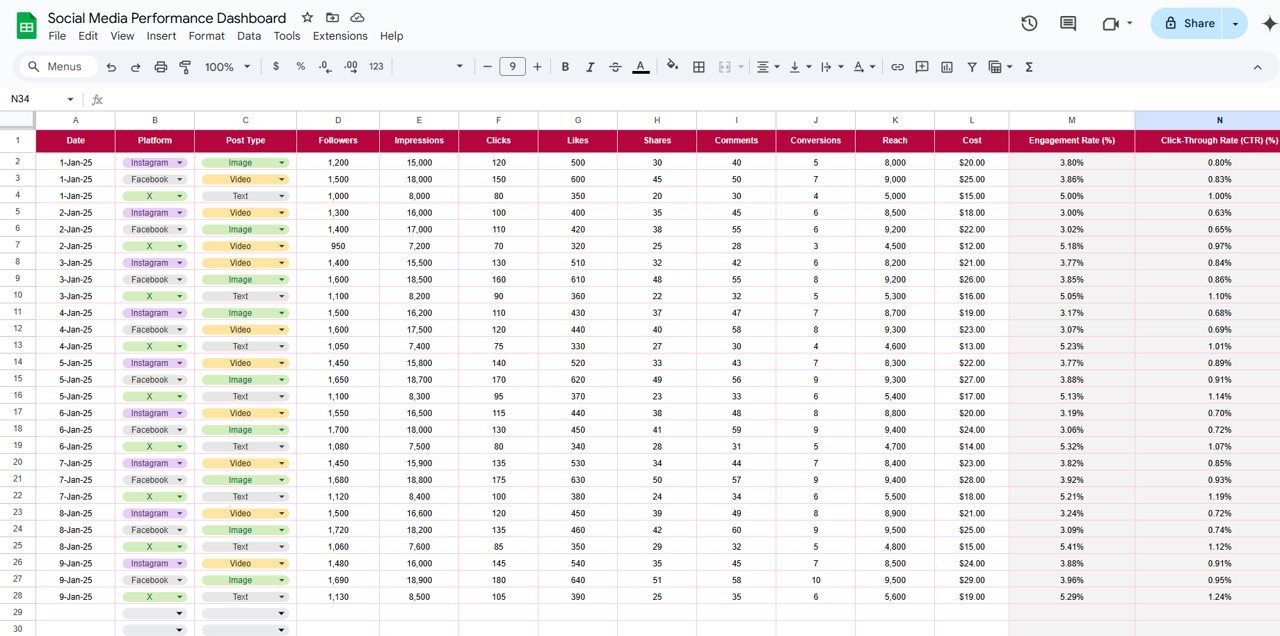
Organizing data in this way makes it easier to apply formulas, create charts, and visualize your data.
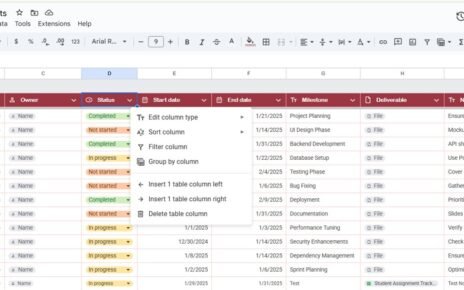
Step 2: Create Data Validation for Interactive Filtering
One of the main features of a dynamic dashboard is interactivity. You can make your dashboard more interactive by adding data validation drop-down menus. This allows users to filter data based on certain parameters such as date, salesperson, region, etc.
- Select the cell where you want the drop-down list.
- Click on Data > Data Validation > List of items and enter the values separated by commas.
- Now, the user can select a specific value from the drop-down, and your formulas and charts will update accordingly.
Using Formulas to Power Your Dynamic Dashboard
Formulas are at the heart of any dynamic dashboard in Google Sheets. They allow you to automate the calculation of metrics, update data automatically, and ensure that your dashboard reflects the most recent information.
Step 3: SUMIF and COUNTIF Functions for Conditional Summing and Counting
SUMIF and COUNTIF are two essential formulas for dynamic dashboards. They allow you to perform calculations based on conditions (e.g., sum sales for a specific region or count the number of sales above a certain value).
For example, to calculate the total sales for a specific region, you can use the SUMIF function:
This formula sums all the sales in column C where the corresponding region in column D is “North”.
Similarly, to count the number of sales above $500, use the COUNTIF formula:These formulas update dynamically as new data is added or as the filter changes.
Step 4: Use QUERY to Filter and Aggregate Data
The QUERY function is another powerful tool for creating dynamic dashboards in Google Sheets. It allows you to filter, aggregate, and sort data based on multiple criteria. You can use QUERY to pull specific data into your dashboard dynamically.
For example, to get the total sales for each region, you can use the following formula: This formula groups your data by region (column D) and calculates the total sales for each region (summing column C). As new data is entered, the QUERY function will automatically update the dashboard to reflect the changes.
Step 5: Create Dynamic Charts with Google Sheets
Charts are a critical element of any dashboard, helping to visualize trends and compare data quickly. Google Sheets makes it easy to create dynamic charts based on formulas.
To create a dynamic chart:
- Highlight the data range you want to include in the chart.
- Go to Insert > Chart.
- In the Chart Editor, under the Data Range, select the range that contains your data.
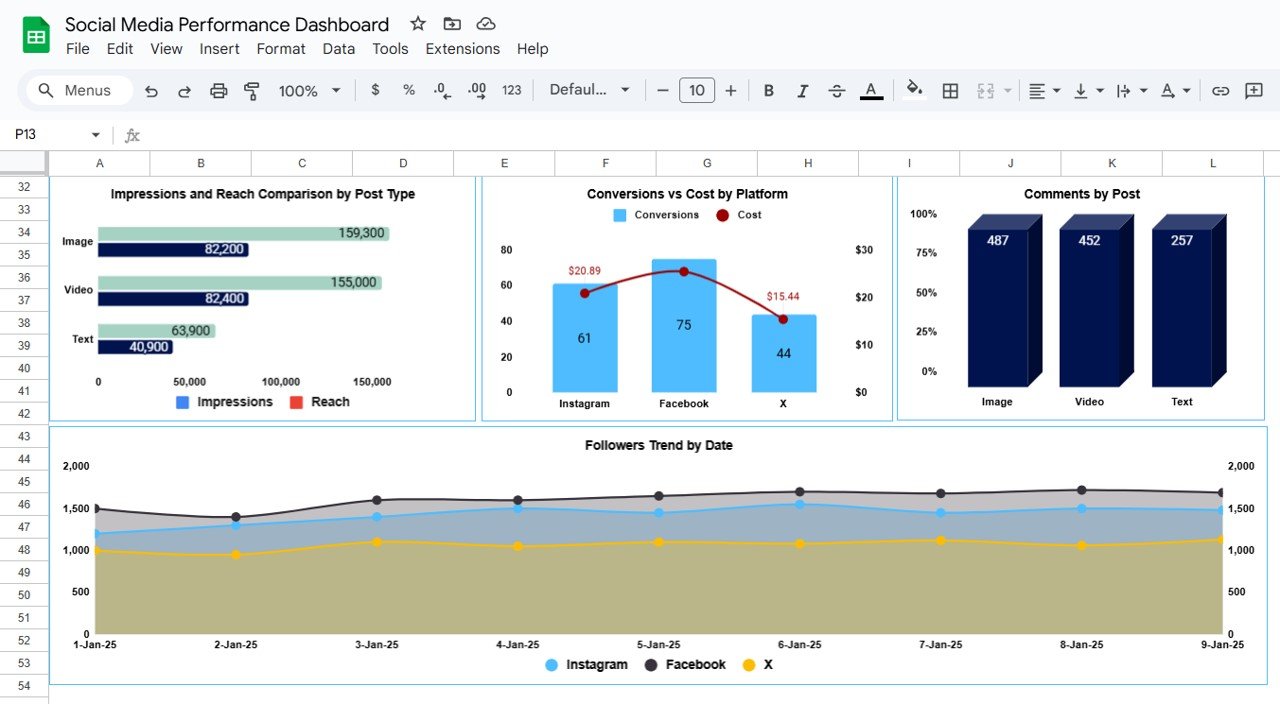
To ensure your chart is dynamic, it should be linked to formulas and references that automatically update as the data changes. For example, if you use SUMIF or QUERY functions to aggregate your data, your chart will update automatically based on those calculations.
Best Practices for Creating Dynamic Dashboards in Google Sheets
To ensure your dynamic dashboard is effective and easy to use, follow these best practices:
- Keep It Simple and Focused: While Google Sheets offers a lot of functionality, it’s important to focus on the KPIs that matter most. Avoid overloading the dashboard with too much information. Keep the design clean and focused on key metrics.
- Use Slicers and Filters: Adding slicers and filters helps users drill down into specific subsets of data without cluttering the dashboard. Make sure to incorporate data validation to allow for easy filtering.
- Update Data Regularly: Make sure the data feeding into the dashboard is up-to-date. Set a routine for updating the data to ensure the dashboard always provides accurate, real-time insights.
- Use Clear Labels and Descriptions: Label each metric and chart clearly. Adding descriptions to the dashboard will help users understand the data and make better decisions.
- Optimize for Mobile Viewing: If your dashboard will be viewed on mobile devices, make sure to design it to fit smaller screens. Use responsive layouts and make sure the charts and text are legible.
Conclusion
Creating a dynamic dashboard in Google Sheets with formulas can greatly improve your data management and decision-making processes. By leveraging powerful formulas like SUMIF, QUERY, and VLOOKUP, you can build a comprehensive, interactive dashboard that automatically updates as new data is added. Whether you’re tracking sales, performance, or other key metrics, a well-designed dynamic dashboard will help you make data-driven decisions that can drive your business forward.
Visit our YouTube channel to learn step-by-step video tutorials
Youtube.com/@NeotechNavigators
Click here to download this File