
Infrastructure management involves monitoring key performance indicators (KPIs) to ensure the smooth operation of systems and assets. The Infrastructure KPI Dashboard in Google Sheets provides a comprehensive and ready-to-use solution for tracking critical metrics related to infrastructure performance.
In this article, we will explore the Infrastructure KPI Dashboard in Google Sheets, a powerful tool designed to help infrastructure teams monitor KPIs, track progress, and improve decision-making. This guide will provide an overview of the dashboard’s features, the KPIs it tracks, and how it can help improve infrastructure management.
Key Features of the Infrastructure KPI Dashboard in Google Sheets
Below are the key features of this KPI dashboard template:
1. Dashboard Sheet Tab
This is the main sheet where all KPI data is displayed.
-
Month Selection: In Range D3, select the month from the drop-down menu, and the dashboard will update to show data for that month.
-
MTD (Month-to-Date): Displays actual numbers, target values, and comparisons with previous year data using conditional formatting (up or down arrows).
-
YTD (Year-to-Date): Shows cumulative performance with comparisons to target and previous year data.


Click to buy Infrastructure KPI Dashboard in Google Sheets
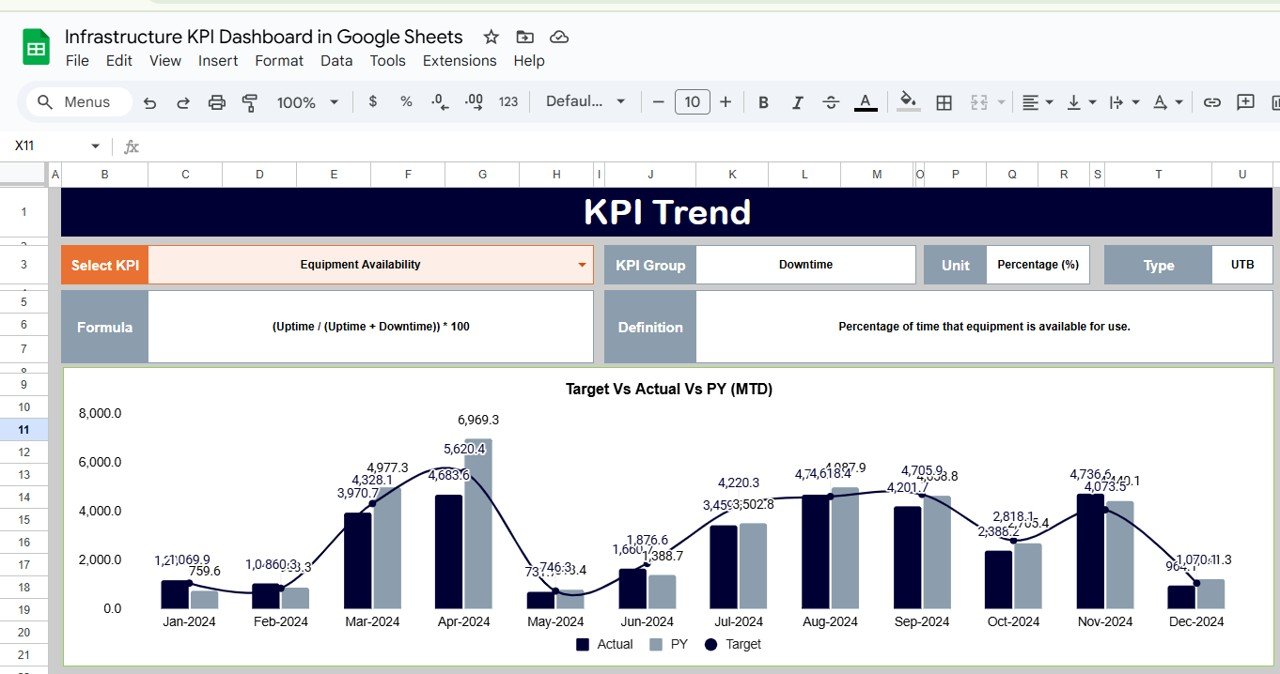
2. KPI Trend Sheet Tab
-
Select KPIs from the dropdown in Range C3.
-
Displays KPI group, unit of measure, type (Lower the Better or Upper the Better), formula, and KPI definition.

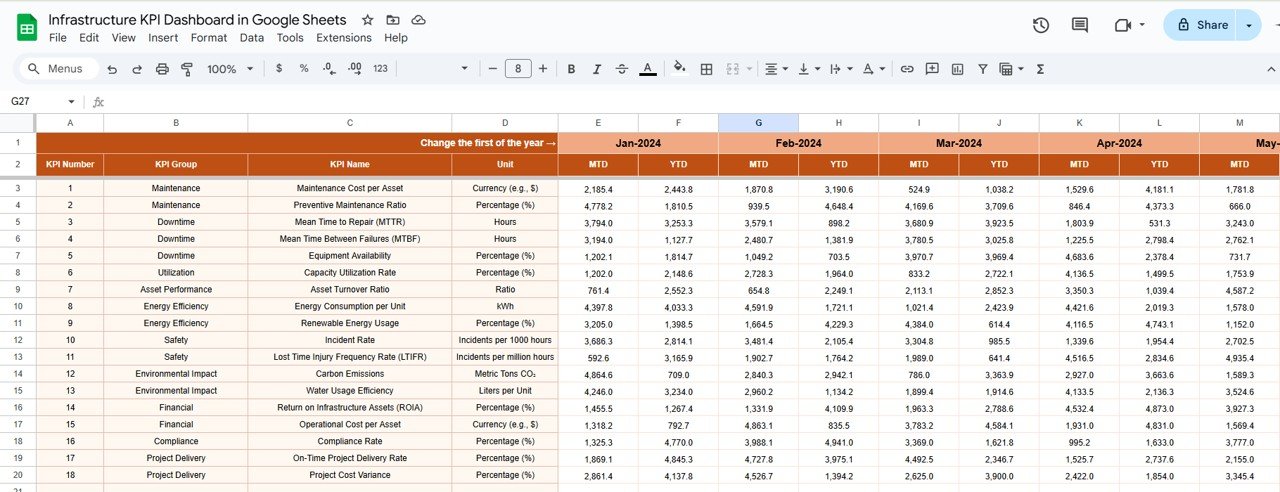
3. Actual Number Sheet Tab
-
Input actual numbers for MTD and YTD for the selected month.
-
The month selection is available in Range E1, where you input the first month of the year.

Click to buy Infrastructure KPI Dashboard in Google Sheets
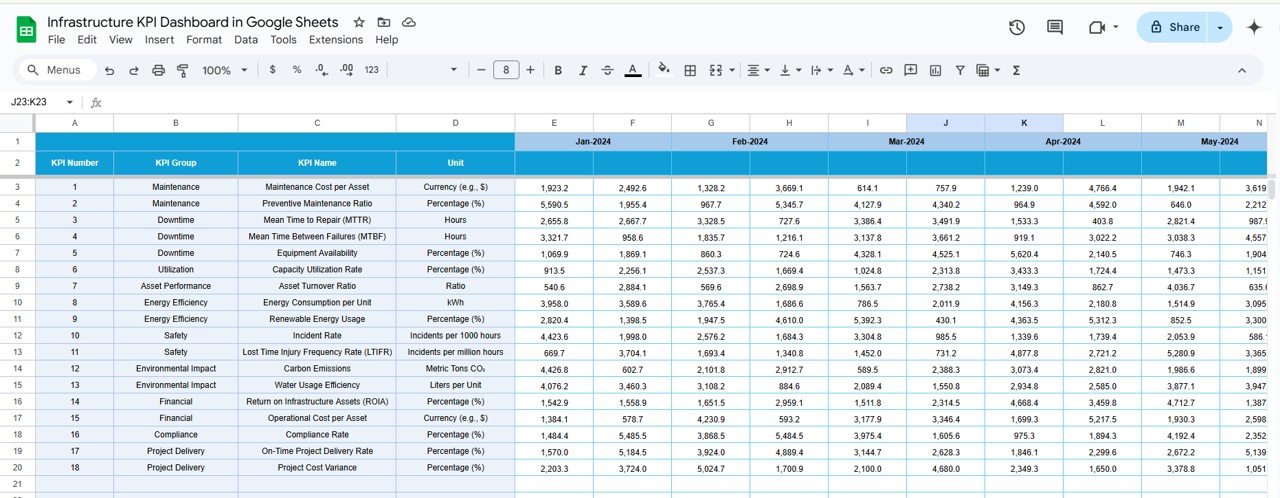
4. Target Sheet Tab
-
Enter target values for each KPI for MTD and YTD.
-
Helps track performance against the set goals.

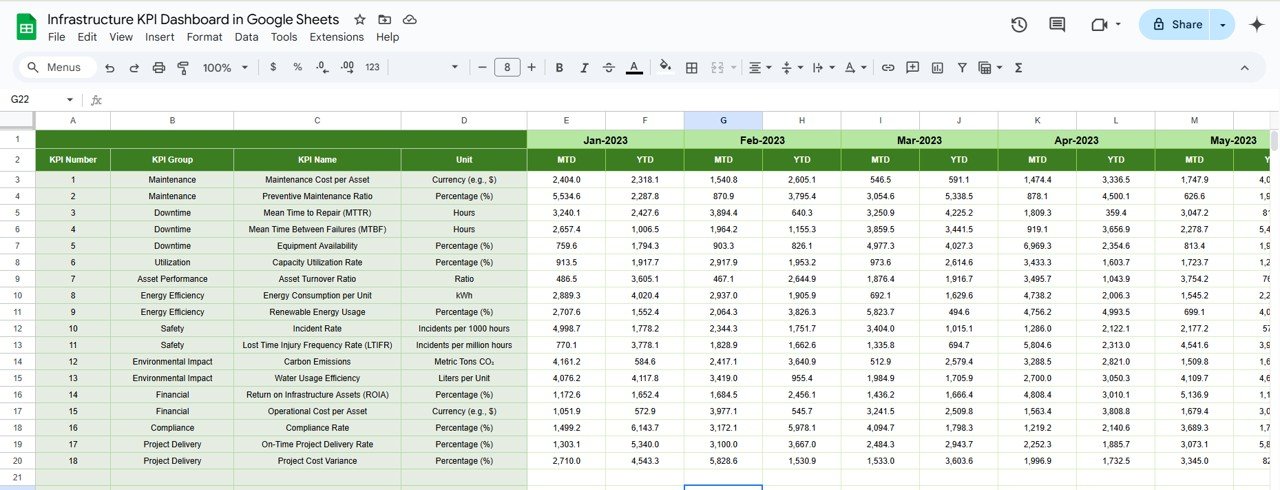
. Previous Year Number Sheet Tab
-
Enter the previous year’s data for accurate year-over-year comparisons.
-
Use the same format as the current year to maintain consistency.

Click to buy Infrastructure KPI Dashboard in Google Sheets
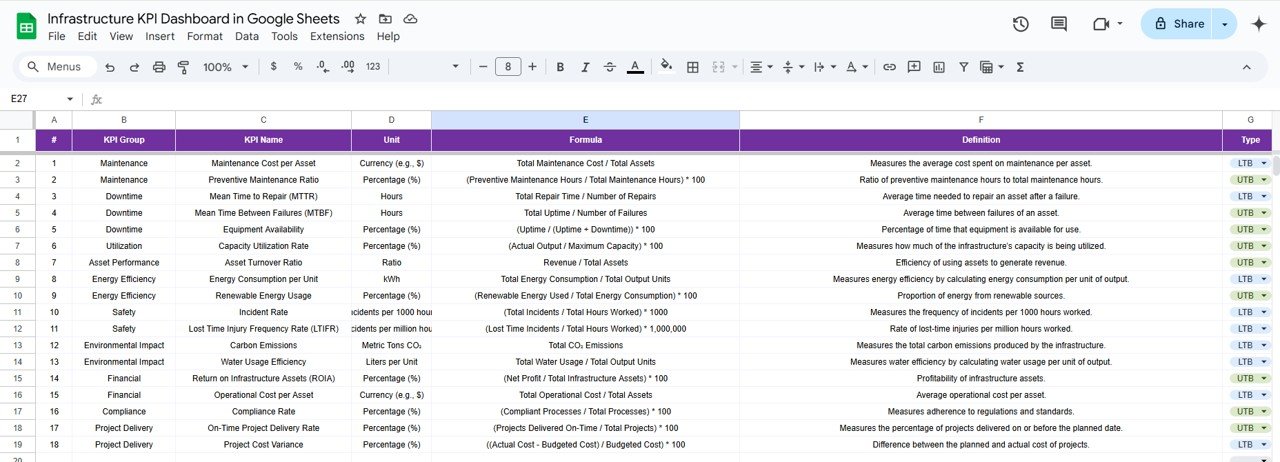
6. KPI Definition Sheet Tab
This sheet contains detailed information for each KPI, including:
- KPI Name
- KPI Group
- Unit of Measure
- Formula for KPI Calculation
- Definition of the KPI

Advantages of Using the Infrastructure KPI Dashboard in Google Sheets
The Infrastructure KPI Dashboard in Google Sheets offers several benefits:
-
Real-Time Data: Track KPIs in real-time, enabling timely decision-making and proactive management.
-
Customizable Templates: Easily modify the dashboard to suit your infrastructure goals, KPIs, and data sources.
-
Cost-Effective: Google Sheets is a free tool, making it an affordable option for infrastructure teams.
-
Cloud-Based Collaboration: Share the dashboard with team members or stakeholders for seamless collaboration.
-
Accessibility: The dashboard can be accessed from any device with internet connectivity, allowing for convenient monitoring.
Opportunities for Improvement in the Infrastructure KPI Dashboard
Click to buy Infrastructure KPI Dashboard in Google Sheets
While the Infrastructure KPI Dashboard in Google Sheets is a powerful tool, there are opportunities for improvement:
Automating Data Entry:
- Current Challenge: Manual data entry is time-consuming and prone to errors.
- Opportunity: Integrating the dashboard with external systems (e.g., asset management software) can automate data entry and improve accuracy.
Advanced Visualizations:
- Current Challenge: Basic visualizations may not provide in-depth insights.
- Opportunity: Add advanced visualizations like heatmaps, sparklines, or interactive charts for better data interpretation.
Customizable Reporting:
- Current Challenge: Reporting features are basic.
- Opportunity: Add customizable reporting features such as exporting to PDF, generating automated email reports, or creating custom reports based on specific metrics.
Best Practices for Using the Infrastructure KPI Dashboard
Click to buy Infrastructure KPI Dashboard in Google Sheets
To get the most out of the Infrastructure KPI Dashboard in Google Sheets, consider these best practices:
-
Update Regularly: Ensure data is updated at least monthly to maintain accurate insights into infrastructure performance.
-
Set Realistic Targets: Set achievable KPIs based on historical performance and industry benchmarks.
-
Leverage Conditional Formatting: Use color coding or up/down arrows to quickly identify performance trends and areas that need attention.
-
Collaborate with Stakeholders: Share the dashboard with key stakeholders to ensure everyone is aligned and informed on infrastructure performance.
-
Review KPIs Frequently: Regularly review the KPIs to assess infrastructure performance and identify areas for improvement.
Conclusion
The Infrastructure KPI Dashboard in Google Sheets is an essential tool for tracking key metrics related to infrastructure performance. By using this dashboard, teams can monitor progress, identify risks, and optimize their infrastructure operations effectively.
Frequently Asked Questions (FAQs)
What is a KPI in infrastructure management?
A KPI (Key Performance Indicator) is a measurable value used to assess the effectiveness of infrastructure systems. Common KPIs include asset utilization rate, downtime, and maintenance costs.
How do I customize my Infrastructure KPI Dashboard?
You can easily customize the dashboard by adding or removing KPIs, adjusting formulas, and changing the data sources to match your infrastructure needs.
How do I enter data into the Infrastructure KPI Dashboard?
Input actual numbers for MTD and YTD in the relevant sheets (Actual Numbers Sheet, Target Sheet, Previous Year Numbers Sheet) for each month.
Can I automate data entry?
Yes, you can integrate the dashboard with other systems like asset management software to automate data entry and reduce errors.
Which KPIs should I track in infrastructure management?
Key KPIs for infrastructure management include asset utilization rate, downtime, maintenance costs, and project delivery time.
Visit our YouTube channel to learn step-by-step video tutorials
Youtube.com/@NeotechNavigators
Watch the step-by-step video Demo:
