
In today’s digital world, IT departments play a crucial role in ensuring smooth operations and the security of business systems. As a result, it is essential for IT managers and teams to track and measure performance effectively. An IT Key Performance Indicator (KPI) Dashboard provides a streamlined way to track performance metrics, giving insights into how well IT systems are functioning.
Creating an IT KPI Dashboard in Google Sheets is an excellent choice for businesses looking for a cost-effective, collaborative, and customizable solution. In this article, we’ll guide you through creating a detailed IT KPI dashboard in Google Sheets. We will also list various KPIs with their units, formulas, and definitions, as well as outline best practices for using and improving this dashboard.
Introduction to IT KPI Dashboard in Google Sheets
A KPI Dashboard is an essential tool for tracking key metrics in various departments, including IT. KPIs measure the performance of IT infrastructure, software, support, and other critical services. By creating a Digital IT KPI Dashboard in Google Sheets, IT teams can continuously monitor the health of systems, user satisfaction, system uptime, and more. Google Sheets offers the perfect platform because of its flexibility, ease of use, and collaboration features.
In this article, we will walk you through the key features of a typical IT KPI Dashboard in Google Sheets. We will also discuss how to track, analyze, and visualize performance data for different IT-related KPIs such as uptime, ticket resolution time, and incident response.
2. Key Features of the IT KPI Dashboard
Click to buy IT KPI Dashboard in Google Sheets
The IT KPI Dashboard in Google Sheets consists of several sheets that make it easy to track and manage data. Here’s an overview of the key features:
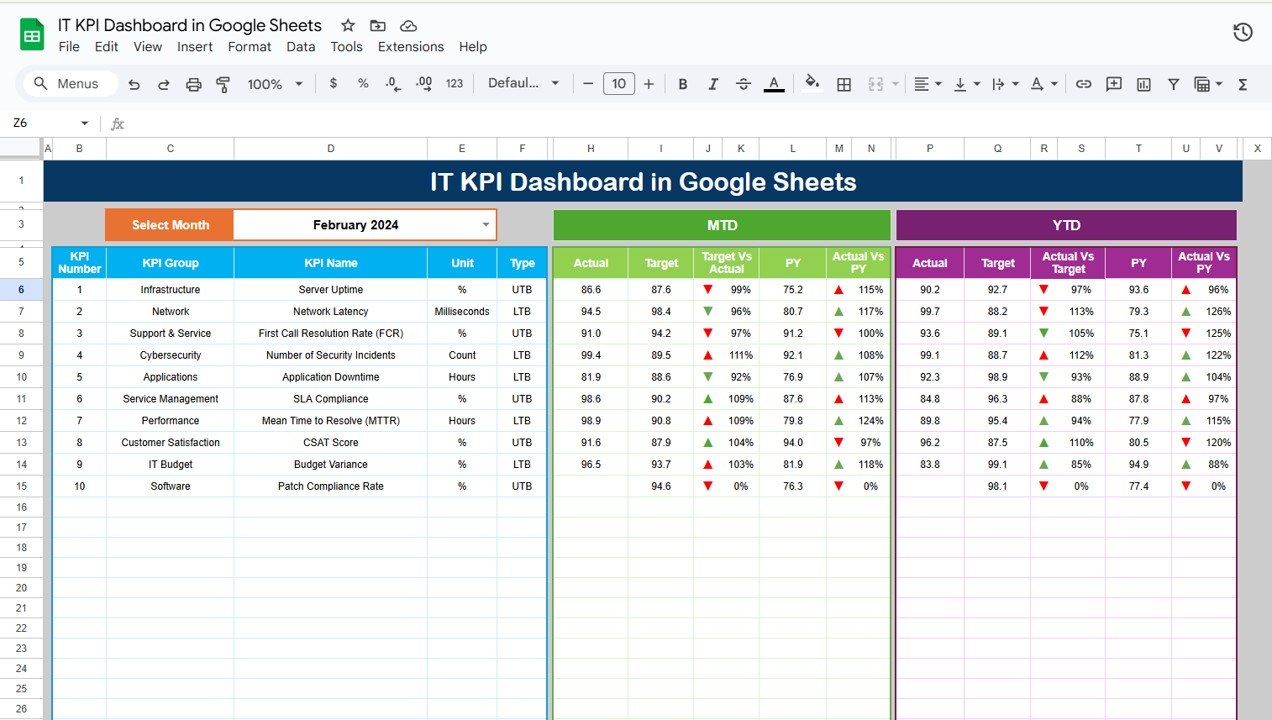
1. Dashboard Sheet Tab
The Dashboard Sheet Tab serves as the primary sheet where all KPI information is presented. It shows both MTD (Month-to-Date) and YTD (Year-to-Date) data, as well as Target vs. Actual comparisons, for each KPI. Additionally, the dashboard includes:
- Previous Year Data (PY) for comparison
- Conditional Formatting that uses arrows (up or down) to indicate performance trends
- A Month Selector dropdown (range D3) to filter data for specific months. Once you select the month, the entire dashboard updates automatically.

Click to buy IT KPI Dashboard in Google Sheets
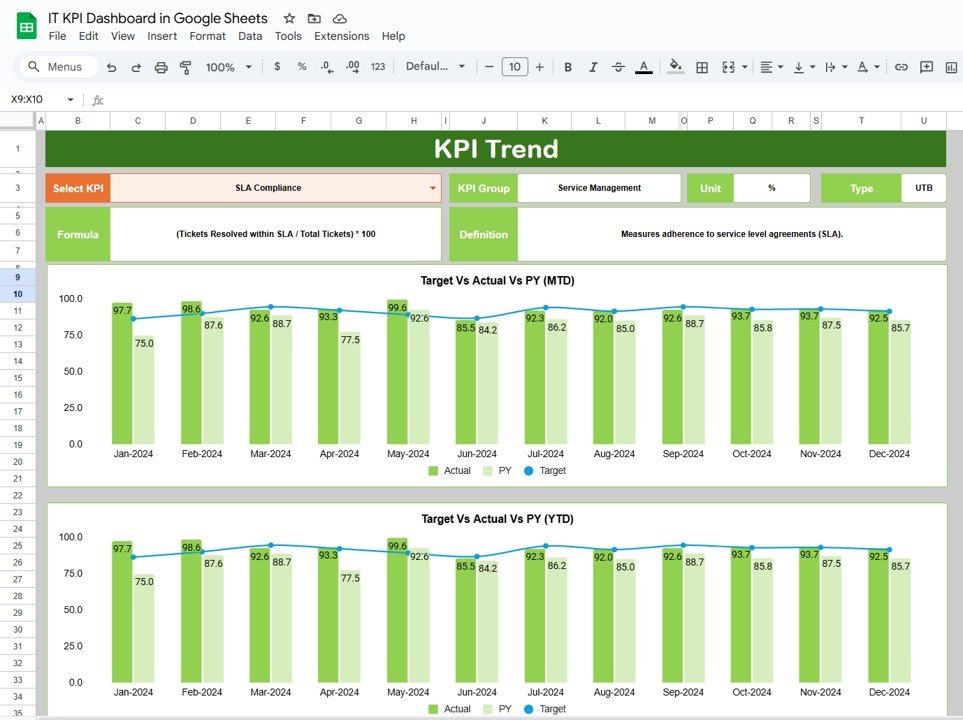
2. KPI Trend Sheet Tab
This sheet allows users to track the performance trend of each KPI over time. It includes:
- A dropdown (C3) to select the KPI
- Information on KPI Group, Unit, and whether the KPI is “Lower the Better” or “Upper the Better”
- The Formula used for calculation and the Definition of the KPI

Click to buy IT KPI Dashboard in Google Sheets
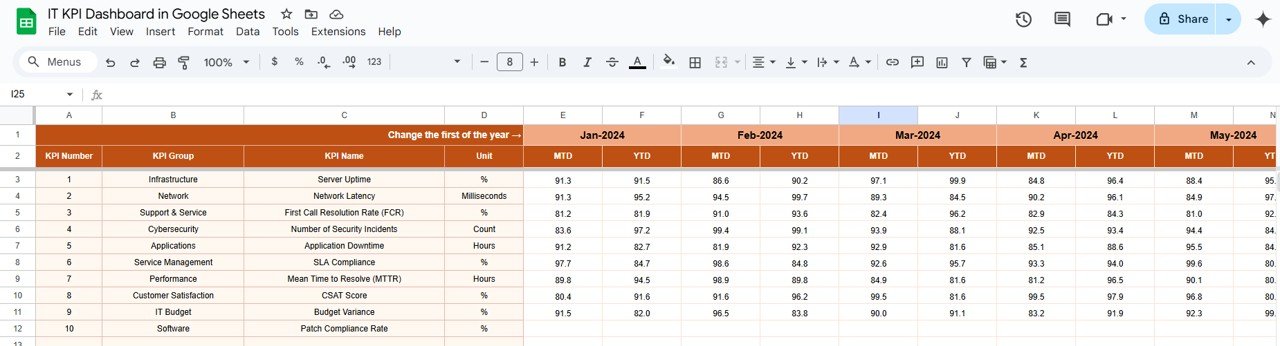
3. Actual Number Sheet Tab
In this sheet, users can input Actual Numbers for MTD and YTD for a given month. By changing the month in Range E1, the data updates automatically, making it easier to track performance month by month.

Click to buy IT KPI Dashboard in Google Sheets
4. Target Sheet Tab
Here, you enter the Target Numbers for each KPI for both MTD and YTD. This helps to compare actual performance against the goals set.


Click to buy IT KPI Dashboard in Google Sheets
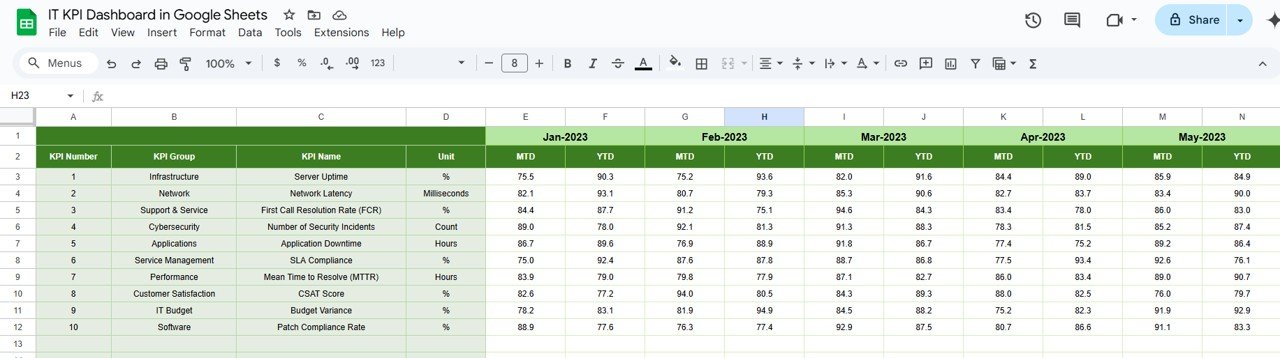
5. Previous Year Number Sheet Tab
This sheet is used to enter the data for the previous year, allowing you to compare this year’s performance with last year’s figures.

Click to buy IT KPI Dashboard in Google Sheets
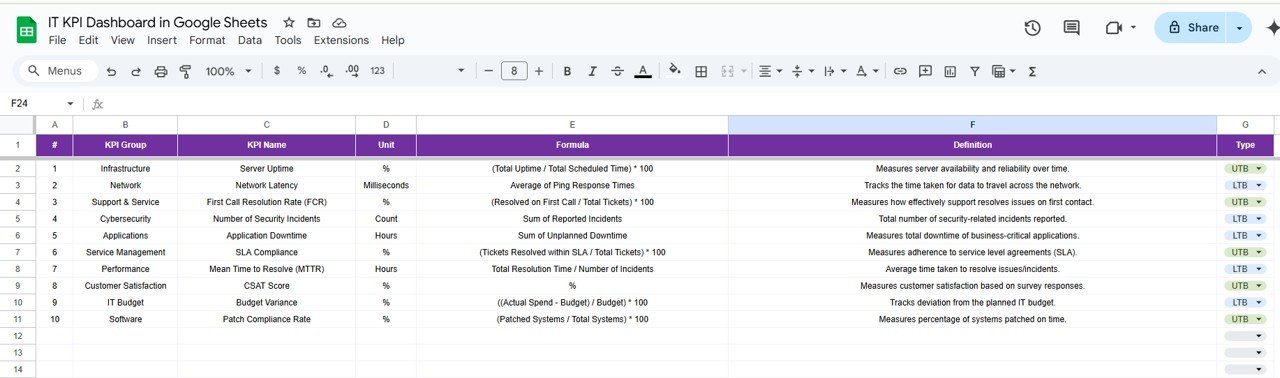
6. KPI Definition Sheet Tab
This tab provides comprehensive information about each KPI. It includes:
- KPI Name
- KPI Group
- Unit of Measurement
- Formula
- KPI Definition

Click to buy IT KPI Dashboard in Google Sheets
Advantages of Using an IT KPI Dashboard
An IT KPI Dashboard provides several advantages for IT teams and organizations, including:
- Improved Decision-Making: By tracking key metrics in real-time, an IT KPI Dashboard allows managers to make informed decisions quickly, ensuring that corrective actions are taken when necessary.
- Increased Efficiency: With all KPIs visible in one place, IT teams can efficiently track performance and focus on the areas that need attention, saving time and resources.
- Data-Driven Insights: The dashboard helps translate raw data into actionable insights. IT departments can quickly identify trends, weaknesses, and opportunities for improvement.
- Collaboration and Transparency: Since Google Sheets allows multiple users to access and edit the document, the IT KPI Dashboard fosters collaboration and transparency across teams.
Opportunities for Improvement in IT KPIs
While the IT KPI Dashboard provides valuable insights, there are always opportunities for improvement:
- Enhance Data Integration: Integrate your Google Sheets dashboard with other IT management tools like ServiceNow, JIRA, or Slack to automate data collection and minimize manual input.
- Include More User-Centric KPIs: Consider adding KPIs that measure user experience, such as user login success rate or application load times, to gain a better understanding of end-user satisfaction.
- Predictive Analytics: Incorporate predictive analytics to forecast future trends based on historical data. This can help your IT team plan and allocate resources effectively.
Click to buy IT KPI Dashboard in Google Sheets
Best Practices for the IT KPI Dashboard
To make the most out of your IT KPI Dashboard, follow these best practices:
- Keep It Simple
Focus on the most critical KPIs that align with your business goals. A dashboard cluttered with too many KPIs can overwhelm users.
- Update Regularly
Ensure that the dashboard is updated regularly with the latest data to reflect current performance. Automation can help reduce manual effort.
- Use Visual Indicators
Incorporate visual indicators like charts, graphs, and conditional formatting to make the data easy to read and understand at a glance.
- Make It Actionable
Ensure that the dashboard highlights areas requiring attention. For instance, if a KPI falls below a set threshold, the dashboard should clearly indicate this.
Frequently Asked Questions (FAQs)
What is an IT KPI Dashboard?
An IT KPI Dashboard is a tool that helps IT departments track and monitor key performance indicators related to system performance, support tickets, incidents, and more. It allows teams to assess their performance in real-time and make data-driven decisions.
How do I create an IT KPI Dashboard in Google Sheets?
To create an IT KPI Dashboard in Google Sheets, you can start by organizing your KPIs in separate tabs, then use functions and formulas to calculate and visualize the data. You can also use drop-down menus and conditional formatting to enhance the dashboard’s usability.
What KPIs should I include in my IT KPI Dashboard?
Common KPIs for IT departments include system uptime, ticket resolution time, incident response time, network downtime, and employee satisfaction with IT services.
How often should I update the data in my IT KPI Dashboard?
It’s best to update the dashboard regularly—either daily, weekly, or monthly—depending on the frequency at which your team tracks and reports performance.
Conclusion
An IT KPI Dashboard in Google Sheets is an essential tool for tracking, analyzing, and improving IT department performance. By utilizing KPIs, you can measure critical areas like system uptime, support ticket resolution, and incident response times. Regular updates and continuous improvements will help your IT department stay on top of challenges and drive better results for the organization.
Visit our YouTube channel to learn step-by-step video tutorials
Youtube.com/@NeotechNavigators
Click to buy IT KPI Dashboard in Google Sheets
Watch the step-by-step video Demo:
