
In the fast-paced world of marketing, tracking campaign performance and optimizing budgets are critical to ensuring a high return on investment (ROI). The Marketing Dashboard in Google Sheets provides a simple yet powerful solution for marketers to monitor key metrics, track budgets, and analyze the success of various campaigns. This ready-to-use dashboard is designed to give you a comprehensive view of your marketing performance, helping you make data-driven decisions.
What is a Marketing Dashboard in Google Sheets?
A Marketing Dashboard in Google Sheets is a customizable tool that helps marketing teams track and visualize key performance indicators (KPIs) related to their campaigns. It consolidates data such as budgets, revenue, conversions, and other essential metrics into a single, easy-to-read dashboard. By using this dashboard, marketers can make informed decisions on how to allocate their resources more effectively and optimize their campaigns for better results.
Key Features of the Marketing Dashboard in Google Sheets
Click to buy Marketing Dashboard in Google Sheets
The Marketing Dashboard in Google Sheets consists of several interactive sheets, each providing valuable insights into different aspects of your marketing operations. Here are the key features of each sheet:
1. Dashboard Sheet Tab
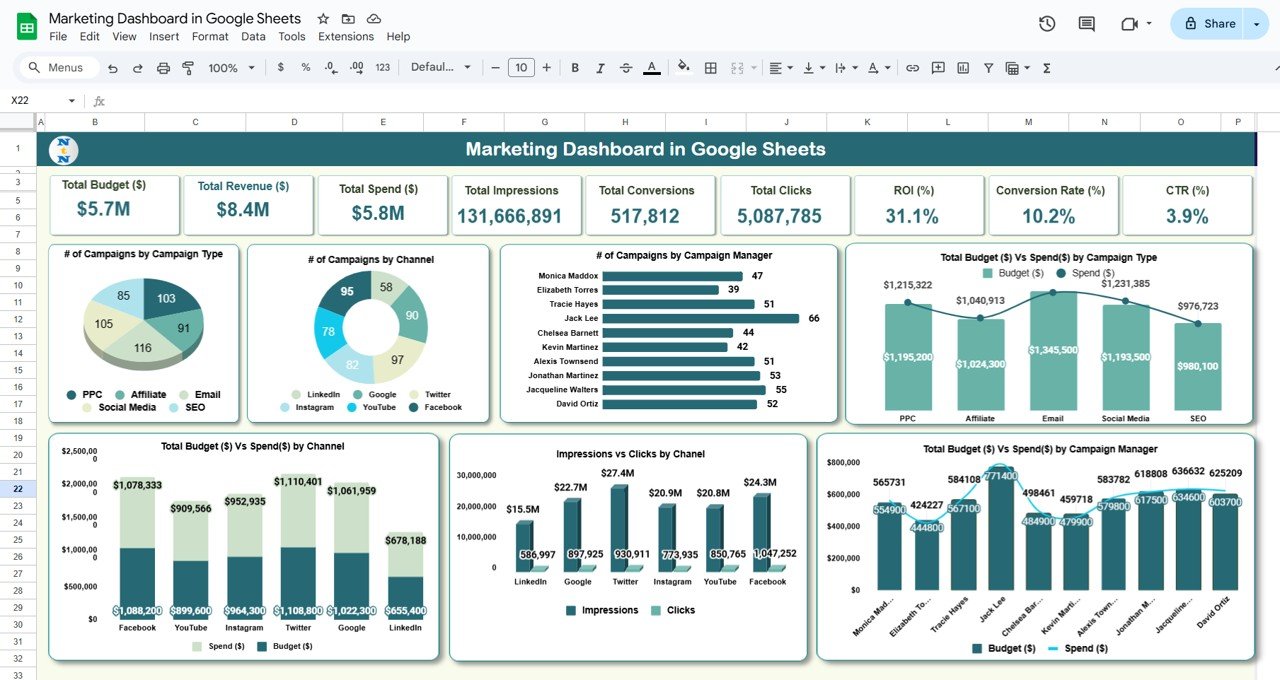
The Dashboard sheet provides an overview of your marketing performance through various cards and charts:
Cards:
- Total Budget ($): Displays the total marketing budget allocated.
- Total Revenue ($): Shows the total revenue generated by the campaigns.
- Total Spend ($): Tracks the total spending across campaigns.
- Total Impressions: Displays the total number of impressions generated by the campaigns.
- Total Conversions: Shows the total number of conversions (sales, sign-ups, etc.) from the campaigns.
- Total Clicks: Tracks the total number of clicks across campaigns.
- ROI (%): Displays the return on investment percentage for marketing activities.
- Conversion Rate (%): Tracks the percentage of visitors who completed the desired action (e.g., purchase).
- CTR (%): Measures the click-through rate for campaigns.
Charts:
- # of Campaigns by Campaign Type: Displays a breakdown of campaigns by their type (e.g., PPC, Social Media, etc.).
- # of Campaigns by Channel: Visualizes the number of campaigns by marketing channel (e.g., Email, SEO, Paid Ads).
- # of Campaigns by Campaign Manager: Tracks the number of campaigns run by each campaign manager.
- Total Budget ($) vs Spend ($) by Campaign Type: Compares the budget and spend across different campaign types.
- Total Budget ($) vs Spend ($) by Channel: Compares the budget and spend across different marketing channels.
- Impressions vs Clicks by Channel: Displays the number of impressions and clicks by each channel.
- Total Budget ($) vs Spend ($) by Campaign Manager: Compares budget and spend for campaigns managed by different managers.

Click to buy Marketing Dashboard in Google Sheets
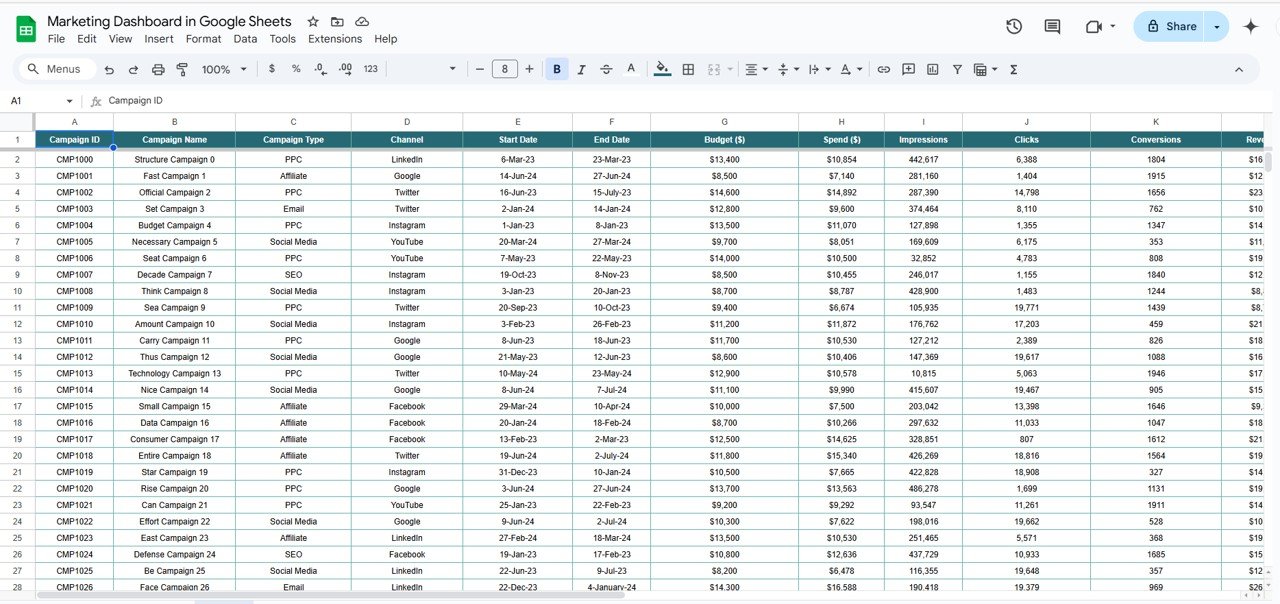
2. Data Sheet Tab
The Data Sheet is where you input the raw campaign data. This sheet acts as the source for all the charts and calculations in the dashboard. Here, you will enter key metrics such as campaign type, channel, budget, spend, impressions, clicks, conversions, and more. As new data is entered, the dashboard will automatically update with the latest information.

How the Marketing Dashboard Helps Improve Marketing Campaigns
The Marketing Dashboard in Google Sheets provides valuable insights that can help you optimize your marketing efforts:
-
Track Campaign Performance: Monitor key metrics like impressions, clicks, and conversions in real time, allowing you to identify which campaigns are performing well and which ones need adjustments.
-
Measure ROI: The ROI card and chart enable you to evaluate the effectiveness of each campaign by comparing the total revenue to the total spend, helping you allocate resources more efficiently.
-
Optimize Campaign Budgeting: By comparing total budget vs. spend across campaign types, channels, and managers, you can make informed decisions about where to allocate your marketing budget for maximum impact.
-
Improve Conversion Rates: By tracking conversion rates and identifying underperforming campaigns, you can adjust your strategies to improve overall performance.
Advantages of Using the Marketing Dashboard in Google Sheets
Click to buy Marketing Dashboard in Google Sheets
The Marketing Dashboard in Google Sheets offers several advantages for marketing teams and organizations:
-
Real-Time Insights: The dashboard updates automatically as you input new data, providing real-time insights into the performance of your campaigns.
-
Easy to Use: The dashboard is designed to be user-friendly, with simple charts and cards that make it easy to visualize data and identify trends.
-
Customizable: The template is fully customizable, so you can tailor it to fit your specific marketing goals and data needs.
-
Cost-Effective: Since the dashboard is built in Google Sheets, it’s a cost-effective solution that doesn’t require expensive software or tools.
-
Comprehensive Overview: By consolidating all key metrics in one place, the dashboard gives you a comprehensive view of your marketing operations, making it easier to analyze performance and adjust strategies accordingly.
Best Practices for Using the Marketing Dashboard in Google Sheets
To make the most of your Marketing Dashboard in Google Sheets, follow these best practices:
-
Regularly Update Data: Ensure that you input data consistently and accurately to keep the dashboard up to date.
-
Review Key Metrics: Regularly review metrics like ROI, CTR, and conversion rates to identify trends and make adjustments where necessary.
-
Set Clear Goals: Use the dashboard to set and track marketing goals, such as increasing conversions, improving CTR, or staying within budget.
-
Segment Campaigns: Use the campaign type, channel, and manager filters to analyze the performance of different segments and optimize accordingly.
-
Collaborate with Team Members: Share the dashboard with your marketing team to keep everyone aligned on campaign performance and goals.
Conclusion
Click to buy Marketing Dashboard in Google Sheets
The Marketing Dashboard in Google Sheets is a powerful, easy-to-use tool that provides a comprehensive overview of your marketing campaigns. By tracking key metrics like budget, spend, impressions, conversions, and ROI, the dashboard helps you make data-driven decisions and optimize your marketing strategies. Whether you’re a marketing manager or team member, this dashboard will help you improve performance, increase efficiency, and maximize your return on investment.
Frequently Asked Questions (FAQs)
1. How do I enter data into the Marketing Dashboard?
Data is entered in the Data Sheet tab, where you can input key metrics such as campaign type, channel, budget, impressions, clicks, and conversions.
2. Can I customize the Marketing Dashboard?
Yes, the dashboard is fully customizable. You can modify charts, add new metrics, and adjust the layout to suit your specific marketing needs.
3. How does the dashboard help with budget optimization?
The dashboard compares total budget vs. spend across campaign types, channels, and managers, allowing you to identify areas where you can optimize your marketing budget.
4. What are the key metrics tracked by the Marketing Dashboard?
The key metrics include total budget, total revenue, impressions, clicks, conversions, CTR, ROI, and more.
5. How does the Marketing Dashboard improve campaign performance?
By providing real-time insights into key metrics, the dashboard helps identify underperforming campaigns, optimize budget allocation, and improve conversion rates.
Visit our YouTube channel to learn step-by-step video tutorials