


In today’s blog post, we’re diving into two powerful Google Sheets functions: UNIQUE & COUNTIF Functions. Whether you’re managing large datasets or just trying to organize some information, these functions can save you time and effort. We’ll walk through a real-world example to show you how to use these functions together to make data management a breeze.
Why Use the UNIQUE & COUNTIF Functions?
First, let’s talk about why these functions are so useful. The UNIQUE function helps you pull out distinct values from a range, eliminating duplicates, while the COUNTIF function counts how many times certain data points appear in your dataset. When combined, these two functions become a powerful tool for analyzing and organizing your data.
Our Example Dataset
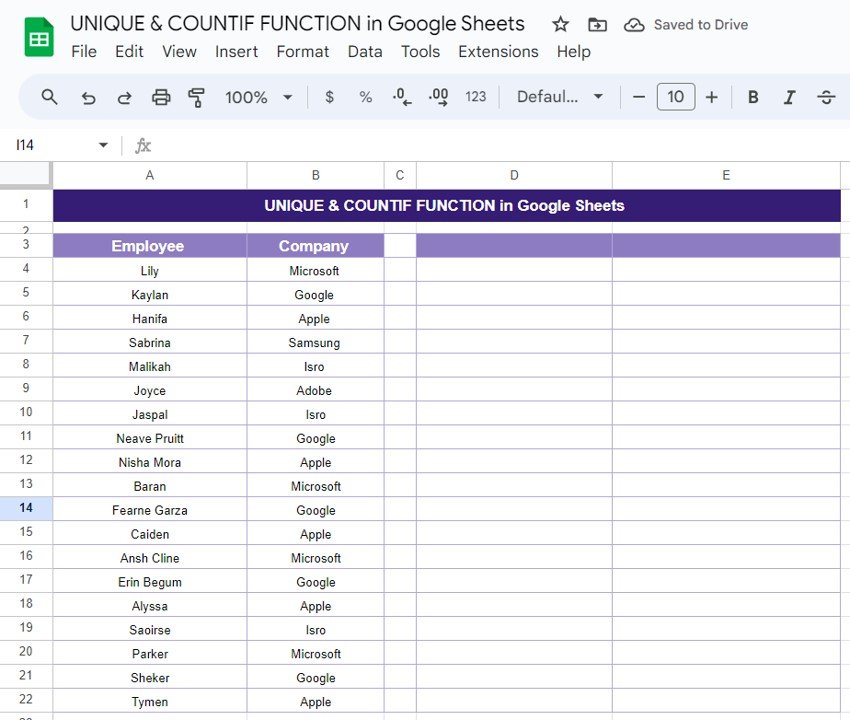
For this tutorial, we’ll be working with a simple dataset of employee names and their respective companies. Here’s a snapshot of the data we’re using:
The dataset spans from cell A3 to B22 in our Google Sheet. We want to use this data to get a list of unique companies and count how many times each company appears in the list.

Step 1: Using the UNIQUE Function
Let’s start by extracting a list of unique company names from our dataset. To do this, we’ll use the UNIQUE function. Here’s the formula:
=UNIQUE(B4:B22)
This formula looks at the range of company names (B4 to B22) and pulls out only the unique values. It will remove any duplicates and give us a clean list of companies.
Formula Breakdown:
- B4: This is the range of cells containing the company names.
- UNIQUE: This function ensures that only distinct company names are returned, even if they appear multiple times.
Step 2: Using the COUNTIF Function
Now that we have a list of unique companies, the next step is to count how many times each company appears in our dataset. This is where the COUNTIF comes in. We’ll use the following formula:
=COUNTIF(B4:B22,$D$4:$D$13)
Here’s what this formula does: it counts how many times each company listed in the unique range (D4 to D13) appears in the original dataset (B4 to B22).
Formula Breakdown:
- B4: The range we’re counting in—this is the original list of company names.
- $D$4:$D$13: The unique company names generated by the UNIQUE. By using absolute references, we ensure that the formula counts correctly as it’s copied down the column.
Step 3: The Final Output
After applying both formulas, here’s what the final result looks like:
As you can see, the UNIQUE function gave us a list of companies without duplicates, and the COUNTIF function showed us how many times each company appears in the dataset.


Why This Combination Works
This combination of UNIQUE and COUNTIF is incredibly powerful for anyone working with repetitive data. It allows you to: ✅ Simplify Data: The UNIQUE function automatically cleans your data by removing duplicates. 🔄 Get Accurate Counts: The COUNTIF ensures you have accurate numbers for each unique value. 🚀 Effortless Scalability: This method works equally well for small datasets or larger ones.
Conclusion
By combining the UNIQUE and COUNTIF in Google Sheets, you can easily analyze and organize your data with just a few simple steps. Whether you’re tracking employee data, sales, or any other kind of information, these functions will help you streamline your workflow.
Visit our YouTube channel to learn step-by-step video tutorials
Youtube.com/@NeotechNavigators