
Managing a music festival involves tracking ticket sales, audience engagement, artist performance, and overall operational efficiency. The Music Festival KPI Dashboard in Google Sheets provides a ready-to-use solution to monitor critical metrics, analyze trends, and make data-driven decisions Music Festival KPI Dashboard in Google Sheets
In this article, we will explore the features, advantages, best practices, and FAQs for this powerful dashboard.Music Festival KPI Dashboard in Google Sheets
What Is a Music Festival KPI Dashboard?
A Music Festival KPI Dashboard is a digital tool that consolidates festival-related metrics into a single, interactive Google Sheet. It allows festival organizers to track:
-
Ticket sales and revenue
-
Attendance and engagement
-
Artist performance and schedules
-
Operational efficiency
By using this dashboard, organizers can compare month-to-date (MTD) and year-to-date (YTD) metrics, monitor progress against targets, and analyze trends across different KPIs.
Key Features of the Music Festival KPI Dashboard
The dashboard contains 6 worksheets, each serving a specific purpose:
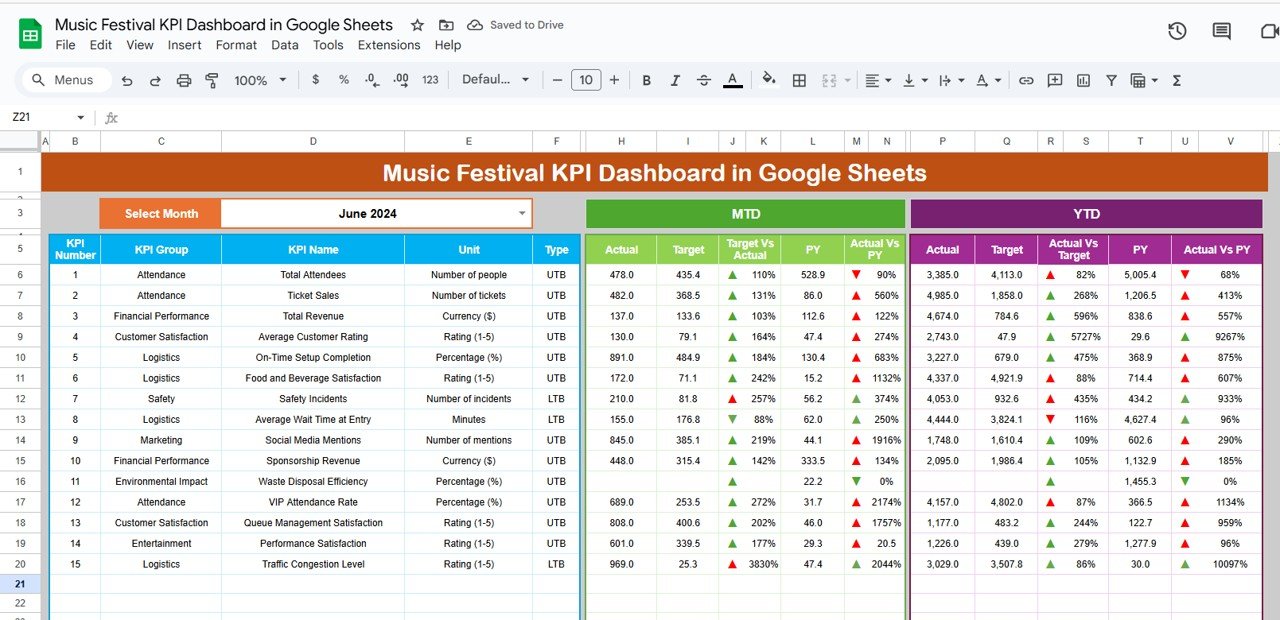
1. Dashboard Sheet Tab
The Dashboard Sheet provides an overview of all KPIs.
Key features:
-
Month Selection Dropdown (Range D3): Updates all dashboard metrics dynamically
-
MTD Metrics: Actual, target, and previous year numbers with conditional formatting arrows
-
YTD Metrics: Year-to-date performance with visual indicators for quick insights
-
Supports comparison between Target vs Actual and PY vs Actual
This sheet is ideal for a high-level view of festival performance.

Click to Buy Music Festival KPI Dashboard in Google Sheets
2. KPI Trend Sheet Tab
The KPI Trend Sheet provides detailed insights for each metric:
-
Select a KPI from the dropdown (Range C3)
-
Displays KPI Group, Unit, Type (Lower-the-Better or Upper-the-Better)
-
Shows KPI Formula and Definition
-
Tracks trends over time to evaluate performance
This sheet helps identify underperforming areas and monitor improvements.


Click to Buy Music Festival KPI Dashboard in Google Sheets
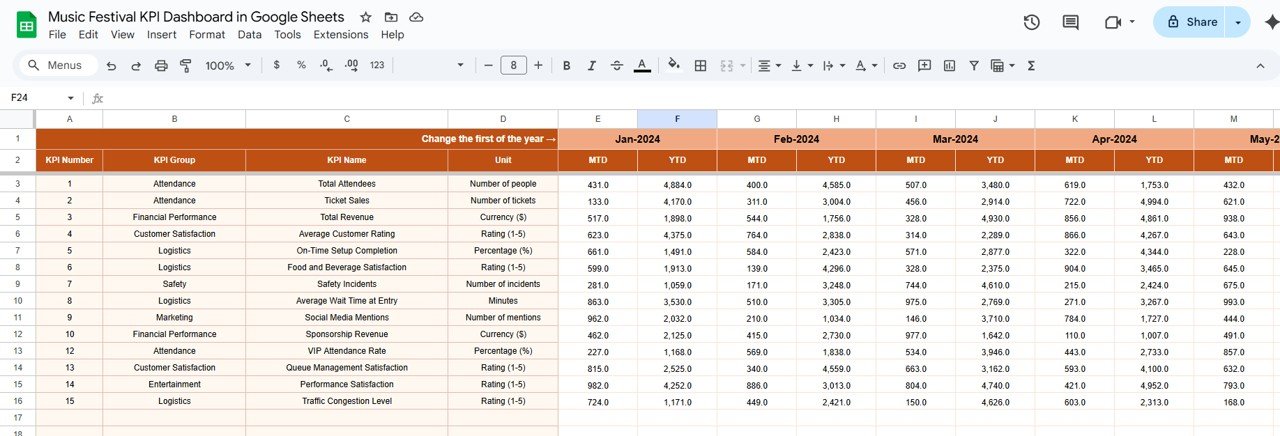
3. Actual Number Sheet Tab
-
Enter actual values for each KPI for MTD and YTD
-
Change the starting month of the year in Range E1 to update data dynamically
This ensures accurate reflection of real performance metrics in the dashboard.

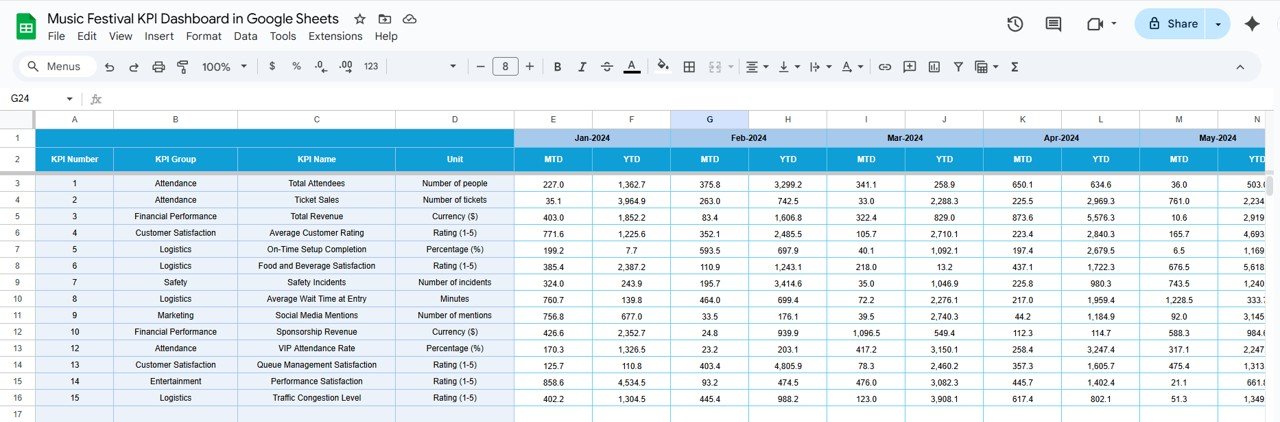
4. Target Sheet Tab
-
Enter target numbers for each KPI for the selected month
-
Includes both MTD and YTD targets
-
Enables comparison of actual performance against goals

Click to Buy Music Festival KPI Dashboard in Google Sheets
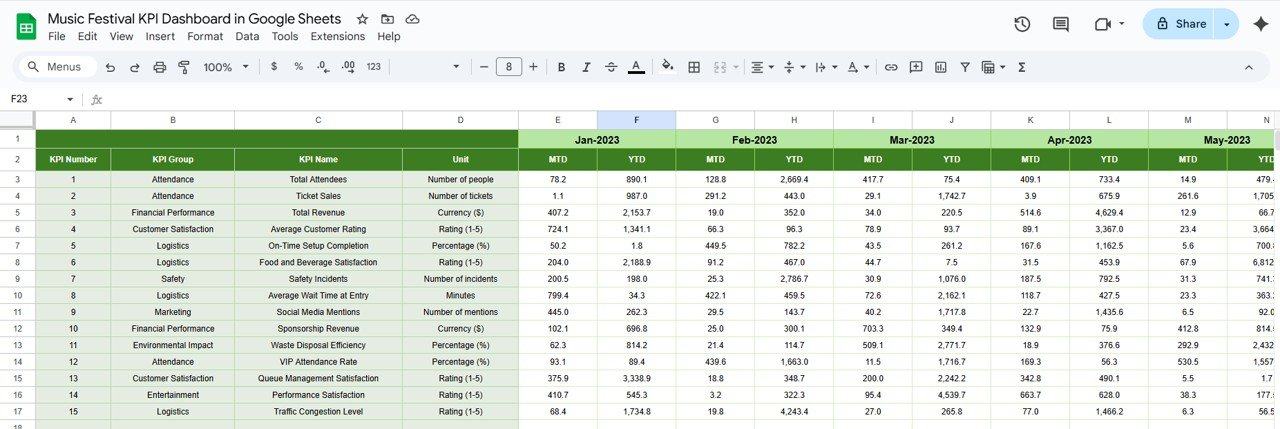
5. Previous Year Numbers Sheet Tab
-
Enter previous year KPI data
-
Supports year-over-year comparison for better trend analysis
This sheet helps festival organizers understand performance growth and seasonality.

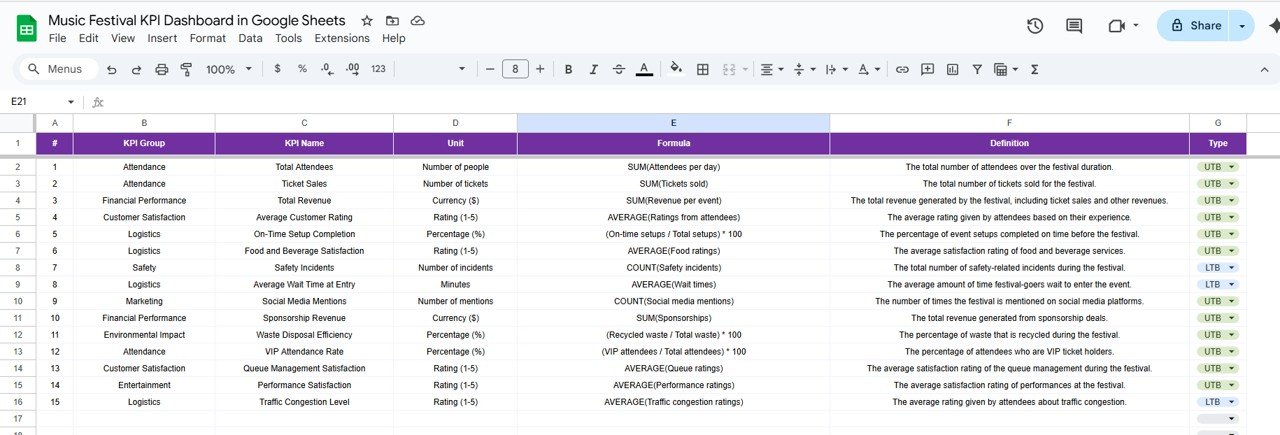
6. KPI Definition Sheet Tab
-
Document KPI Name, Group, Unit, Formula, Definition, and Type (Upper or Lower the Better)
-
Ensures clarity and consistency for all metrics
This sheet acts as a reference for all festival KPIs.

Click to Buy Music Festival KPI Dashboard in Google Sheets
Advantages of Using the Music Festival KPI Dashboard
-
Centralized Data: All festival metrics in one Google Sheet
-
Real-Time Insights: Instantly update and visualize performance
-
Trend Analysis: Track month-to-month and year-to-date performance
-
Identify Bottlenecks: Highlight underperforming events or activities
-
Decision Support: Allocate resources based on actual data
-
Customizable: Adjust KPIs, targets, and formulas as needed
Best Practices for Using the Dashboard
Click to Buy Music Festival KPI Dashboard in Google Sheets
-
Update Data Regularly: Enter actual numbers promptly for accurate tracking
-
Segment KPIs: Track performance by day, stage, artist, or location
-
Monitor Conversion Rates: Identify successful promotions and channels
-
Analyze Attendance Trends: Optimize event schedules based on trends
-
Track Revenue vs Costs: Ensure profitability by monitoring expenses alongside revenue
-
Use Conditional Formatting: Highlight key performance metrics for easy interpretation
How This Dashboard Helps Festival Organizers
-
Optimize Operations: Understand peak attendance times and resource needs
-
Improve Audience Engagement: Track feedback and social media metrics
-
Monitor Artist Performance: Identify high-performing artists and popular stages
-
Plan Future Events: Use KPI trends for strategic planning and budgeting
-
Maximize Revenue: Allocate marketing and sales resources effectively
Frequently Asked Questions (FAQs)
Click to Buy Music Festival KPI Dashboard in Google Sheets
Q1: Can I customize the KPIs for my festival?
Yes, the dashboard is fully customizable. You can add or remove KPIs to fit your festival’s specific requirements.
Q2: How often should data be updated?
Ideally, update the data daily or after each event for real-time tracking.
Q3: Can I track performance by location or stage?
Yes, KPIs can be filtered by stage, location, or artist for detailed analysis.
Q4: Does this dashboard show trends over time?
Yes, the KPI Trend Sheet visualizes MTD and YTD performance for each metric.
Q5: Is this dashboard suitable for large music festivals?
Absolutely. It can handle multiple stages, artists, and locations efficiently using Google Sheets.
Conclusion
The Music Festival KPI Dashboard in Google Sheets is a comprehensive solution for tracking festival performance. With MTD and YTD metrics, trend analysis, and clear KPI definitions, festival organizers can make data-driven decisions, improve audience engagement, and optimize operational efficiency.
Visit our YouTube channel to learn step-by-step video tutorials
Youtube.com/@NeotechNavigators
Watch the step-by-step video Demo:
