
In the fast-paced world of digital marketing, performance tracking is essential to evaluate the effectiveness of marketing strategies. The Performance Marketing KPI Dashboard in Google Sheets is a ready-to-use template designed to help marketers track and optimize key performance indicators (KPIs). This dashboard allows marketers to analyze various metrics, including MTD (Month-to-Date) and YTD (Year-to-Date) data, and compare current performance with previous periods.
In this article, we will walk you through the key features of the Performance Marketing KPI Dashboard, explain how it works, and demonstrate how it can help you improve your marketing strategies.
What is the Performance Marketing KPI Dashboard in Google Sheets?
The Performance Marketing KPI Dashboard in Google Sheets is a template designed to track the most important metrics in your performance marketing campaigns. This dashboard provides real-time insights into key marketing metrics, such as sales performance, customer acquisition costs, conversion rates, and more. It allows businesses to compare current performance to target goals and historical data, ensuring that marketing efforts are aligned with business objectives.
Key Features of the Performance Marketing KPI Dashboard
The Performance Marketing KPI Dashboard consists of several worksheets designed to track and analyze your marketing performance. Below are the key features:
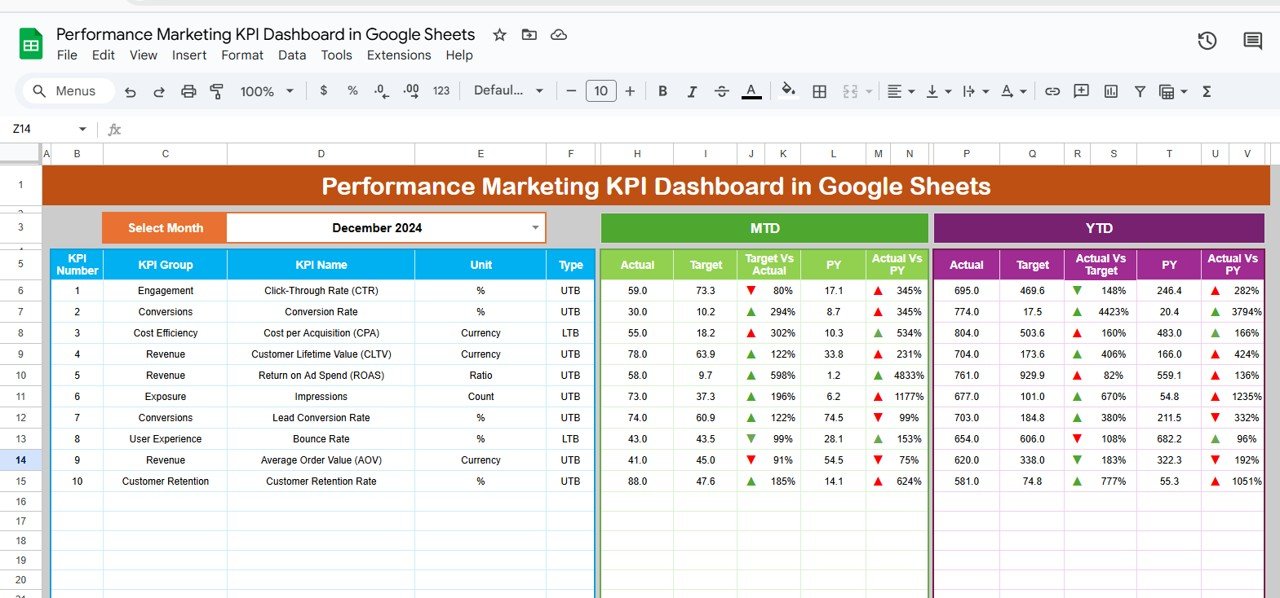
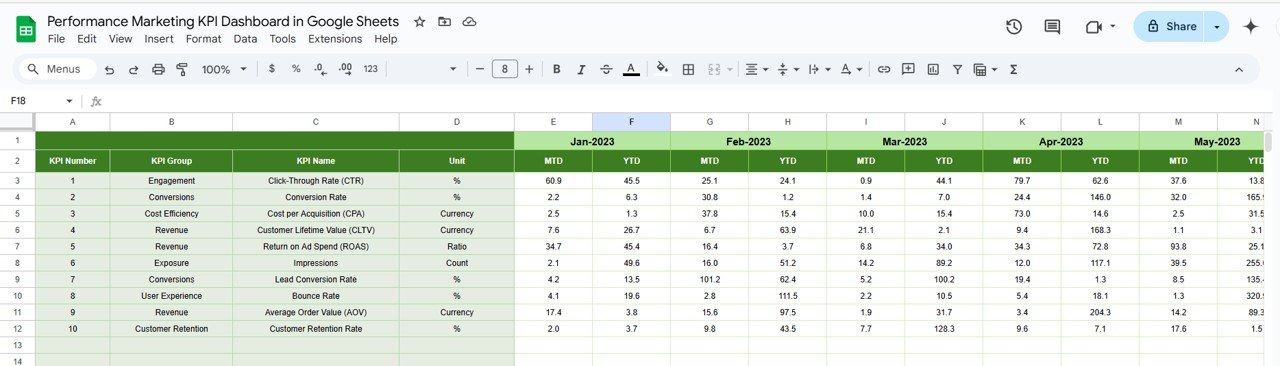
1. Dashboard Sheet Tab
The Dashboard Sheet is the main tab where you can view all of the KPIs at a glance.
-
Month Selection (D3): Select the month from the dropdown menu to update the dashboard with data for that specific month.
-
MTD Actual, Target, and Previous Year Data: The dashboard shows your actual performance for the month, the target you aimed to achieve, and comparisons with last year’s data.
-
YTD Actual, Target, and Previous Year Data: Similar to MTD data but covering the entire year so far, allowing you to assess progress.
-
Conditional Formatting: Green and red arrows indicate whether the current performance is above or below the target, making it easy to spot trends.

Click to buy Performance Marketing KPI Dashboard in Google Sheets
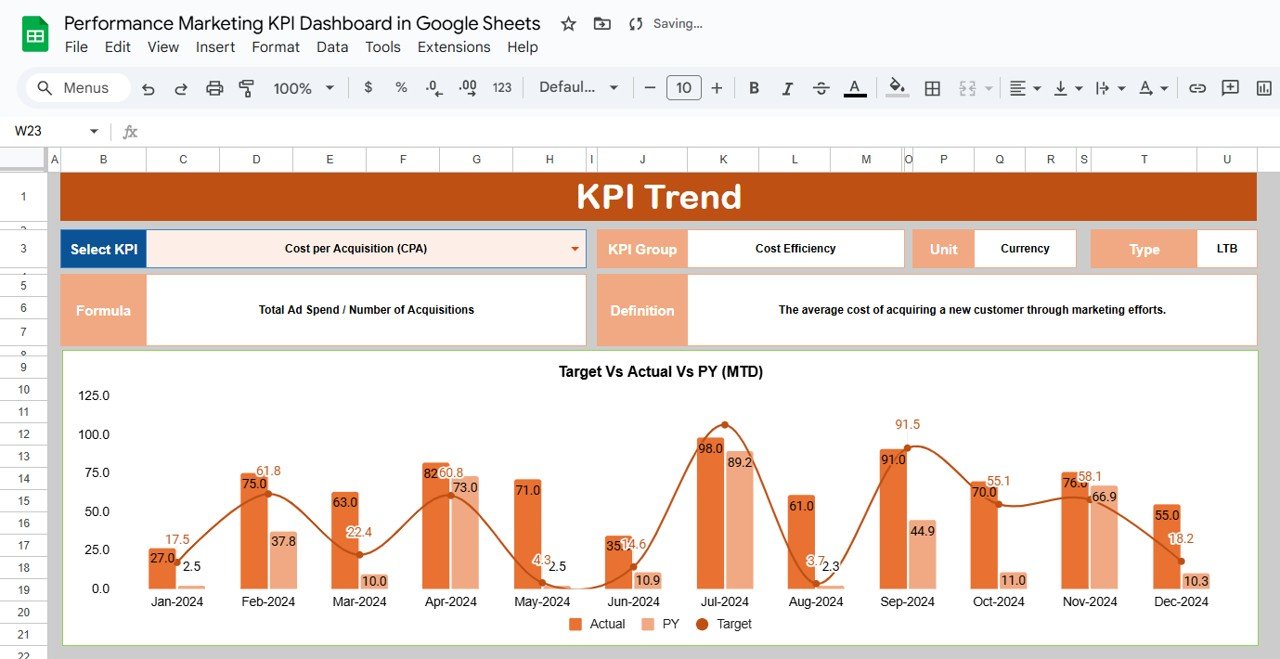
2. KPI Trend Sheet Tab
The KPI Trend Sheet enables you to track performance trends over time.
-
KPI Selection (C3): Choose the KPI you want to track from a dropdown list.
-
KPI Group, Unit, Type: The dashboard categorizes each KPI into a group (e.g., acquisition, conversion, retention), defines its unit of measurement (e.g., percentage, dollar amount), and indicates whether the KPI should be “Lower the Better” or “Upper the Better.”
-
Formula and Definition: Each KPI has its calculation method and definition, ensuring you understand how the metric is being tracked.

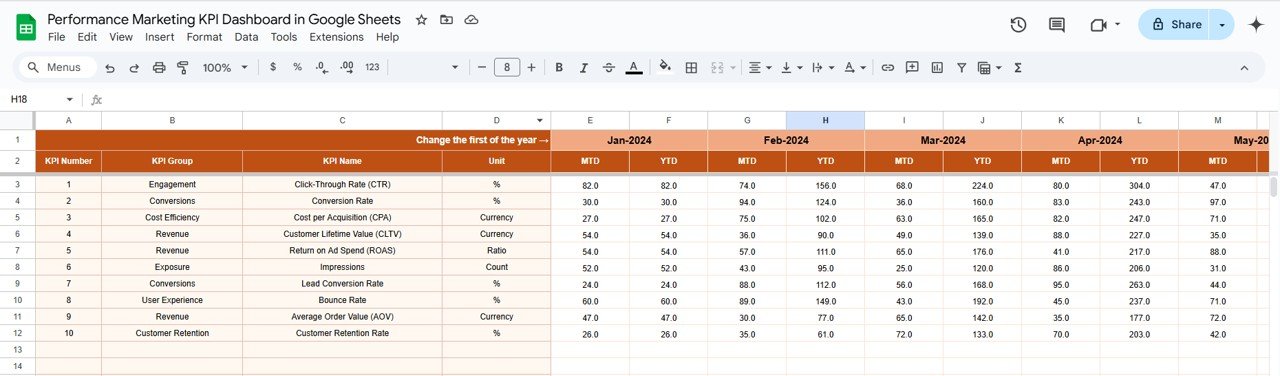
3. Actual Number Sheet Tab
In this sheet, you input the actual numbers for your KPIs.
-
YTD and MTD Data: Enter your performance data for the current month (MTD) and year-to-date (YTD).
-
Automatic Updates: The data entered here automatically updates the corresponding fields in the Dashboard Sheet.

Click to buy Performance Marketing KPI Dashboard in Google Sheets
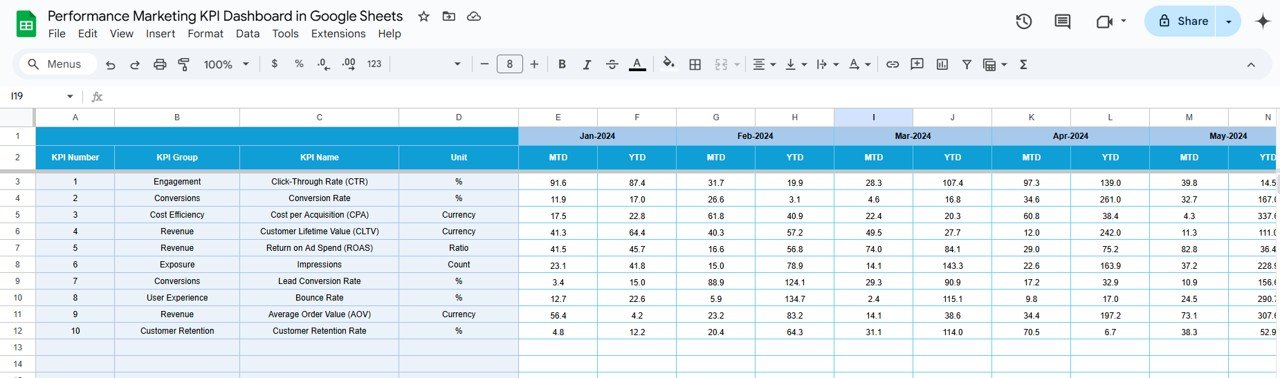
4. Target Sheet Tab
The Target Sheet is where you input the target values for your KPIs.
-
Monthly and YTD Targets: Set the target numbers for each KPI for the current month and year-to-date. The dashboard will compare actual performance against these targets.

5. Previous Year Numbers Sheet Tab
Track your historical performance by entering previous year’s data in this sheet.
-
Historical Data: This allows you to compare the current year’s performance with the same period from the previous year, helping to identify growth trends and areas for improvement.

Click to buy Performance Marketing KPI Dashboard in Google Sheets
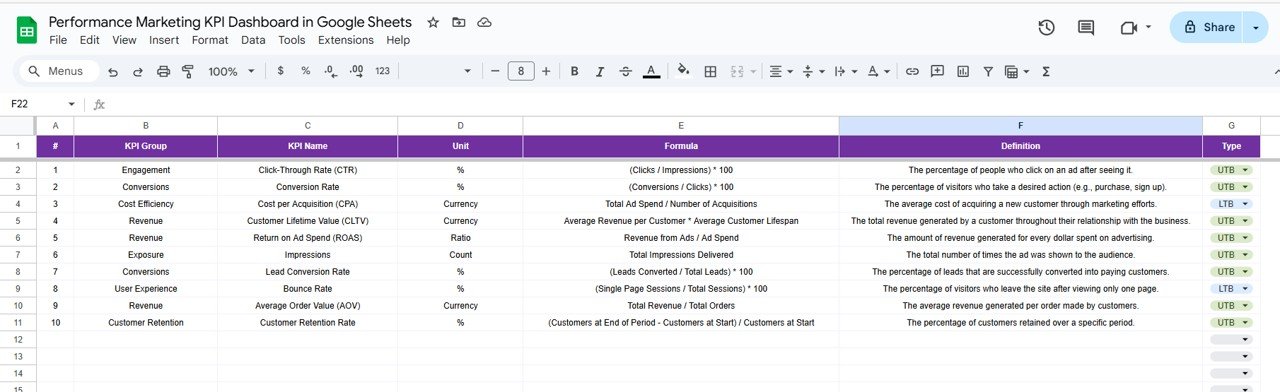
6. KPI Definition Sheet Tab
This sheet provides detailed information about each KPI.
-
KPI Name, Group, Unit: Each KPI’s name, group, and unit of measurement are listed.
-
Formula and Definition: This section describes how the KPI is calculated and why it’s important for your marketing campaigns.

Advantages of Using the Performance Marketing KPI Dashboard
The Performance Marketing KPI Dashboard offers several advantages:
-
Comprehensive Overview: Track all important KPIs in one place, ensuring you can quickly assess the health of your marketing campaigns.
-
Data-Driven Decisions: Use real-time data to make informed decisions and adjust your marketing strategies for better results.
-
Customizable: Tailor the dashboard to focus on the KPIs that matter most to your business.
-
Efficiency: Save time with automated updates and real-time performance tracking, reducing the need for manual reporting.
-
Comparison with Historical Data: Compare current performance against previous years to evaluate growth and identify trends.
Opportunity for Improvement in the Performance Marketing KPI Dashboard
Click to buy Performance Marketing KPI Dashboard in Google Sheets
While the Performance Marketing KPI Dashboard is effective, there are several areas where it can be improved:
- Automated Data Import: Integrate the dashboard with marketing platforms (Google Ads, Facebook Ads, etc.) to automatically pull data into the dashboard.
- Advanced Reporting: Add a feature for detailed reporting to export monthly or quarterly performance summaries.
- Mobile Accessibility: Making the dashboard mobile-friendly will enable on-the-go tracking and updates.
- Predictive Analytics: Implement forecasting features to predict future performance based on historical trends.
Best Practices for Using the Performance Marketing KPI Dashboard
To get the most out of the Performance Marketing KPI Dashboard, follow these best practices:
- Update Regularly: Keep your dashboard up-to-date by entering new data regularly, ensuring accurate insights.
- Set Realistic Targets: Ensure that the targets you set for each KPI are achievable and aligned with business goals.
- Monitor KPIs Continuously: Regularly check the dashboard to track performance trends and make timely adjustments to your marketing strategies.
- Use Data to Drive Strategy: Use the insights provided by the dashboard to optimize your marketing efforts and improve ROI.
- Share with Your Team: Share the dashboard with your marketing team and stakeholders to ensure everyone is aligned and informed.
Conclusion
Click to buy Performance Marketing KPI Dashboard in Google Sheets
The Performance Marketing KPI Dashboard in Google Sheets is an essential tool for marketers to monitor and optimize key metrics. By tracking KPIs like Conversion Rate, Customer Acquisition Cost, and ROAS, this dashboard helps marketers make informed decisions, improve campaign performance, and ultimately drive business growth.
Frequently Asked Questions (FAQs)
1. What KPIs can I track with the Performance Marketing KPI Dashboard?
You can track KPIs such as Conversion Rate, Customer Acquisition Cost, ROAS, Click-Through Rate, and more.
2. Can I customize the Performance Marketing KPI Dashboard?
Yes, the dashboard is fully customizable. You can add, remove, or modify KPIs to suit your specific marketing goals.
3. How often should I update the Performance Marketing KPI Dashboard?
It is recommended to update the dashboard regularly, at least once a month or when new data becomes available.
4. Can I integrate the dashboard with other marketing platforms?
Yes, you can integrate the dashboard with other tools to automate data imports and reduce manual data entry.
5. How can I use the Performance Marketing KPI Dashboard to improve marketing performance?
Use the data to identify trends, track performance against targets, and adjust your marketing strategy based on real-time insights.
Visit our YouTube channel to learn step-by-step video tutorials
Youtube.com/@NeotechNavigators
Watch the step-by-step video Demo:

Click to buy Performance Marketing KPI Dashboard in Google Sheets