
Renewable energy is a cornerstone of sustainability and climate change mitigation. The Renewable Energy KPI Dashboard in Google Sheets provides a practical, ready-to-use solution for tracking the key performance indicators (KPIs) that measure the performance of renewable energy initiatives. This dashboard helps organizations track energy generation, efficiency, cost, and environmental impact.
In this article, we will explore the Renewable Energy KPI Dashboard in Google Sheets, its key features, the KPIs it tracks, and how it can help organizations achieve better energy performance and sustainability goals.
Key Features of the Renewable Energy KPI Dashboard in Google Sheets
Below are the key features of this KPI dashboard template:
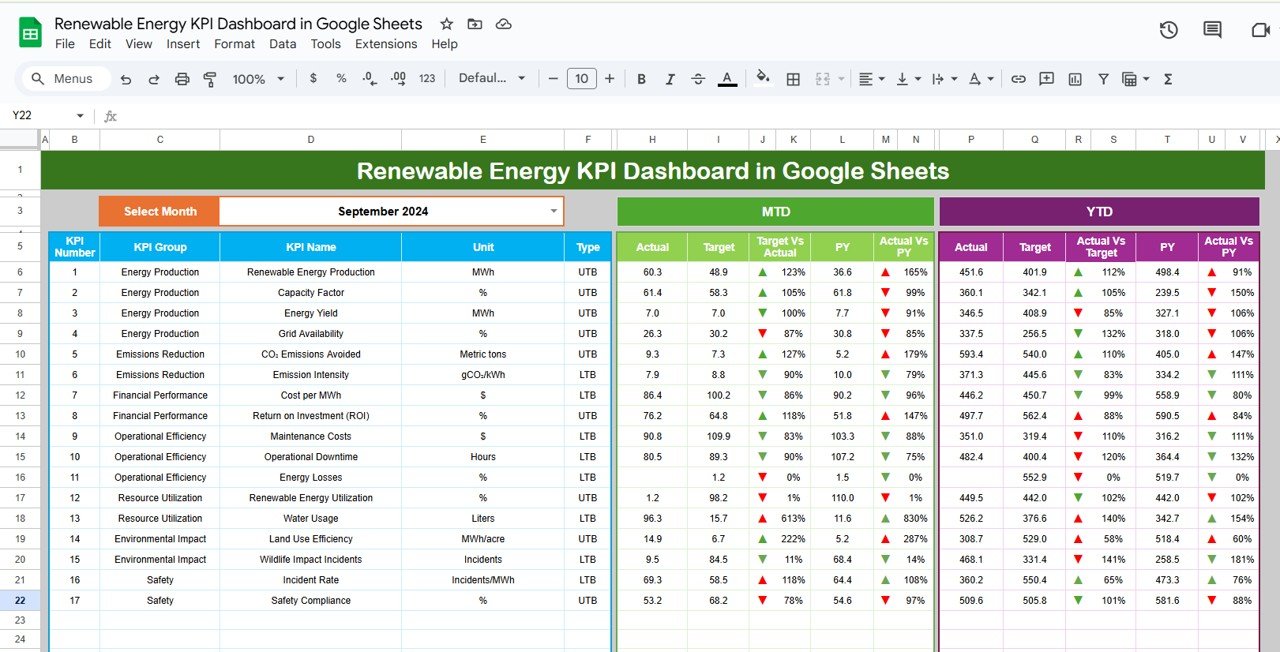
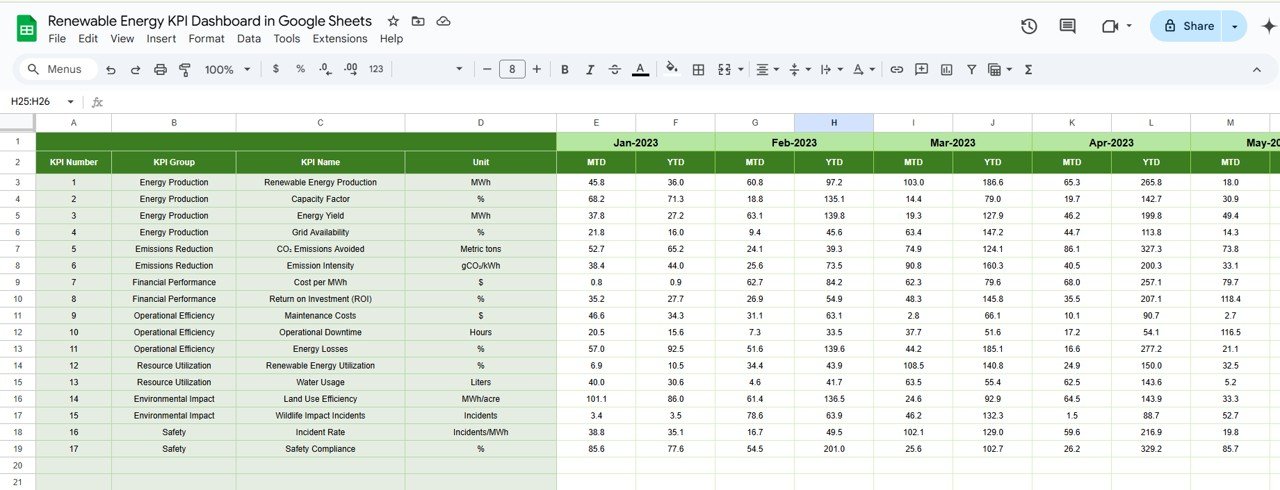
1. Dashboard Sheet Tab
This is the main sheet where all KPI data is displayed.
-
Month Selection: In Range D3, select the month from the drop-down menu, and the dashboard will update to show data for that month.
-
MTD (Month-to-Date): Displays actual numbers, target values, and comparisons with previous year data using conditional formatting (up or down arrows).
-
YTD (Year-to-Date): Shows cumulative performance with comparisons to target and previous year data.

Click to buy Renewable Energy KPI Dashboard in Google Sheets
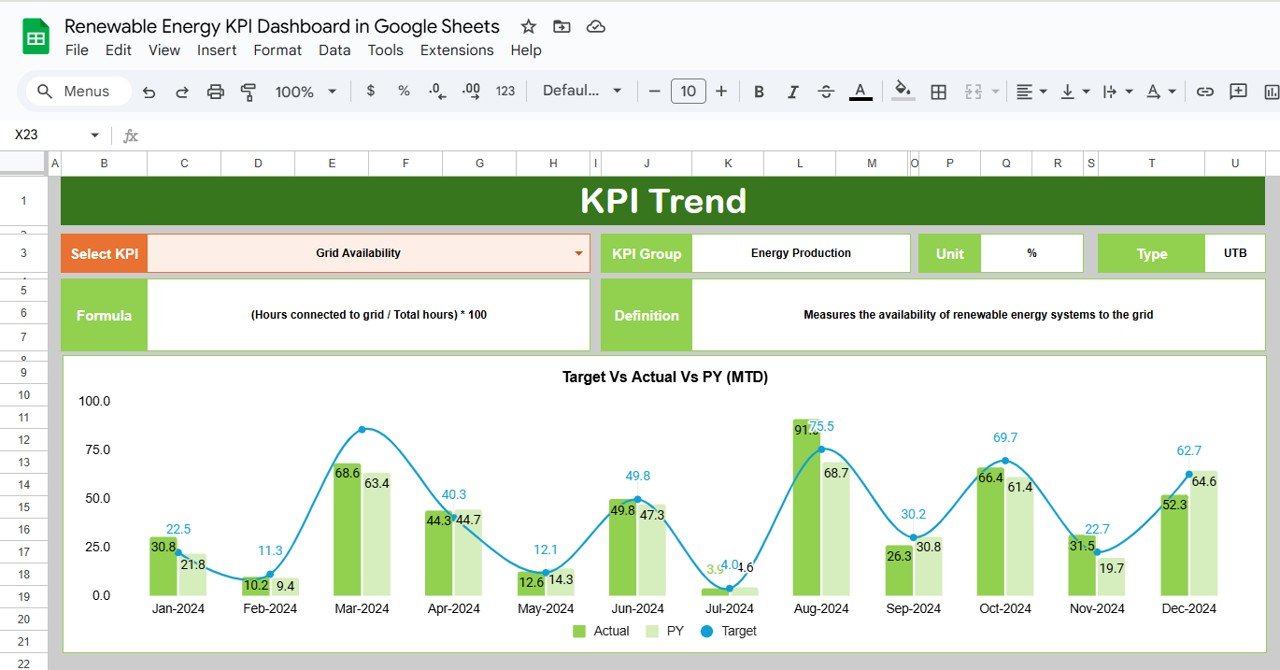
2. KPI Trend Sheet Tab
-
Select KPIs from the dropdown in Range C3.
-
Displays KPI group, unit of measure, type (Lower the Better or Upper the Better), formula, and KPI definition.

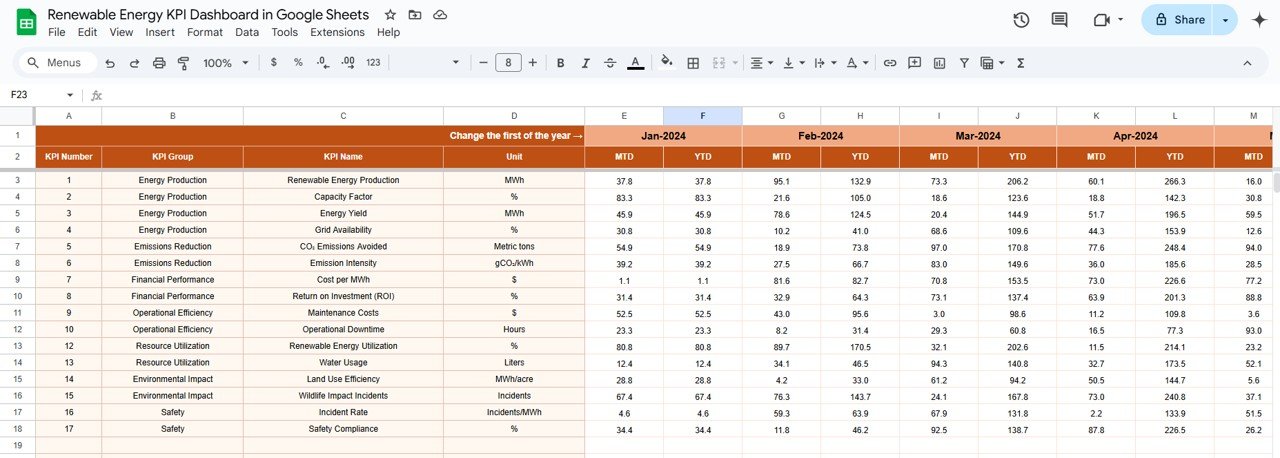
3. Actual Number Sheet Tab
-
Input actual numbers for MTD and YTD for the selected month.
-
The month selection is available in Range E1, where you input the first month of the year.

Click to buy Renewable Energy KPI Dashboard in Google Sheets
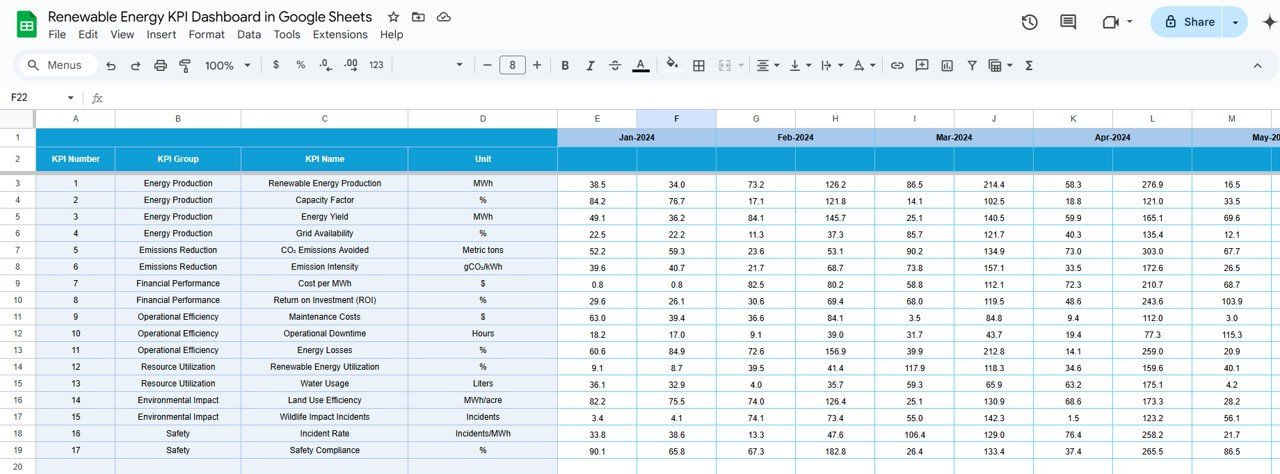
4. Target Sheet Tab
-
Enter target values for each KPI for MTD and YTD.
-
Helps track performance against the set goals.

5. Previous Year Number Sheet Tab
Click to buy Renewable Energy KPI Dashboard in Google Sheets
-
Enter previous year’s data to enable year-over-year comparisons.
-
This data should be entered in the same format as the current year to maintain consistency.

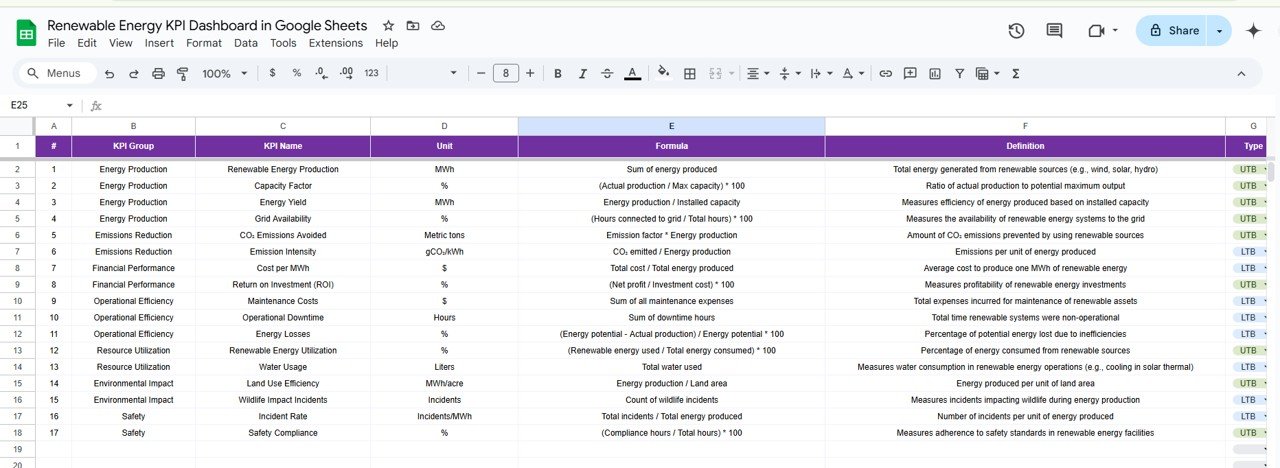
6. KPI Definition Sheet Tab
This sheet contains detailed information for each KPI, including:
- KPI Name
- KPI Group
- Unit of Measure
- Formula for KPI Calculation
- Definition of the KPI

Click to buy Renewable Energy KPI Dashboard in Google Sheets
Advantages of Using the Renewable Energy KPI Dashboard in Google Sheets
The Renewable Energy KPI Dashboard in Google Sheets offers several benefits to organizations:
-
Real-Time Data: Monitor and track key renewable energy metrics in real-time, allowing for quick decision-making and optimization.
-
Customizable: Easily adjust the dashboard to track KPIs specific to your organization’s renewable energy goals.
-
Cost-Effective: Google Sheets is a free tool, making it an affordable option for renewable energy projects and organizations.
-
Collaboration: Share the dashboard with team members and stakeholders to collaborate effectively and monitor performance.
-
Accessibility: The dashboard is accessible from any device with internet connectivity, making it easy to stay updated on performance at any time.
Opportunities for Improvement in the Renewable Energy KPI Dashboard
Click to buy Renewable Energy KPI Dashboard in Google Sheets
While the Renewable Energy KPI Dashboard in Google Sheets is an effective tool, there are opportunities for improvement:
Automating Data Entry:
- Current Challenge: Manual data entry can be time-consuming and error-prone.
- Opportunity: Integrating the dashboard with renewable energy monitoring systems can automate data entry and reduce errors.
Advanced Visualizations:
- Current Challenge: Basic visualizations may not offer comprehensive insights.
- Opportunity: Adding advanced visualizations such as interactive graphs, charts, and heatmaps could provide better insights into trends and performance.
Customizable Reporting:
- Current Challenge: Reporting features are basic.
- Opportunity: Expand the reporting capabilities to include customizable reports, such as automated PDF exports or email summaries.
Best Practices for Using the Renewable Energy KPI Dashboard
To get the most out of the Renewable Energy KPI Dashboard in Google Sheets, consider these best practices:
-
Update Regularly: Keep the data up to date to ensure accurate performance tracking and informed decision-making.
-
Set Realistic Targets: Use industry standards and historical data to set achievable KPIs.
-
Monitor Trends: Regularly review KPI trends to identify areas for improvement and optimize performance.
-
Collaborate Across Teams: Share the dashboard with relevant departments or stakeholders to improve communication and alignment on renewable energy goals.
-
Use Conditional Formatting: Leverage color-coding or arrows to quickly identify performance trends, such as increasing energy efficiency or reducing carbon emissions.
Conclusion
The Renewable Energy KPI Dashboard in Google Sheets is an invaluable tool for organizations looking to monitor and optimize their renewable energy initiatives. By tracking essential metrics like energy generation, cost efficiency, and carbon emissions, businesses can ensure they are making progress toward sustainability goals.
Frequently Asked Questions (FAQs)
Click to buy Renewable Energy KPI Dashboard in Google Sheets
What is a KPI in renewable energy?
A KPI (Key Performance Indicator) is a measurable value that helps track the success of renewable energy initiatives. Common KPIs include energy generation, cost per MWh, and emissions reductions.
How do I customize my Renewable Energy KPI Dashboard?
You can easily customize the dashboard by adding, removing, or adjusting KPIs, formulas, and data sources to match your renewable energy goals.
How do I enter data into the Renewable Energy KPI Dashboard?
Simply input actual numbers for MTD and YTD in the relevant sheets (Actual Numbers Sheet, Target Sheet, Previous Year Numbers Sheet) for each month.
Can I automate data entry?
Yes, you can integrate the dashboard with renewable energy monitoring systems to automate data entry and improve efficiency.
Which KPIs should I track in renewable energy?
Essential KPIs for renewable energy include energy generation, renewable energy share, carbon emissions reduced, and cost per MWh.
Visit our YouTube channel to learn step-by-step video tutorials
Youtube.com/@NeotechNavigators
Click to buy Renewable Energy KPI Dashboard in Google Sheets
Watch the step-by-step video Demo:
