

In today’s digital world, measuring social media performance is critical for businesses and influencers alike. One of the most efficient ways to track and analyze your social media metrics is by using a Social Media Performance Dashboard in Google Sheets. This powerful tool helps you monitor the impact of your posts, track audience engagement, and optimize your strategy.
In this article, we’ll guide you step by step on how to create a ready-to-use Social Media Performance Dashboard in Google Sheets. We’ll cover everything from setting up the dashboard to explaining the data and key metrics involved, as well as providing best practices for maximizing your results.
Click to buy Social Media Performance Dashboard in Google Sheets
What is a Social Media Performance Dashboard?
A Social Media Performance Dashboard is a consolidated tool that tracks key metrics related to social media campaigns, including followers, engagement rates, impressions, clicks, and more. The dashboard helps visualize these metrics, making it easier to monitor performance, compare platforms, and make data-driven decisions.
Creating such a dashboard in Google Sheets is incredibly useful, as it allows you to customize the metrics you track, analyze trends over time, and share the data with your team easily. With the help of charts and cards, the dashboard transforms raw data into insightful visualizations that can quickly highlight your social media success or areas needing improvement.
Components of the Social Media Performance Dashboard
In our example, we will work with a Google Sheets dashboard divided into three sections: Dashboard, Data, and Support Sheets. Each section serves a unique purpose in building an effective social media performance tracker.
1. Dashboard Section
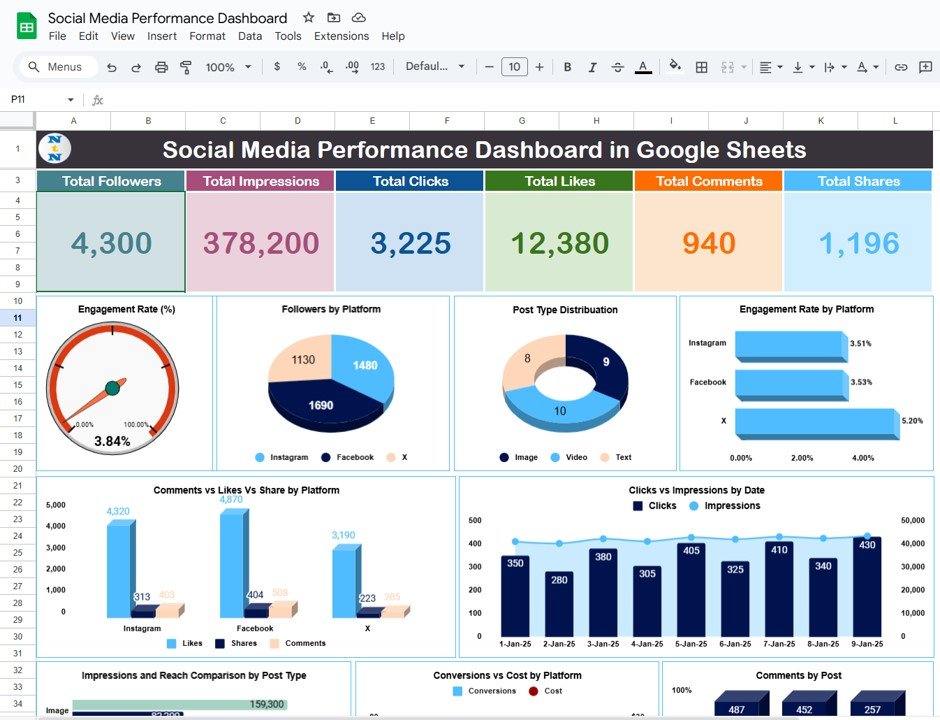
The Dashboard is where you’ll find visualizations of key social media metrics. It contains a mix of cards and charts that represent your performance at a glance. Let’s explore these in more detail:
Cards
- Total Followers: Displays the total number of followers across all platforms.
- Total Impressions: Shows the total number of times your content has been displayed to users.
- Total Clicks: Represents the number of clicks your posts have received.
- Total Likes: Displays the total number of likes your posts have garnered.
- Total Comments: Represents the number of comments made on your posts.
- Total Shares: Shows how often your posts have been shared.
Charts
The charts give you deeper insights into specific areas of social media performance. Here’s a breakdown of the charts included in our dashboard:
Click to buy Social Media Performance Dashboard in Google Sheets
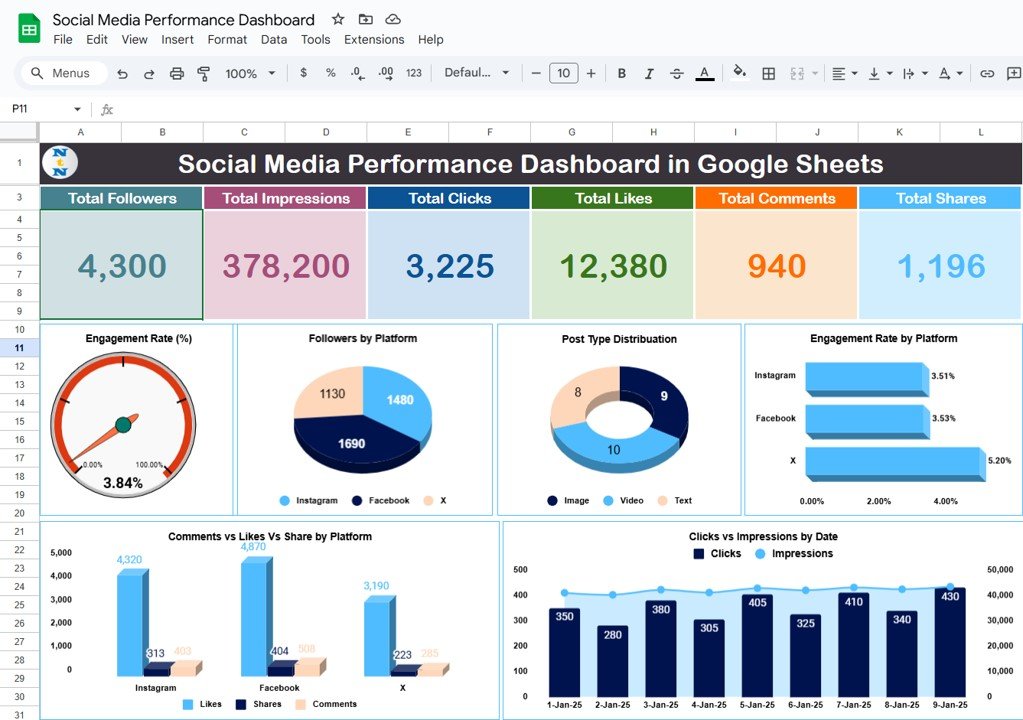
- Engagement Rate (%): A gauge chart to visualize your overall engagement rate, which reflects how much interaction your posts are generating relative to your audience size.
- Followers by Platform: A pie chart that breaks down your total followers by each platform (e.g., Instagram, Facebook, X).
- Post Type Distribution: A donut chart that illustrates how different types of posts (images, videos, text) contribute to your overall social media engagement.
- Engagement Rate by Platform: A bar chart that compares engagement rates across various platforms.
- Comments vs Likes vs Shares by Platform: A column chart showing how comments, likes, and shares vary between platforms.
- Clicks vs Impressions by Date: A combo chart that tracks the relationship between clicks and impressions over time.
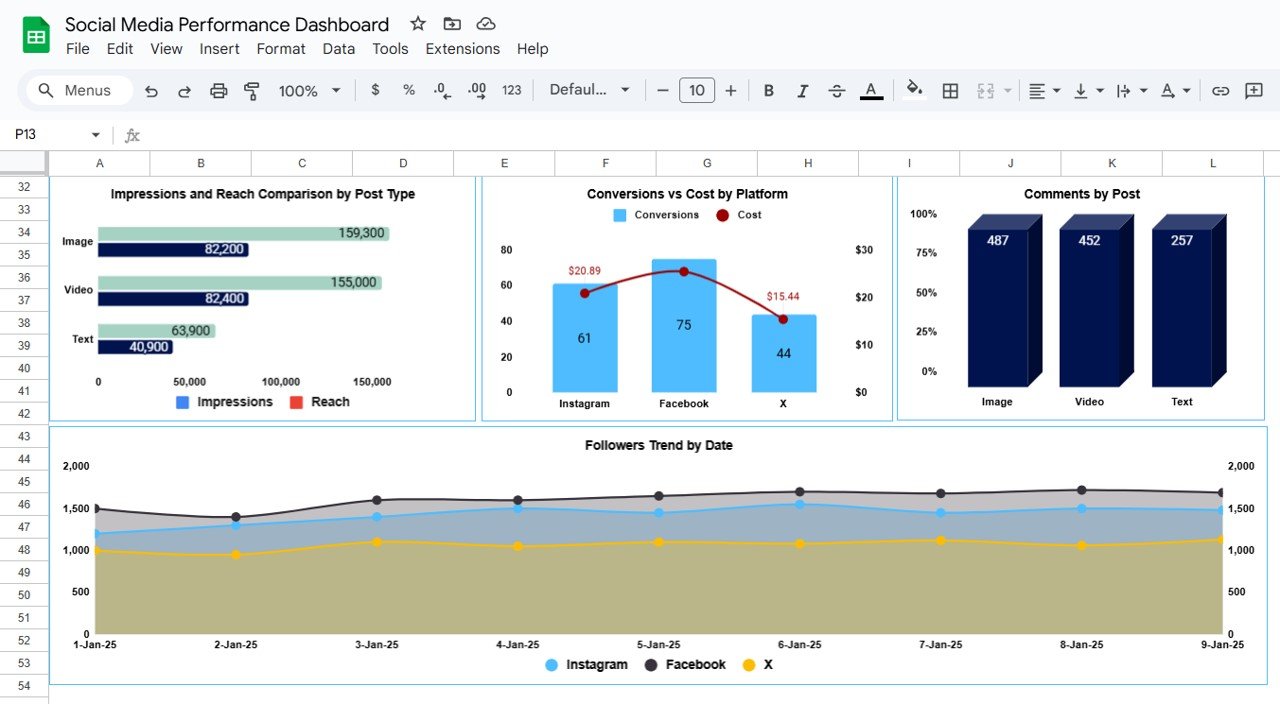
- Impressions and Reach Comparison by Post Type: A bar chart comparing impressions and reach for different post types.
- Conversions vs Cost by Platform: A combo chart comparing conversions and costs for each platform.
- Comments by Post: A column chart showing the number of comments for each post.
- Followers Trend by Date: An area chart showing how followers change over time.

Click to buy Social Media Performance Dashboard in Google Sheets

2. Data Section
Click to buy Social Media Performance Dashboard in Google Sheets
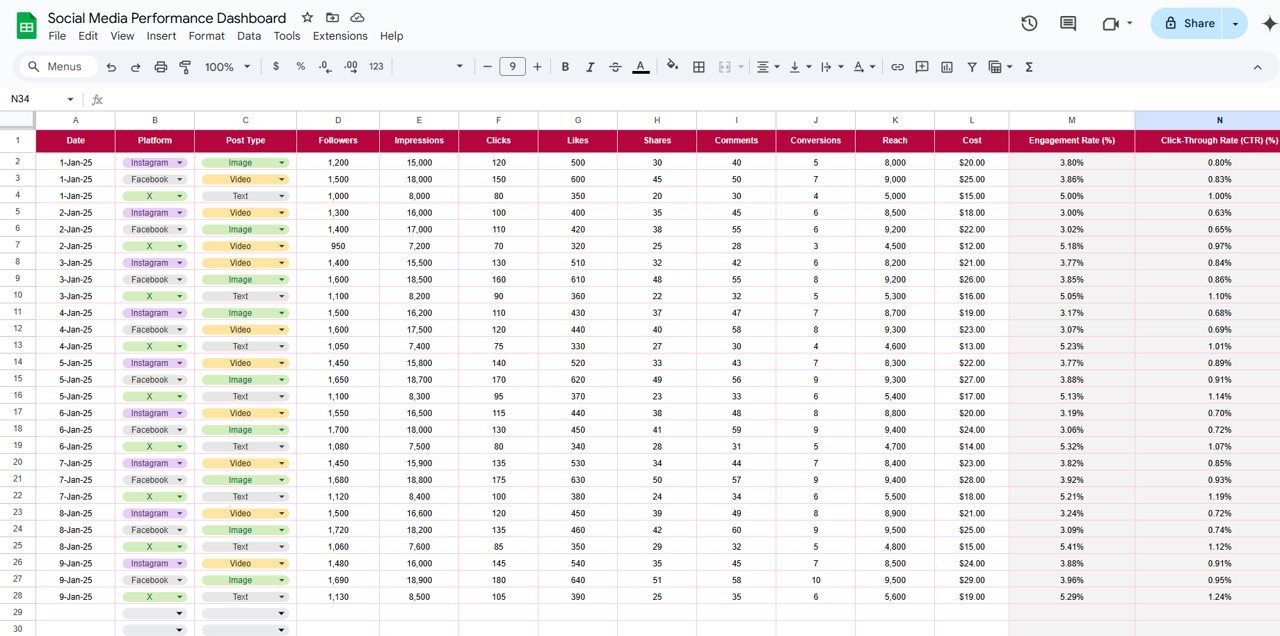
The Data section in the Google Sheets dashboard is where you enter and store your raw data. You’ll need to track the following information for each post:
This section tracks daily data for each platform, post type, and key metrics. The Engagement Rate (%) and Click-Through Rate (CTR) are calculated based on the following formulas:
- Engagement Rate (%) = (Likes + Comments + Shares) / Followers * 100
- Click-Through Rate (CTR) (%) = Clicks / Impressions * 100

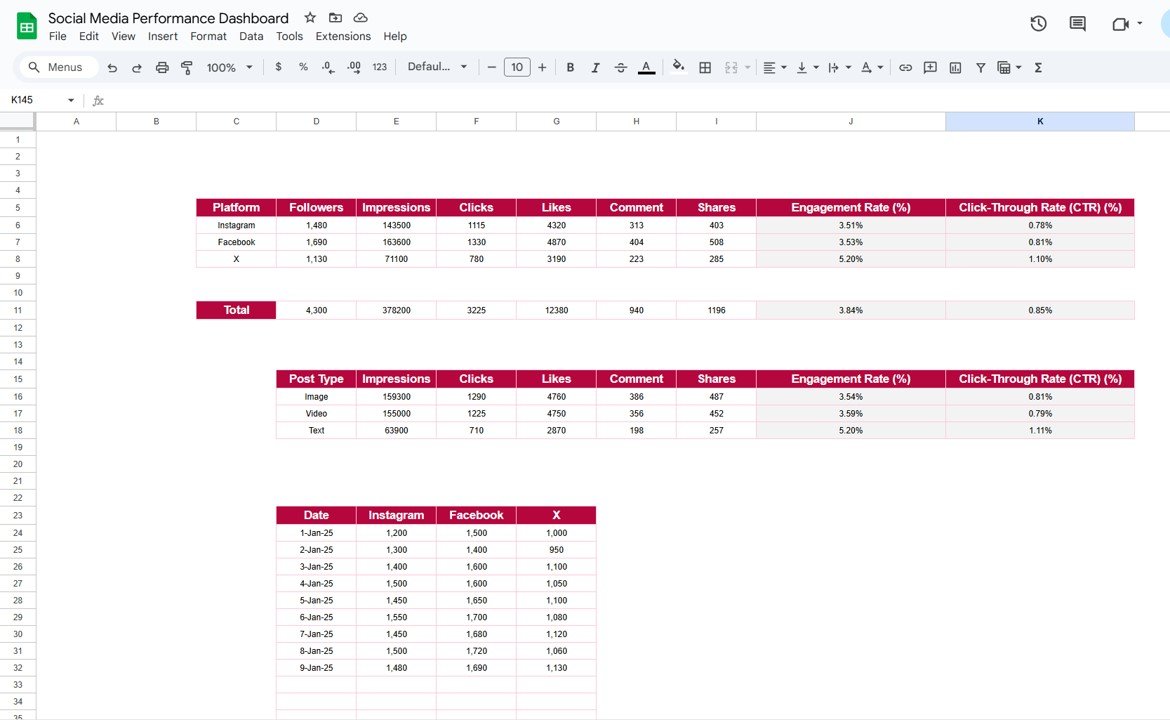
3. Support Sheets
Click to buy Social Media Performance Dashboard in Google Sheets
The Support Sheets are where you’ll store the summarized data from different platforms and post types. These sheets allow you to calculate total followers, impressions, clicks, likes, and other key metrics. Below is an example of data from Instagram, Facebook, and X (formerly known as Twitter)

Advantages of Social Media Performance Dashboards
Click to buy Social Media Performance Dashboard in Google Sheets
Using a Social Media Performance Dashboard in Google Sheets offers numerous advantages. Here are a few key benefits:
- Centralized Tracking: All your social media data is collected in one place, making it easier to analyze performance across different platforms. This saves you time and effort compared to managing separate reports for each social media network.
- Customizability: Google Sheets is highly customizable, allowing you to tailor the dashboard to fit your specific needs. You can add new metrics, change visualizations, or adjust the layout as your social media strategy evolves.
- Real-Time Updates: By linking your dashboard with live data, you can keep track of your social media performance in real time. This makes it easier to monitor trends and adjust strategies quickly.
- Data-Driven Decision Making: The clear visualizations and insights offered by the dashboard help you make informed decisions. Whether you’re analyzing which platform is driving the most traffic or determining which content type generates the most engagement, your data is at your fingertips.
Opportunities to Improve Your Social Media Performance
While having a Social Media Performance Dashboard is great, it’s important to consistently look for opportunities to improve your performance:
- Refining Post Timing: By analyzing trends in engagement rates, you can identify the best times to post on each platform. This helps you reach your audience when they are most active, boosting engagement.
- Content Optimization: If your dashboard shows that certain types of posts (e.g., images, videos, or text) perform better, you can focus more on that content type. Understanding your audience’s preferences allows you to create more relevant and engaging content.
- Cross-Platform Promotion: If you see that one platform is outperforming others, you can promote your posts on underperforming platforms. Cross-promoting content can increase your reach and engagement across multiple channels.
Best Practices for Creating a Social Media Performance Dashboard
To ensure your dashboard is effective and useful, follow these best practices:
- Define Clear Metrics: Identify the most relevant metrics for your goals. Whether it’s engagement rate, click-through rate, or conversions, choose the KPIs that align with your social media objectives.
- Update Regularly: Keep your dashboard up to date by inputting data regularly. Regular updates ensure that the dashboard remains a valuable tool for monitoring and analyzing performance.
- Use Data Visualization Effectively: Make use of charts, graphs, and cards to present data in a clear, visually appealing way. A well-designed dashboard should make complex data easy to understand at a glance.
- Automate Data Collection: Whenever possible, automate the process of collecting data from your social media platforms. Use Google Sheets integrations with other tools or APIs to fetch data automatically, reducing manual entry errors.
Conclusion
Click to buy Social Media Performance Dashboard in Google Sheets
A Social Media Performance Dashboard in Google Sheets is a powerful tool that helps businesses and influencers track and optimize their social media campaigns. With the ability to visualize key metrics such as engagement rates, impressions, and clicks, the dashboard allows you to make data-driven decisions and continuously improve your strategy. By following the best practices outlined above and leveraging the advantages of using Google Sheets, you can create a performance tracker that suits your needs and drives better results.
Frequently Asked Questions (FAQs)
Q1: How can I integrate data from multiple social media platforms into one dashboard?
You can integrate data manually by entering it into your Google Sheets or use automated tools like Google Analytics or third-party APIs to pull in data directly from your social media accounts.
Q2: What are the key metrics I should track in a Social Media Performance Dashboard?
Some of the most important metrics to track include Total Followers, Impressions, Clicks, Likes, Comments, Engagement Rate, Click-Through Rate (CTR), and Conversions.
Q3: Can I customize the Social Media Performance Dashboard for specific social media platforms?
Yes, Google Sheets allows you to fully customize your dashboard. You can add new platforms, modify the visualizations, and adjust metrics as needed to suit your business objectives.
Q4: How often should I update my Social Media Performance Dashboard?
To keep your data accurate and up-to-date, you should update your dashboard regularly. Daily or weekly updates are recommended for businesses that need to monitor performance frequently.
Q5: Can I share the Social Media Performance Dashboard with my team?
Yes, Google Sheets makes it easy to share the dashboard with your team. You can grant view or edit access, allowing your team to collaborate and stay aligned on performance tracking.
Visit our YouTube channel to learn step-by-step video tutorials
Youtube.com/@NeotechNavigators
Watch the step-by-step video tutorial:
