Space exploration has always been at the forefront of human ingenuity, pushing the boundaries of technology and innovation. With advancements in space missions, satellite launches, and interplanetary exploration, tracking performance through key performance indicators (KPIs) has become crucial for organizations in the space sector. The Space Exploration KPI Dashboard in Google Sheets is a tool designed to track, visualize, and analyze key metrics to evaluate the performance of various space-related projects.
What is the Space Exploration KPI Dashboard?
The Space Exploration KPI Dashboard in Google Sheets is an interactive tool designed to help space agencies and companies monitor the progress of their space exploration initiatives. By tracking important metrics such as satellite launches, mission success rates, and cost efficiency, this dashboard provides essential insights to improve performance and decision-making.
Key Features of the Space Exploration KPI Dashboard
The Space Exploration KPI Dashboard comes with multiple worksheets, each focusing on a different aspect of the space exploration process. Below are the key features of each sheet:
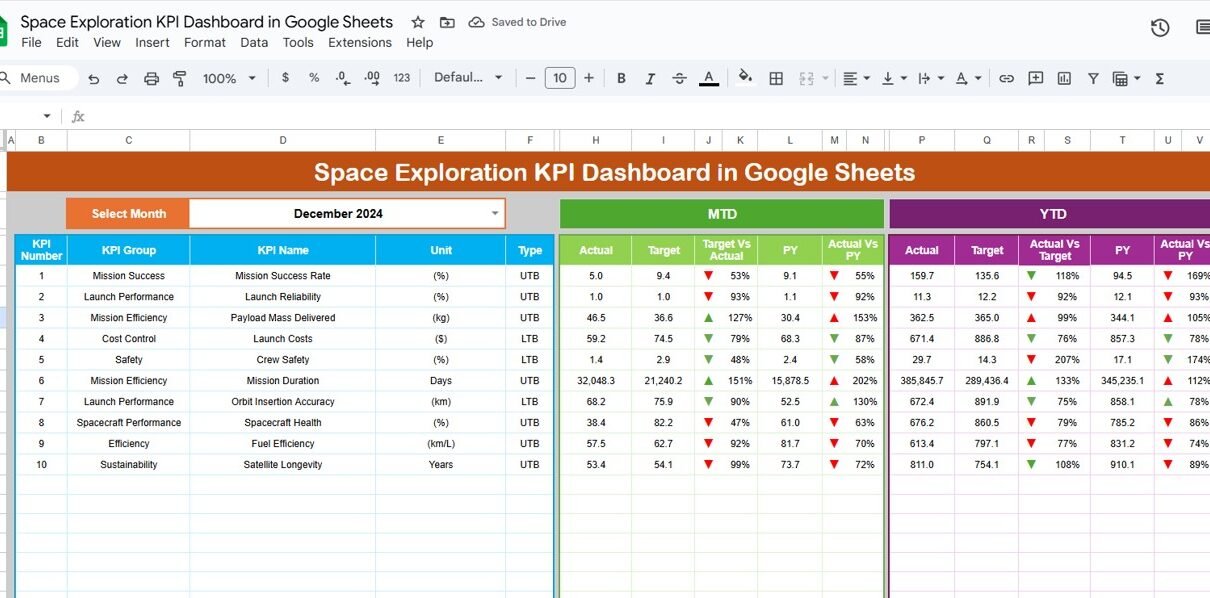
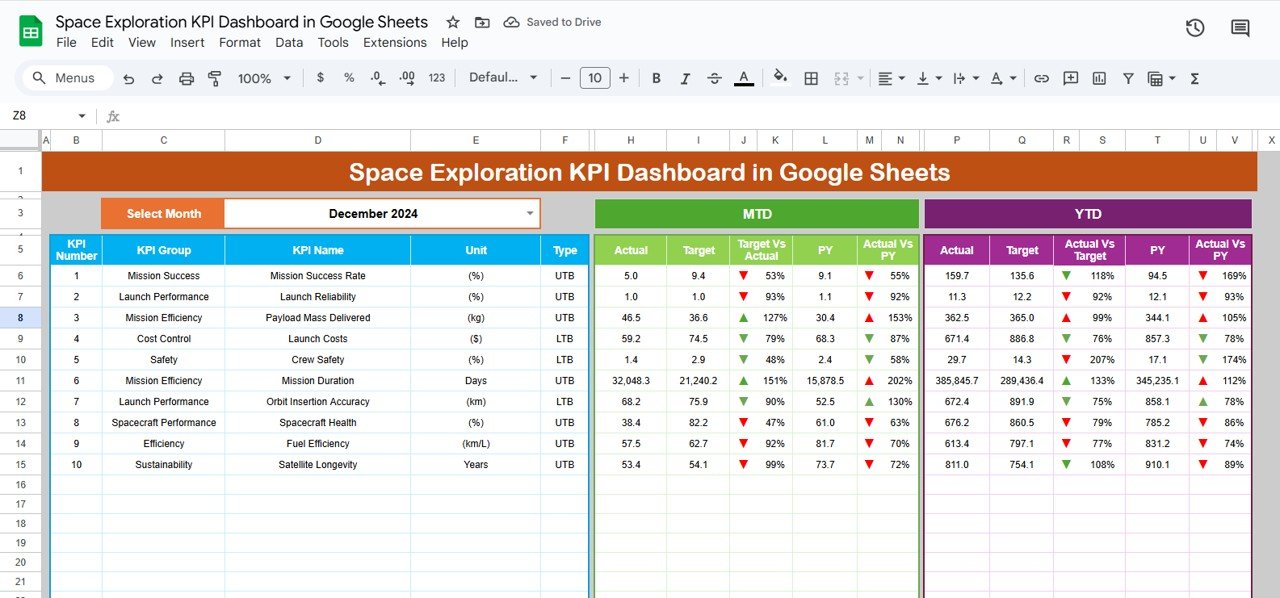
1. Dashboard Sheet Tab
The Dashboard sheet serves as the main interface where all KPIs are displayed. Here, users can:
-
Select the Month: Choose the month from a dropdown in Range D3, and the entire dashboard will update accordingly.
-
MTD (Month-to-Date) and YTD (Year-to-Date) Data: View the actual values for MTD and YTD, along with the corresponding targets and previous year data.
-
Target vs. Actual and Previous Year vs. Actual: Track how current performance compares to the set targets and the previous year’s data with conditional formatting (up/down arrows).
Click to buy Space Exploration KPI Dashboard in Google Sheets
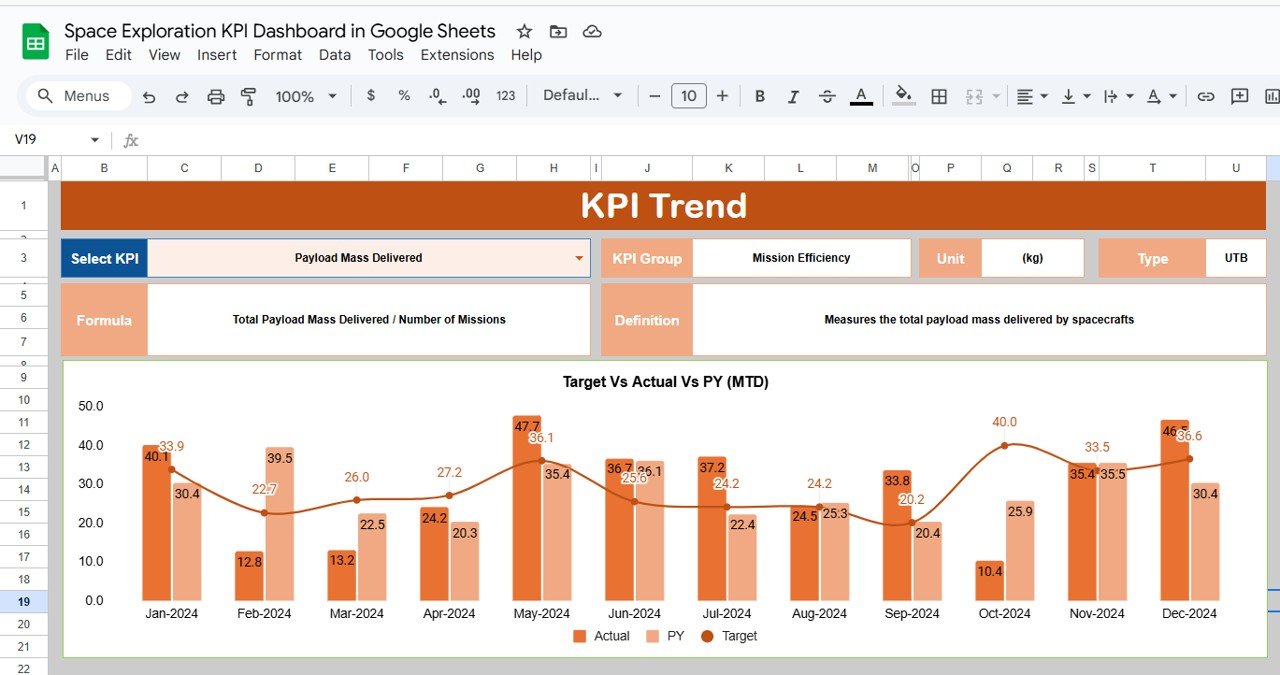
2. KPI Trend Sheet Tab
The KPI Trend sheet allows you to view the historical performance of selected KPIs. Here you can:
-
Select the KPI from a dropdown in Range C3.
-
View the KPI Group, Unit of KPI, and the KPI Type (whether “Lower the Better” or “Upper the Better”).
-
See the Formula and Definition for each KPI.
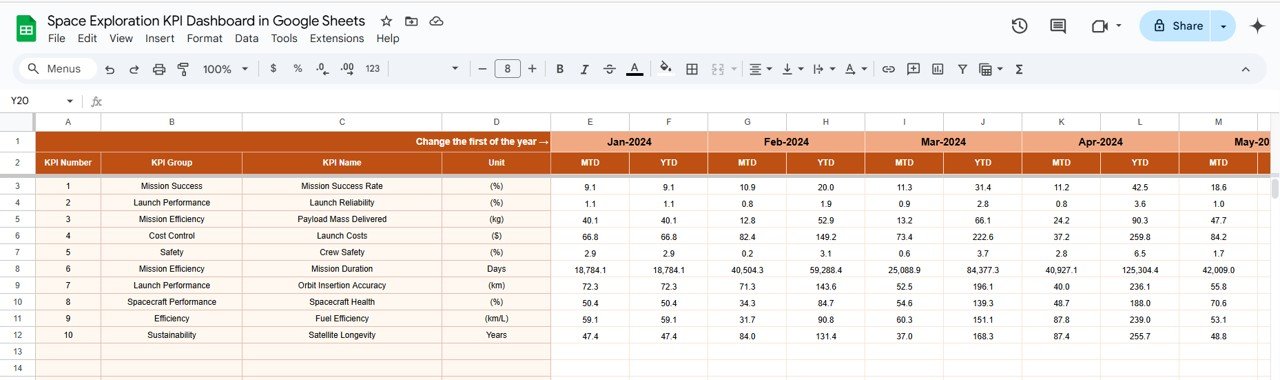
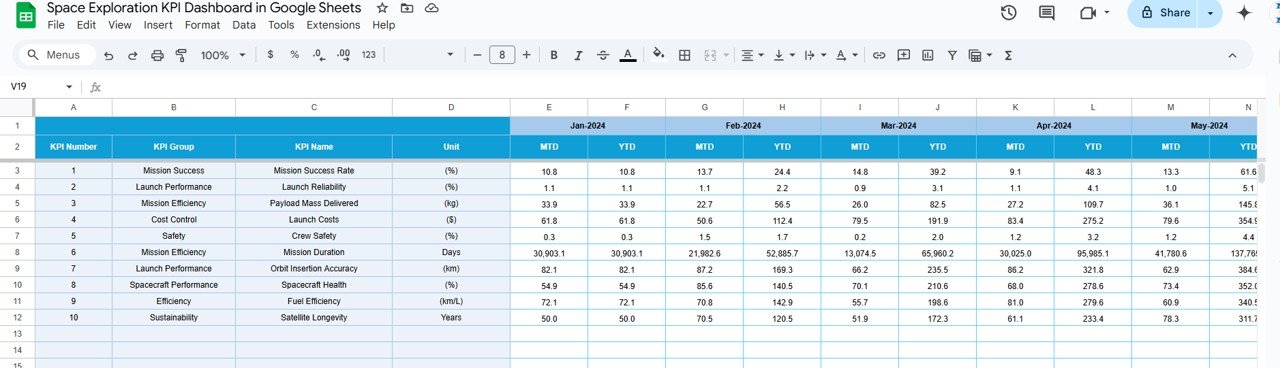
3. Actual Number Sheet Tab
The Actual Number sheet is where you input the actual data for the YTD and MTD. The dashboard will automatically update based on the information entered here. Users can change the month from Range E1, allowing flexibility in entering data for any given month.
4. Target Sheet Tab
Click to buy Space Exploration KPI Dashboard in Google Sheets
The Target Sheet is where you enter the target numbers for each KPI for the particular month. This data will help compare the actual performance with the target performance for better analysis.
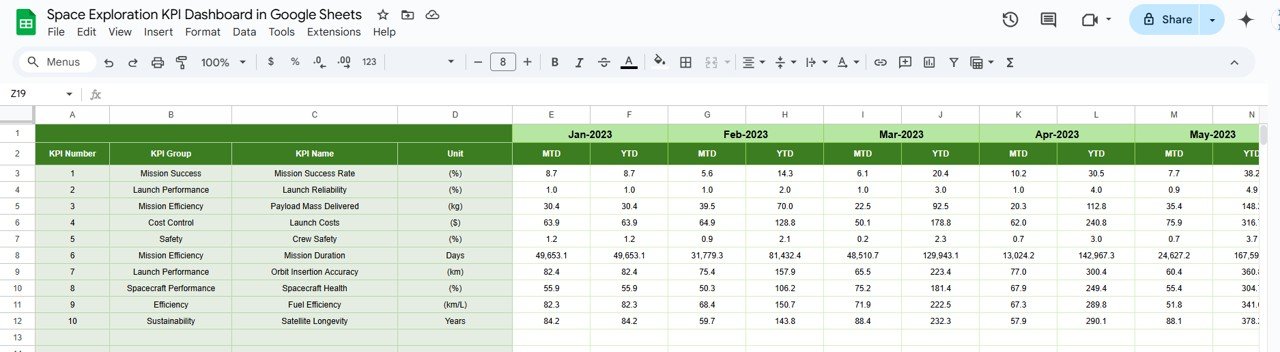
5. Previous Year Number Sheet Tab
This sheet allows users to input the previous year’s data for each KPI. This is essential for comparing the performance of the current year against the previous year to evaluate progress and trends.
Click to buy Space Exploration KPI Dashboard in Google Sheets
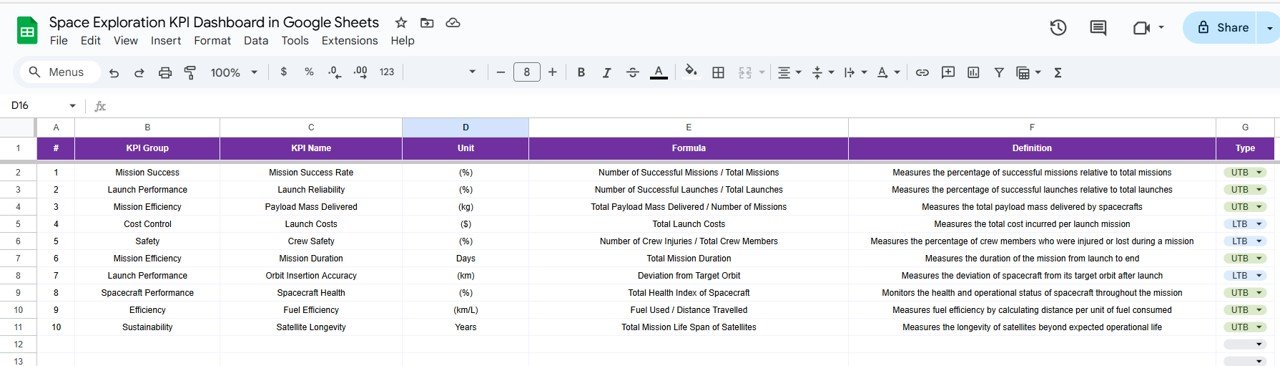
6. KPI Definition Sheet Tab
The KPI Definition Sheet helps define each KPI in detail, including:
-
KPI Name: The name of the key performance indicator.
-
KPI Group: The category to which the KPI belongs (e.g., mission success, cost efficiency).
-
Unit: The unit of measurement for the KPI (e.g., percentage, number of satellites).
-
Formula: The formula used to calculate the KPI.
-
Definition: A brief explanation of the KPI
Advantages of Using the Space Exploration KPI Dashboard
Click to buy Space Exploration KPI Dashboard in Google Sheets
Using the Space Exploration KPI Dashboard offers several benefits:
-
Data-Driven Decisions: With accurate data at your fingertips, decision-makers can easily evaluate the performance of various space missions and allocate resources effectively.
-
Monitor Progress Over Time: The historical trend analysis allows organizations to track progress and identify areas of improvement.
-
Cost Efficiency: By tracking metrics like cost per launch and fuel efficiency, organizations can find ways to reduce costs and improve financial performance.
-
Mission Success Evaluation: Track mission success rates to determine the effectiveness of space exploration efforts and enhance future missions.
Best Practices for Using the Space Exploration KPI Dashboard
Here are some best practices to follow when using the Space Exploration KPI Dashboard:
-
Update Data Regularly: Ensure that the data is updated monthly to maintain the accuracy and relevance of the insights.
-
Set Realistic Targets: Set challenging but achievable targets based on historical performance to drive continuous improvement.
-
Analyze Trends: Use the KPI trend sheet to analyze historical data and spot any emerging patterns or issues.
-
Collaborate Across Teams: Share the dashboard with different teams (e.g., finance, operations, mission planning) to ensure alignment on performance goals.
-
Monitor Fuel and Cost Efficiency: Regularly review metrics like fuel efficiency and cost per launch to identify opportunities for cost-saving.
Conclusion
Click to buy Space Exploration KPI Dashboard in Google Sheets
The Space Exploration KPI Dashboard in Google Sheets is an invaluable tool for organizations involved in space missions and exploration. By tracking essential metrics such as mission success rates, cost efficiency, and spacecraft reliability, the dashboard enables data-driven decisions and provides a comprehensive overview of performance. Whether you are managing a satellite launch, tracking mission outcomes, or optimizing operational costs, this dashboard offers all the insights you need to ensure the success of your space exploration projects.
Frequently Asked Questions (FAQs)
1. How do I enter data into the Space Exploration KPI Dashboard?
Data is entered into the Actual Number Sheet for MTD and YTD data, and Target data is entered into the Target Sheet for each KPI.
2. Can I customize the KPIs in the dashboard?
Yes, the Space Exploration KPI Dashboard is customizable. You can add new KPIs, adjust formulas, and modify the layout to suit your specific needs.
3. How can the KPI trend sheet help me analyze performance?
The KPI Trend Sheet allows you to view historical performance data, helping you track improvements and identify areas that need attention.
4. What is the significance of the “Target vs Actual” and “Previous Year vs Actual” comparisons?
These comparisons help evaluate how well the current year’s performance aligns with set targets and how it compares to the previous year’s performance.
5. Can I use this dashboard for different types of space exploration projects?
Yes, the dashboard is flexible and can be adapted to various space exploration projects, from satellite launches to interplanetary missions.
Visit our YouTube channel to learn step-by-step video tutorials
Youtube.com/@NeotechNavigators
Watch the step-by-step video Demo:
Click to buy Space Exploration KPI Dashboard in Google Sheets

