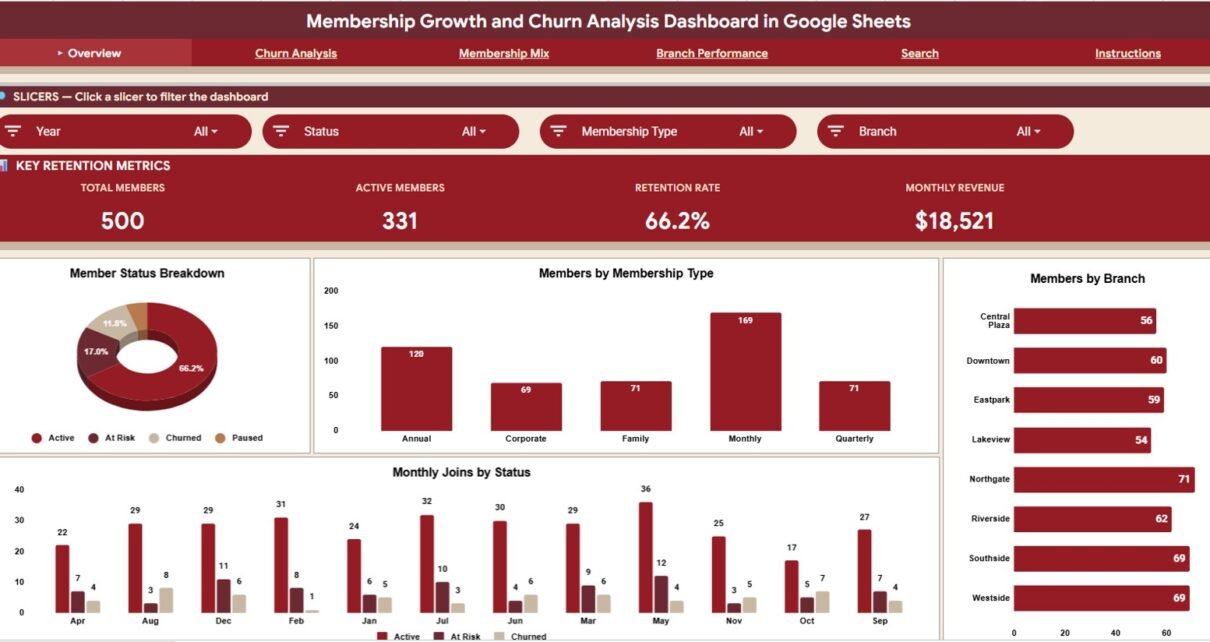
Membership Growth and Churn Analysis Dashboard in Google Sheets tracks members, retention, churn, revenue, branches and member search. $9.99.
Online Tutorial for Data Analysis and Automation
Membership Growth and Churn Analysis Dashboard in Google Sheets tracks members, retention, churn, revenue, branches and member search. $9.99.
Track mutual fund portfolio value, SIP status, invested value, current value, monthly SIP contribution, and dropdown reference lists in Google Sheets.
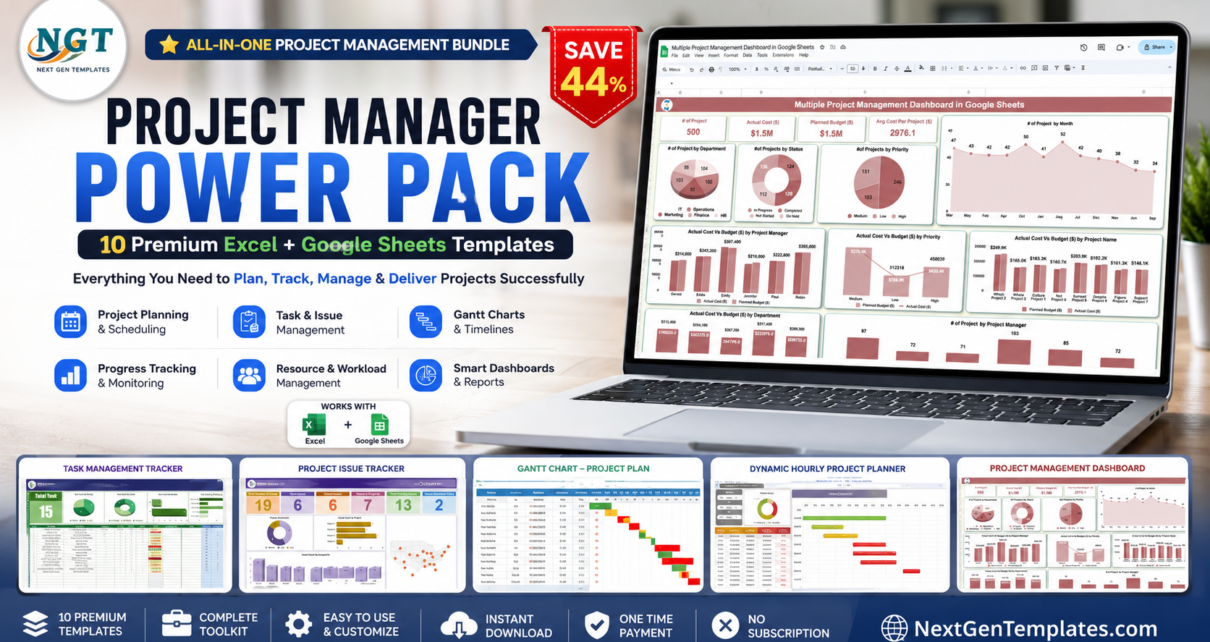
The Project Manager Power Pack bundles 10 premium Excel and Google Sheets project management templates — Gantt charts, dashboards, task trackers and issue logs — for $48.99 instead of $86.90, a 44% saving.
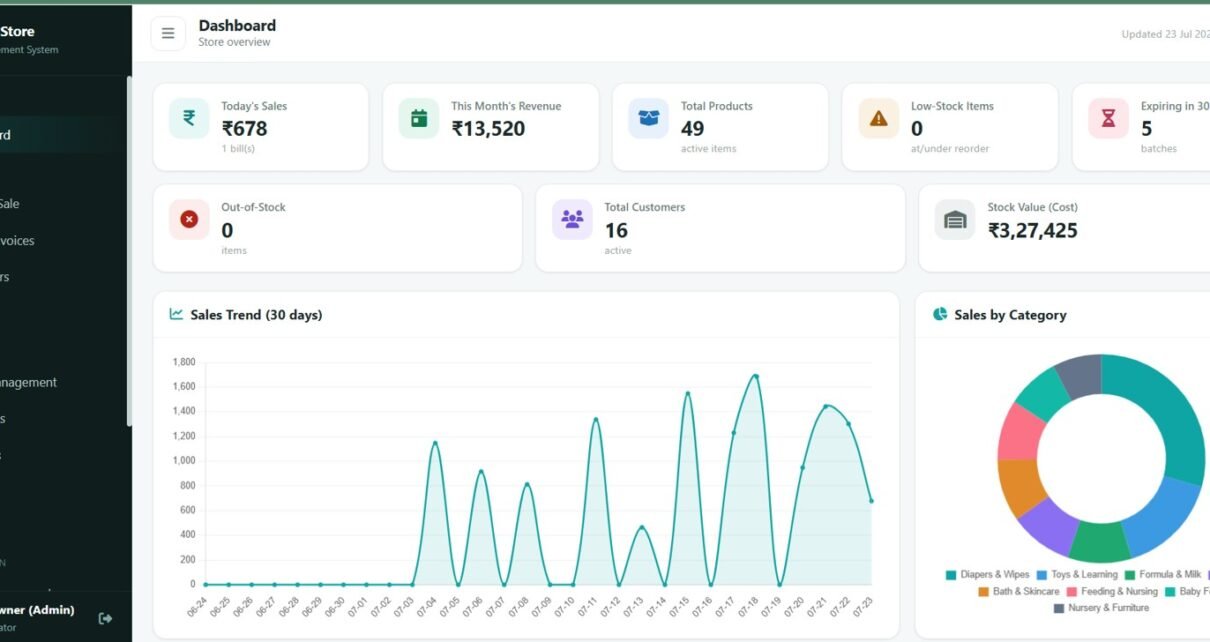
The Baby Products Store Management System is a Google Apps Script POS and inventory web app for baby stores — billing, batch expiry (FEFO), GST invoices, loyalty and reports, with role-based access for Admin, Store Manager and Cashier.
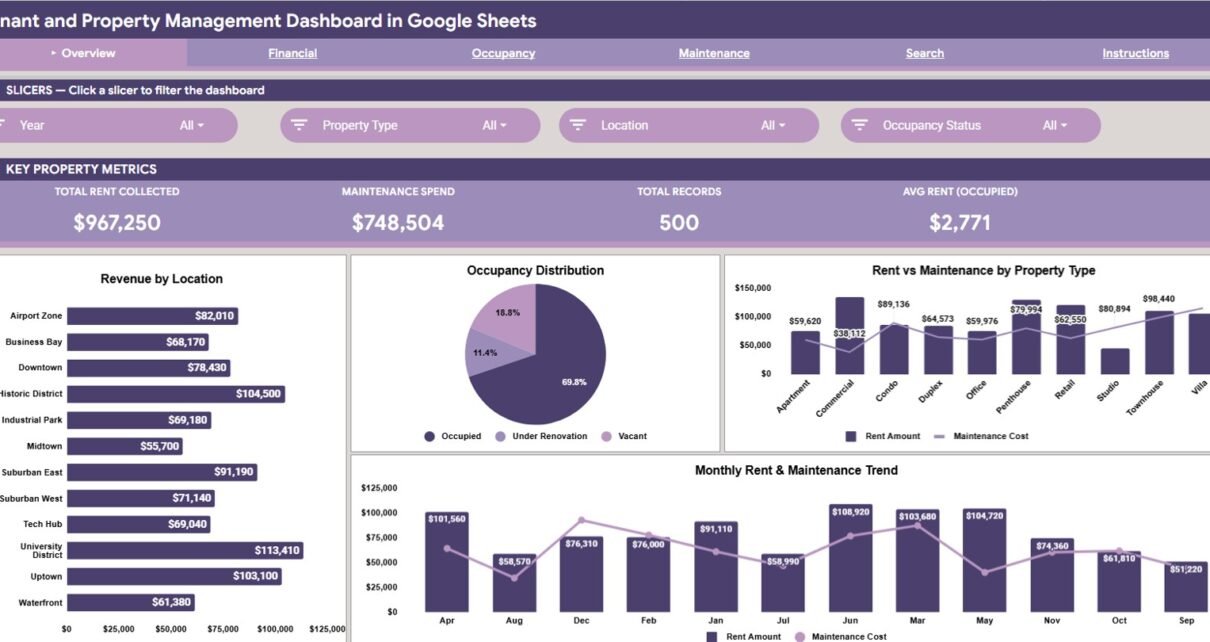
The Tenant and Property Management Dashboard in Google Sheets tracks 4 KPI cards and 15 charts across 6 linked sheets covering rent collection, occupancy status, maintenance spend and lease end dates. Setup takes under 10 minutes.
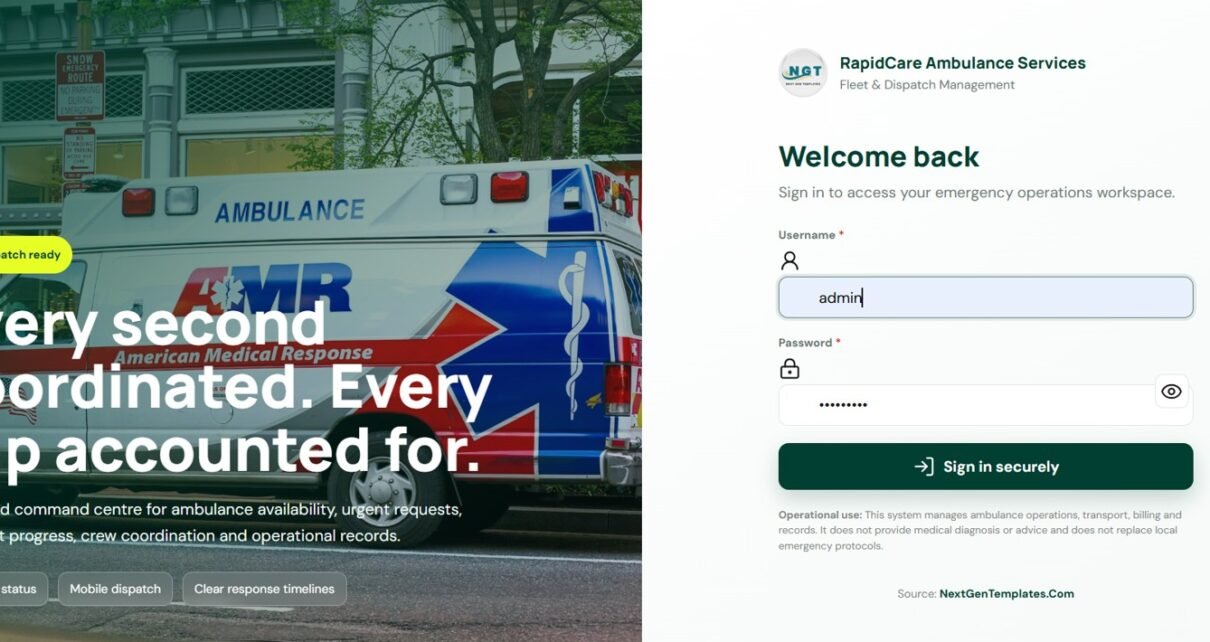
Manage ambulance emergency requests, live dispatch, vehicles, crew, trips, billing, reports, documents and archives with a Google Apps Script web app template.
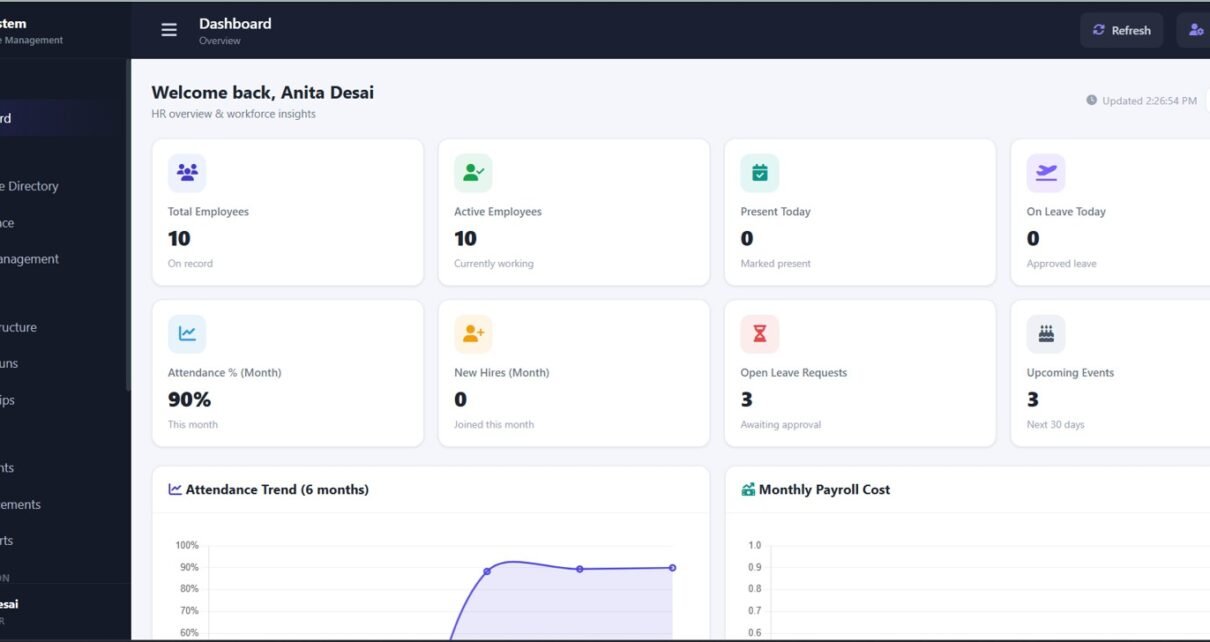
HR Employee Management System Web App for employee records, attendance, leave, payroll, payslips, documents, reports, settings, archive and audit logs.
Track fuel cost, fill-ups, mileage, fuel types, driver names, statuses, and km/L efficiency with this Fleet Fuel and Mileage Tracker in Google Sheets.
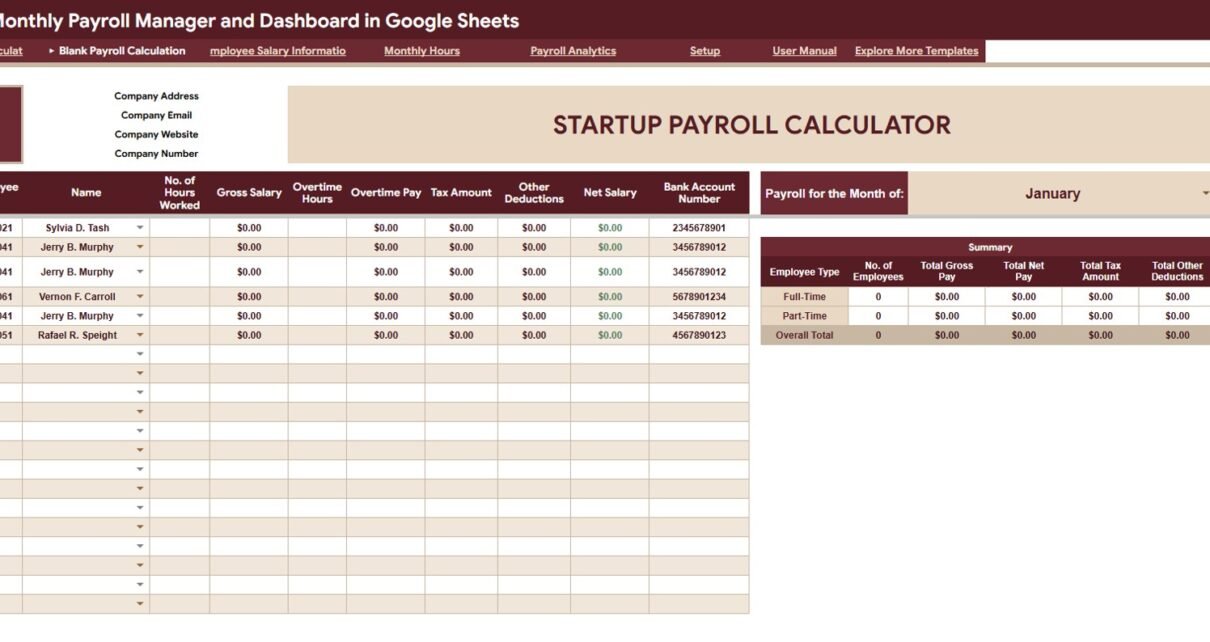
Monthly Payroll Manager and Dashboard in Google Sheets for gross pay, net pay, tax, deductions, overtime, monthly hours and employee salary analytics.
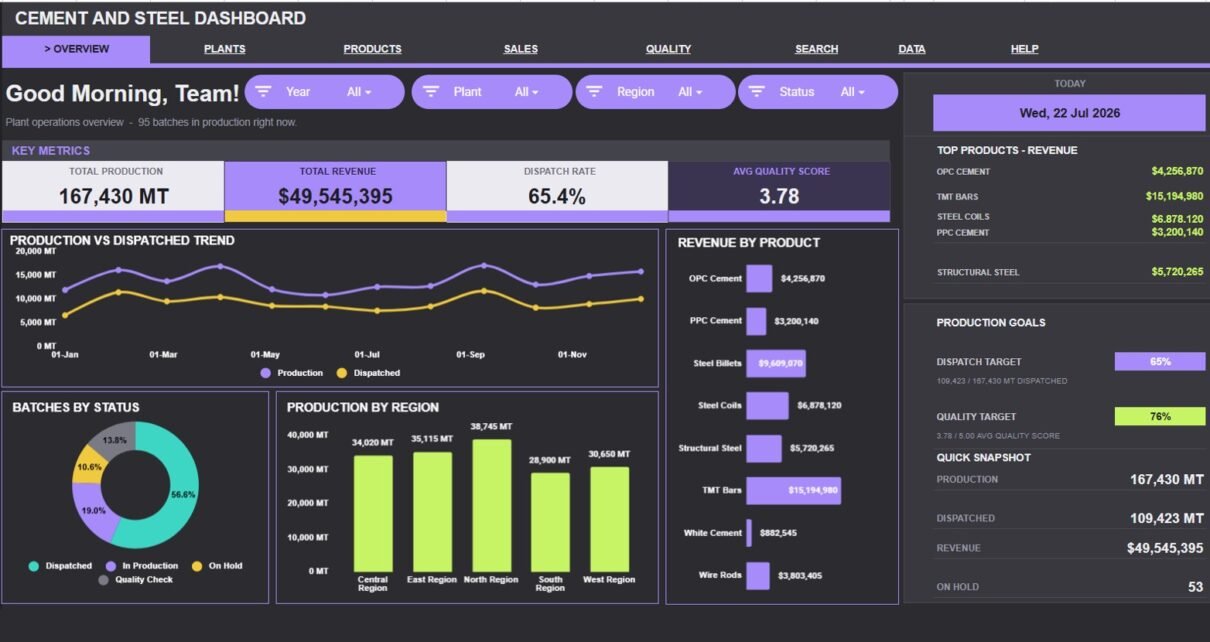
Review the Cement and Steel Dashboard in Google Sheets: seven tabs, four KPI cards, twenty chart views, slicers, Batch ID lookup, and editable data sheet for cement and steel teams.