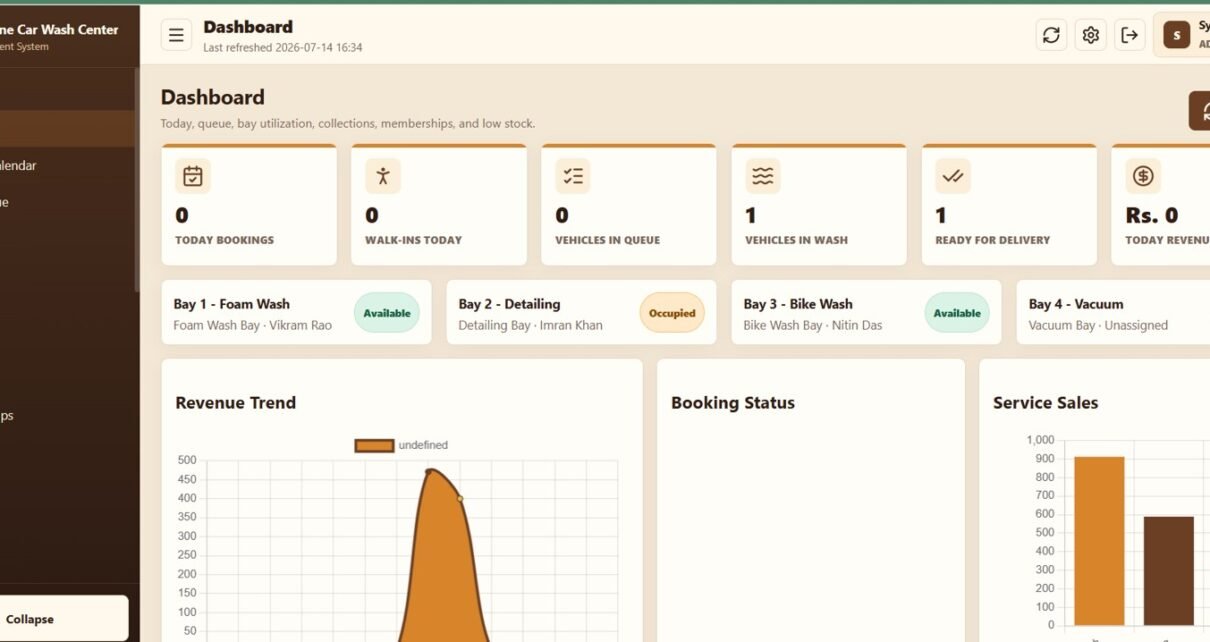
Explore the Car Wash Management System Web App across 24 connected screens for bookings, wash queues, job cards, billing, memberships, inventory, reports, users, and settings.
Online Tutorial for Data Analysis and Automation
Explore the Car Wash Management System Web App across 24 connected screens for bookings, wash queues, job cards, billing, memberships, inventory, reports, users, and settings.
Learn how to track loan EMIs, outstanding balances, principal, interest, next payment dates, and repayment progress in Google Sheets with this template.
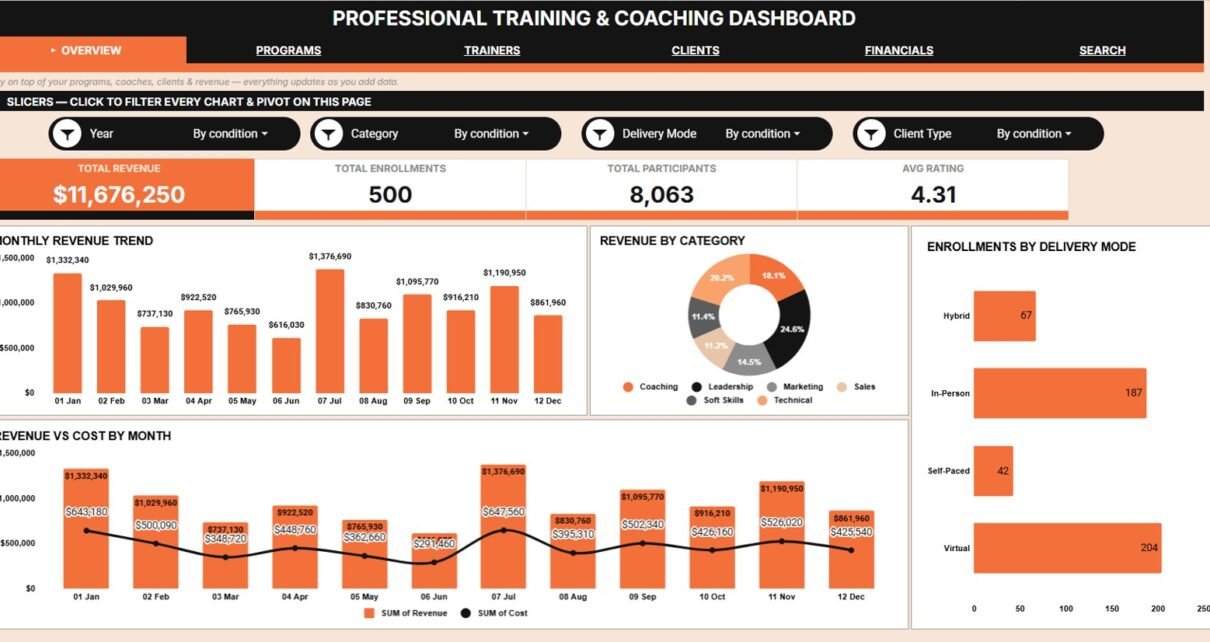
The Professional Training and Coaching Dashboard in Google Sheets tracks 4 KPIs and 20 charts across 5 pages, plus a Search tab and a Data tab. Track revenue, cost, trainers, programs and clients in one file — no LMS subscription required.
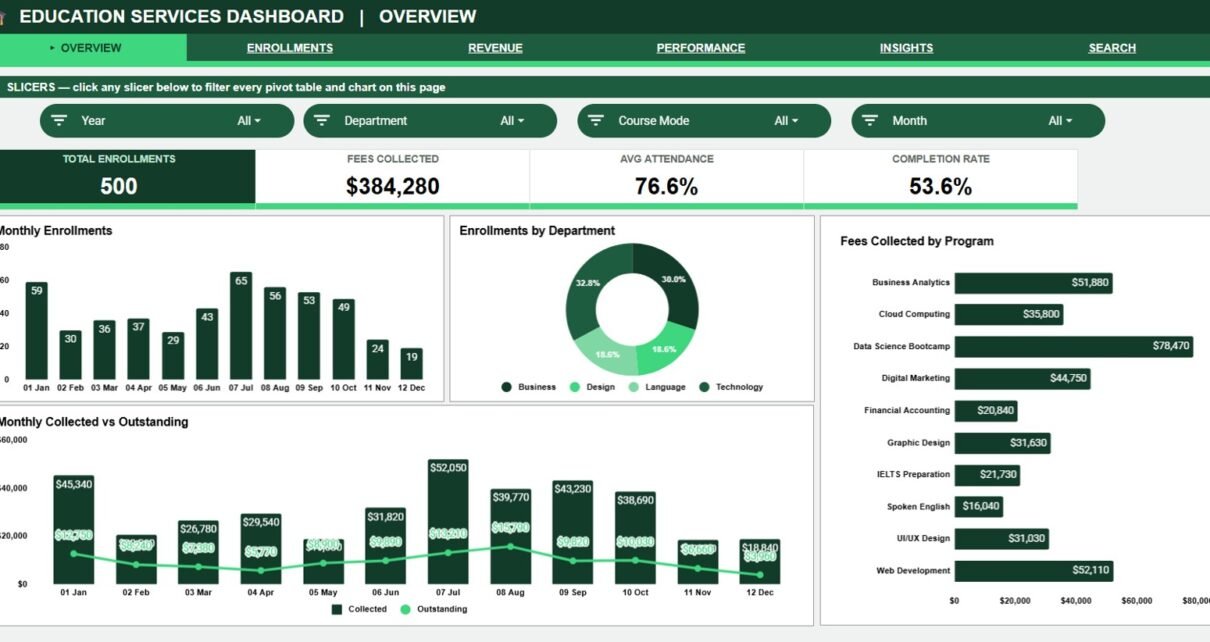
The Education Services Dashboard in Google Sheets tracks 4 KPIs and 20 charts across 5 analysis pages, plus a Search sheet that returns 17 fields for any student by Enrollment ID. Setup takes under 10 minutes.
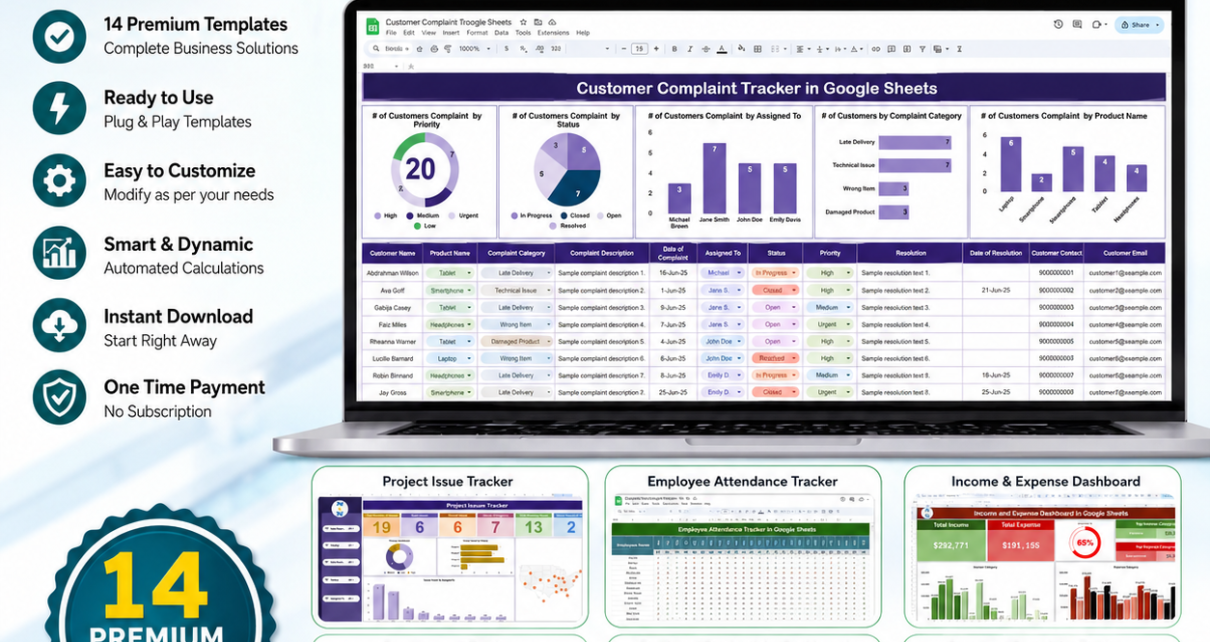
Get the Google Sheets Business Pack (Pro) – 14 premium Google Sheets trackers and dashboards for SMBs and remote teams. Individual total $109.86, bundle just $56.99 – save 48% ($52.87) with instant download.
Review cash in, cash out, net cash flow, categories, accounts, and monthly movement with this Personal Cash Flow Tracker in Google Sheets.
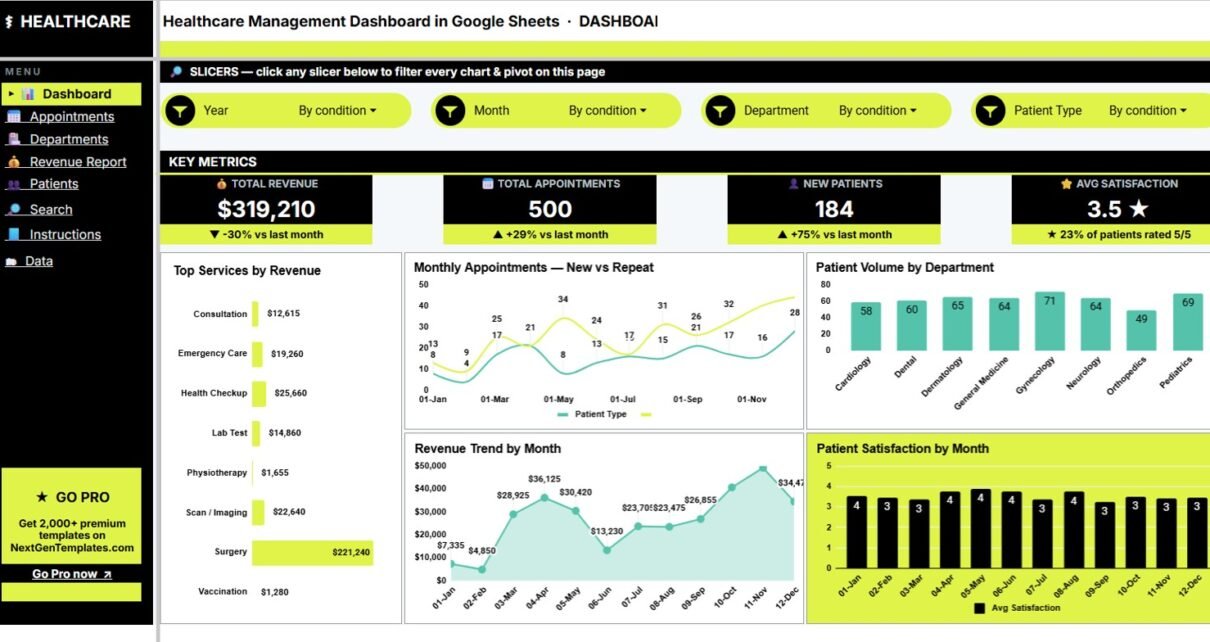
Healthcare Management Dashboard in Google Sheets with 7 tabs, 4 KPI cards, 21 chart views, slicers, Appointment ID lookup, and editable source data.
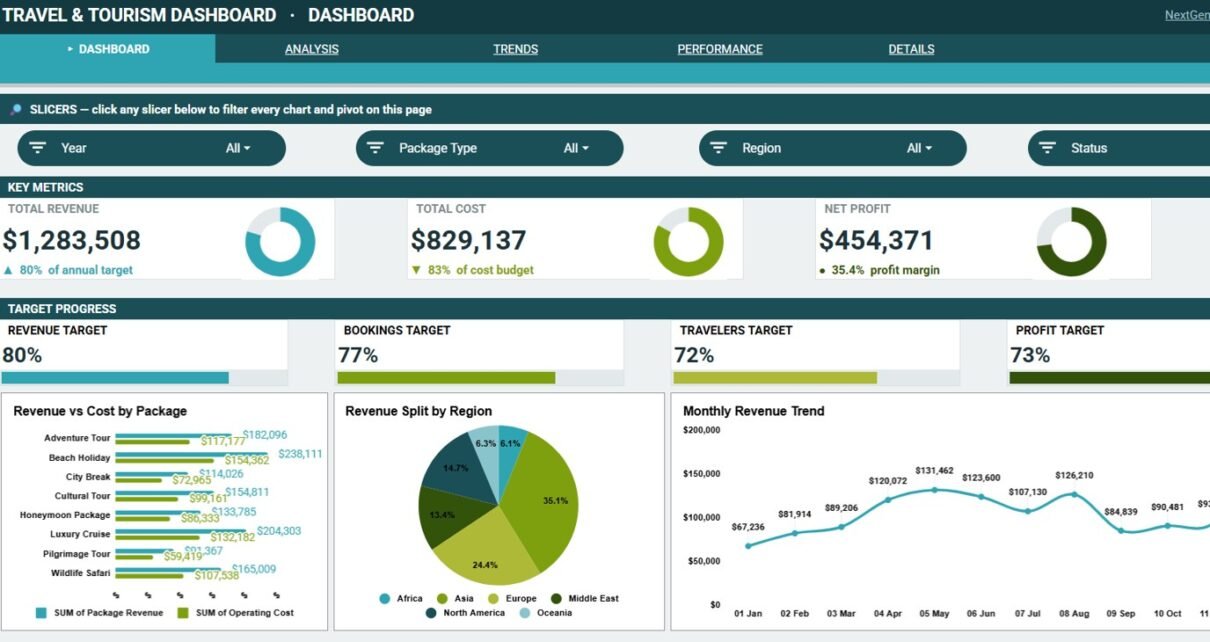
Review the Travel and Tourism Dashboard in Google Sheets with Overview, Analysis, Trends, Performance, Details, and Data Sheet tabs for revenue, bookings, travelers, cost, and profit reporting.
Track emergency fund balances, deposits, categories, statuses, and a 6-month savings goal with this Google Sheets emergency fund tracker.
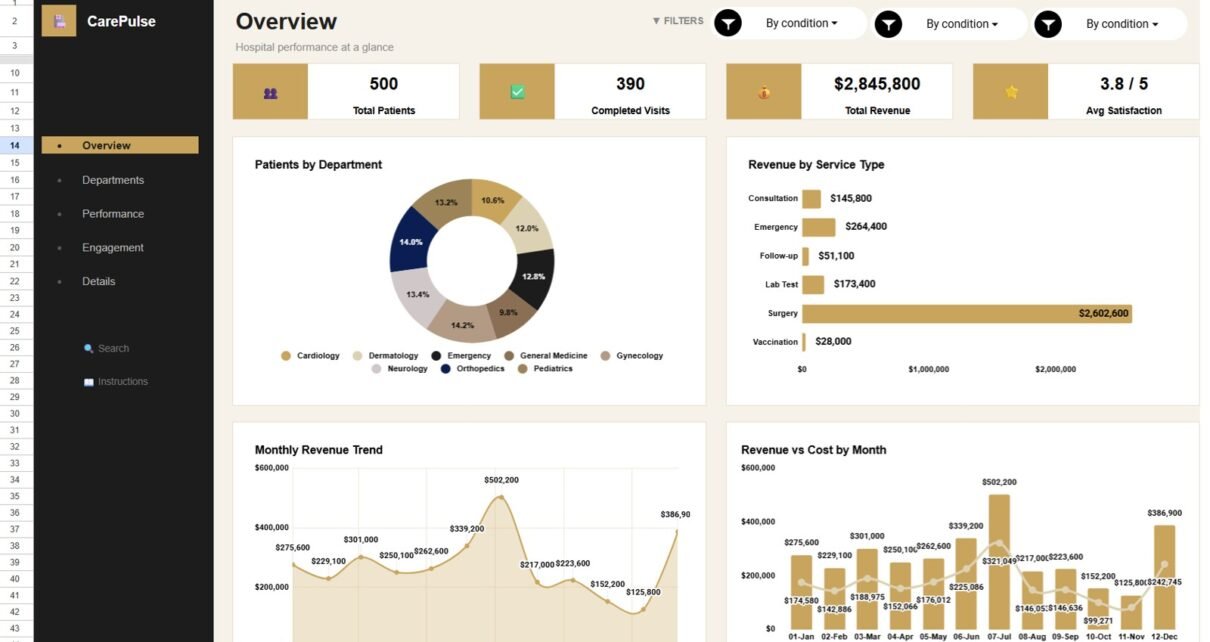
Track patients, completed visits, revenue, costs, satisfaction, departments, service types, doctor activity, Visit ID lookup, and raw healthcare services records in a Google Sheets dashboard.