As AI and machine learning (ML) technologies continue to grow, tracking the performance of AI models and their impact is essential for businesses to understand the effectiveness of their systems. The AI & Machine Learning KPI Dashboard in Google Sheets helps you measure and monitor key performance indicators (KPIs) that reflect the success of your AI/ML models and their contribution to business goals. This dashboard provides a structured and efficient way to track model performance, evaluate success, and identify areas for improvement.
In this article, we will explain the key features of the AI & Machine Learning KPI Dashboard, the KPIs it tracks, and how it can help you optimize your AI/ML processes and decision-making.
What is an AI & Machine Learning KPI Dashboard?
An AI & Machine Learning KPI Dashboard is a data visualization tool that allows you to monitor and analyze various performance metrics associated with AI and ML models. The dashboard presents real-time data, highlighting important KPIs like model accuracy, prediction performance, and operational efficiency. It helps data scientists, machine learning engineers, and business leaders track how well their AI systems are performing and identify areas for improvement.
The Google Sheets dashboard provides a simple yet powerful way to organize and visualize key metrics, making it accessible for teams working on AI projects. It enables data-driven decision-making and fosters collaboration among team members.
Key Features of the AI & Machine Learning KPI Dashboard in Google Sheets
The AI & Machine Learning KPI Dashboard includes several worksheets designed to track various metrics and offer insights into the performance of AI/ML models. Below is an overview of the key features:
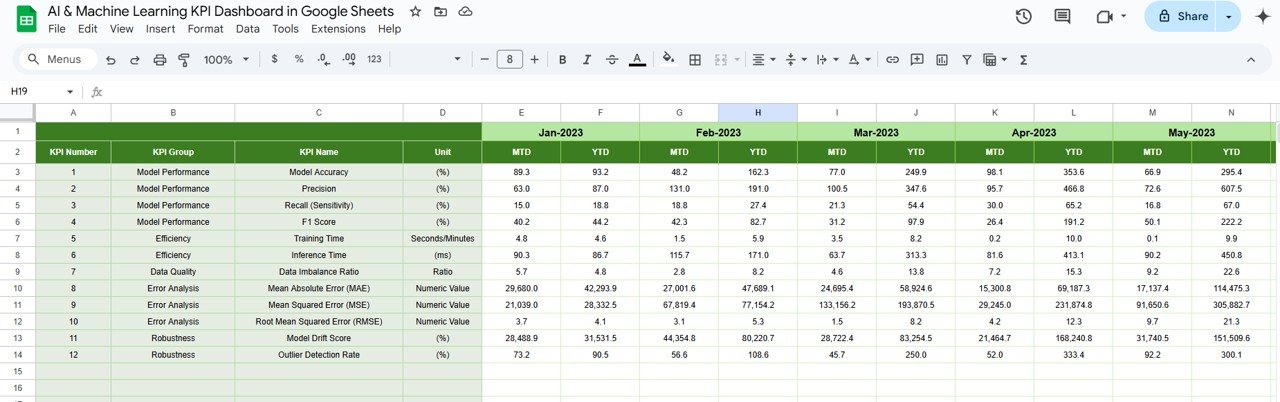
1. Dashboard Sheet Tab
The Dashboard Sheet is the main page where all the key performance indicators (KPIs) are displayed. It includes:
Month Dropdown (D3): Use this dropdown to select the month for which you want to view the data. The dashboard updates automatically to reflect the selected month.

Click to buy AI & Machine Learning KPI Dashboard in Google Sheets
Key Metrics:
- MTD Actual, Target, Previous Year Data: Displays the actual data for the current month, compared with the target and previous year’s performance.
- YTD Actual, Target, Previous Year Data: Tracks performance year-to-date, with comparisons to targets and the same period from the previous year.
Conditional Formatting: Up and down arrows are used to visually indicate whether each KPI meets or misses the target for both MTD and YTD data.
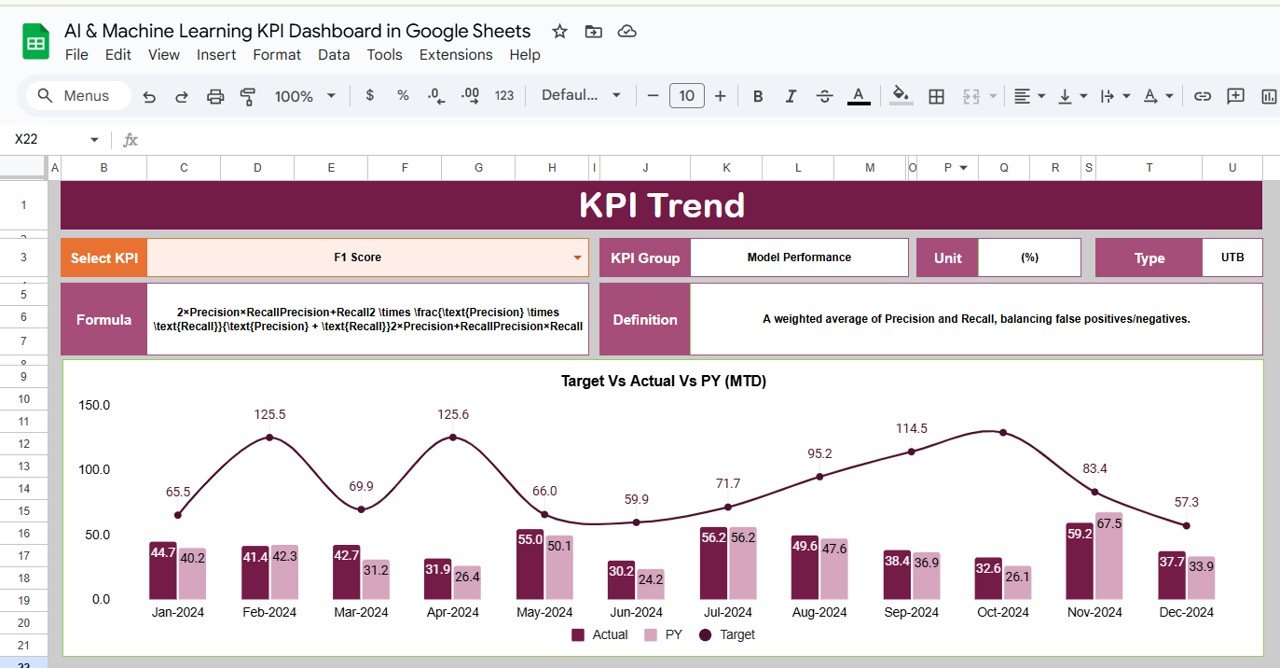
2. KPI Trend Sheet Tab
The KPI Trend Sheet provides historical trend analysis for AI and ML model performance.
-
KPI Selection Dropdown (C3): Select a specific KPI from the dropdown to view its trend data.
-
KPI Group: Displays the group or category to which the KPI belongs (e.g., model accuracy, model performance).
-
Unit and Type: Shows the unit of measurement for the KPI (e.g., percentage, time, count) and whether the KPI is “Lower the Better” (LTB) or “Upper the Better” (UTB).
-
Formula and Definition: Explains how each KPI is calculated and what it represents, helping you understand the significance of each metric.
Click to buy AI & Machine Learning KPI Dashboard in Google Sheets
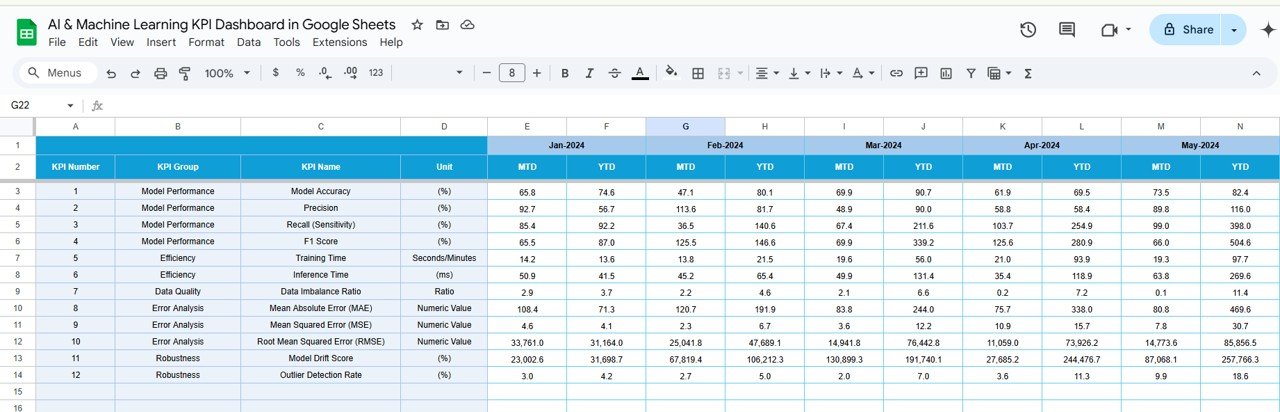
3. Actual Numbers Sheet Tab
In the Actual Numbers Sheet, you can input the actual performance numbers for both MTD and YTD metrics.
-
MTD and YTD Data: Enter the actual values for the key performance indicators (KPIs) for a specific month or year.
-
Month Selection (E1): Select the first month of the year to automatically adjust the data input and refresh the dashboard.
4. Target Sheet Tab
The Target Sheet is where you set the target values for each KPI:
-
Monthly and YTD Targets: Input the target numbers for each KPI, both for MTD and YTD performance, allowing you to track progress toward goals.
Click to buy AI & Machine Learning KPI Dashboard in Google Sheets
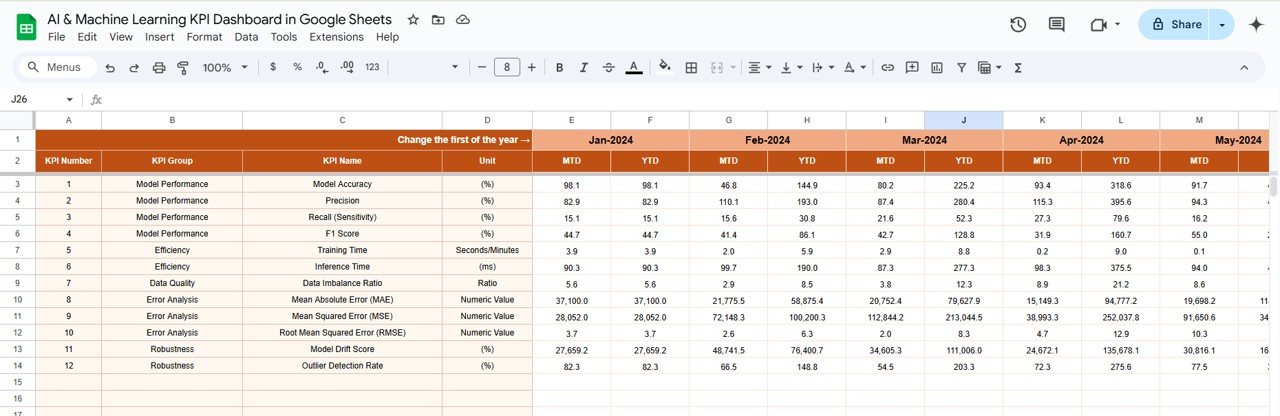
5. Previous Year Number Sheet Tab
In the Previous Year Number Sheet, you can enter the data for the previous year, which will be used for comparison:
-
Historical Comparison: This sheet allows you to compare the current year’s performance with the previous year’s results, providing valuable insights into progress and areas needing attention.
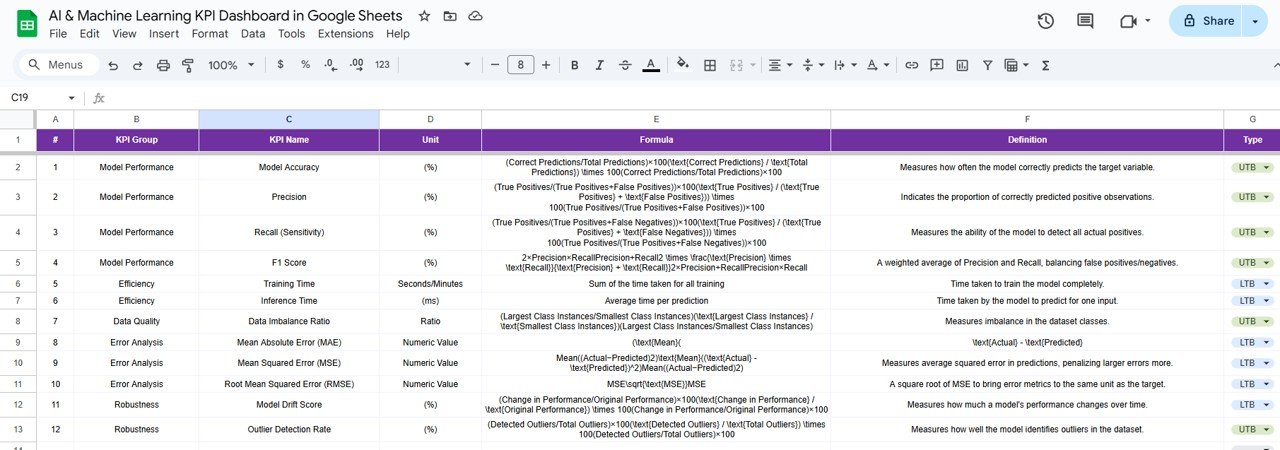
6. KPI Definition Sheet Tab
The KPI Definition Sheet provides detailed information on each KPI:
-
KPI Name, Group, Unit: Define the KPI’s name, group (e.g., accuracy, speed), and unit of measurement.
-
Formula and Definition: This section explains the formula used to calculate each KPI and its definition, offering clarity on how each metric contributes to the performance evaluation of AI/ML models.
Click to buy AI & Machine Learning KPI Dashboard in Google Sheets
Advantages of Using the AI & Machine Learning KPI Dashboard
The AI & Machine Learning KPI Dashboard offers several advantages to businesses and data science teams:
-
Real-Time Insights: The dashboard provides real-time tracking of model performance, enabling teams to monitor the success of their AI/ML systems continuously.
-
Informed Decision-Making: By visualizing key metrics like accuracy, recall, and training time, the dashboard enables data-driven decision-making for model improvements.
-
Comprehensive Evaluation: With multiple KPIs to track, teams can evaluate models from various perspectives, including performance, cost, and efficiency.
-
Improved Collaboration: The dashboard serves as a collaborative tool for data scientists, engineers, and business stakeholders to align on performance goals.
-
Customization: The dashboard can be customized to fit specific AI/ML models or business objectives, ensuring that the metrics you care about are tracked effectively.
Opportunity for Improvement in the AI & Machine Learning KPI Dashboard
Click to buy AI & Machine Learning KPI Dashboard in Google Sheets
While the AI & Machine Learning KPI Dashboard is an excellent tool for tracking model performance, there are several opportunities for improvement:
-
Integration with Machine Learning Platforms: Automating data import from machine learning platforms like TensorFlow, PyTorch, or Azure ML can streamline data entry and reduce errors.
-
Predictive Analytics: Including predictive capabilities could help anticipate model performance issues and suggest improvements before problems occur.
-
Advanced Analytics: Adding advanced analytics features, such as trend forecasting and anomaly detection, would allow teams to proactively manage model performance.
-
Mobile-Friendly Version: Making the dashboard mobile-friendly would enable users to monitor model performance on the go.
Best Practices for Using the AI & Machine Learning KPI Dashboard
To get the most out of the AI & Machine Learning KPI Dashboard, follow these best practices:
-
Regularly Update Data: Keep the data up to date to ensure that you’re working with the most current performance information.
-
Focus on High-Impact KPIs: Prioritize tracking KPIs that directly impact business outcomes, such as model accuracy, inference time, and cost per prediction.
-
Monitor Trends Over Time: Use the trend analysis feature to track changes in model performance, helping you identify potential issues early.
-
Set Realistic Targets: Establish achievable targets for each KPI based on historical performance, industry benchmarks, and business goals.
-
Collaborate with Stakeholders: Share the dashboard with key stakeholders in your business to ensure alignment on performance goals and improvement strategies.
Conclusion
Click to buy AI & Machine Learning KPI Dashboard in Google Sheets
The AI & Machine Learning KPI Dashboard in Google Sheets is an invaluable tool for tracking and evaluating the performance of machine learning models. By tracking key metrics such as accuracy, recall, and model training time, this dashboard helps teams monitor the success of their models and make data-driven decisions to optimize performance. Whether you’re managing AI/ML projects in a business setting or working on research models, the dashboard provides the insights you need to drive continuous improvement and achieve your objectives.
Frequently Asked Questions (FAQs)
1. What KPIs does the AI & Machine Learning KPI Dashboard track?
The dashboard tracks KPIs like model accuracy, precision, recall, training time, inference time, and cost per prediction.
2. Can I customize the AI & Machine Learning KPI Dashboard?
Yes, the dashboard is fully customizable. You can add or modify KPIs, adjust formulas, and tailor the layout to meet your needs.
3. How do I input data into the AI & Machine Learning KPI Dashboard?
Data is entered manually in the Actual Numbers Sheet for MTD and YTD metrics, with targets entered in the Target Sheet and historical data in the Previous Year Sheet.
4. How often should I update the data in the AI & Machine Learning KPI Dashboard?
It’s recommended to update the dashboard regularly (e.g., weekly or monthly) to ensure the data reflects current model performance.
5. Can the AI & Machine Learning KPI Dashboard be automated?
Yes, you can integrate the dashboard with machine learning platforms to automate data collection and ensure accurate updates.
Visit our YouTube channel to learn step-by-step video tutorials
Youtube.com/@NeotechNavigators
Watch the step-by-step video Demo:
Click to buy AI & Machine Learning KPI Dashboard in Google Sheets