Meet PK, the founder of NeotechNavigators.com! With over 15 years of experience in Data Visualization, Excel Automation, and dashboard creation. PK is a Microsoft Certified Professional who has a passion for all things in Excel. PK loves to explore new and innovative ways to use Excel and is always eager to share his knowledge with others. With an eye for detail and a commitment to excellence, PK has become a go-to expert in the world of Excel. Whether you're looking to create stunning visualizations or streamline your workflow with automation, PK has the skills and expertise to help you succeed. Join the many satisfied clients who have benefited from PK's services and see how he can take your data analysis skills to the next level!
Renaming columns is a simple yet essential step in data cleaning and preparation. When working with data in Power Query for Power BI, you often encounter columns with names that are unclear, inconsistent, or difficult to understand. Renaming Columns in Power Query to something more meaningful or standardized helps improve the readability of your data, […]
In the world of data transformation, replacing values is one of the most common and essential tasks. Whether you’re dealing with missing information, fixing errors, or just making your data more consistent, Power Query in Power BI gives you a variety of powerful tools to handle this. But why is replacing values so important? Let’s […]
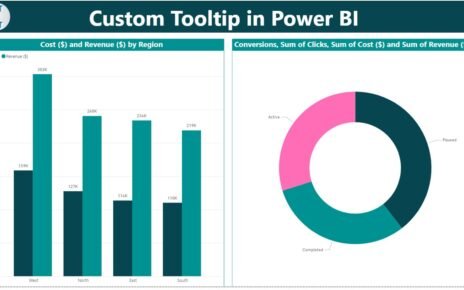
Tooltips in Power BI are more than just floating numbers. With custom tooltips, you can add meaningful visualizations that appear when a user hovers over any chart or graphic. This feature enables powerful storytelling without overwhelming your main report canvas.Custom Tooltip in Power BI In this blog post, we will explain what custom tooltips are, […]