In the food manufacturing industry, tracking key performance indicators (KPIs) is essential for ensuring efficiency, maintaining quality, and meeting production targets. A Food Manufacturing KPI Dashboard in Google Sheets is a powerful tool that helps manufacturers monitor and manage critical metrics in real-time. This ready-to-use template provides a structured approach to tracking performance across various aspects of food manufacturing, such as production, quality control, and inventory management.
In this article, we’ll walk you through the Food Manufacturing KPI Dashboard in Google Sheets, highlighting its key features and explaining how it can help improve operations by providing valuable insights into performance.
What is a Food Manufacturing KPI Dashboard in Google Sheets?
The Food Manufacturing KPI Dashboard in Google Sheets is a comprehensive tool that tracks and visualizes key metrics related to food production processes. This dashboard is designed to help food manufacturers monitor the effectiveness of their operations, measure performance against targets, and identify areas for improvement. With various charts, slicers, and real-time data updates, it enables manufacturers to make data-driven decisions and optimize their processes for better efficiency and profitability.
The dashboard consists of multiple worksheets, each focused on tracking different aspects of food manufacturing operations. Below are the key features and worksheets of the Food Manufacturing KPI Dashboard in Google Sheets:
Key Features of the Food Manufacturing KPI Dashboard in Google Sheets
This dashboard includes six main worksheets, each providing a unique perspective on different aspects of food manufacturing operations:
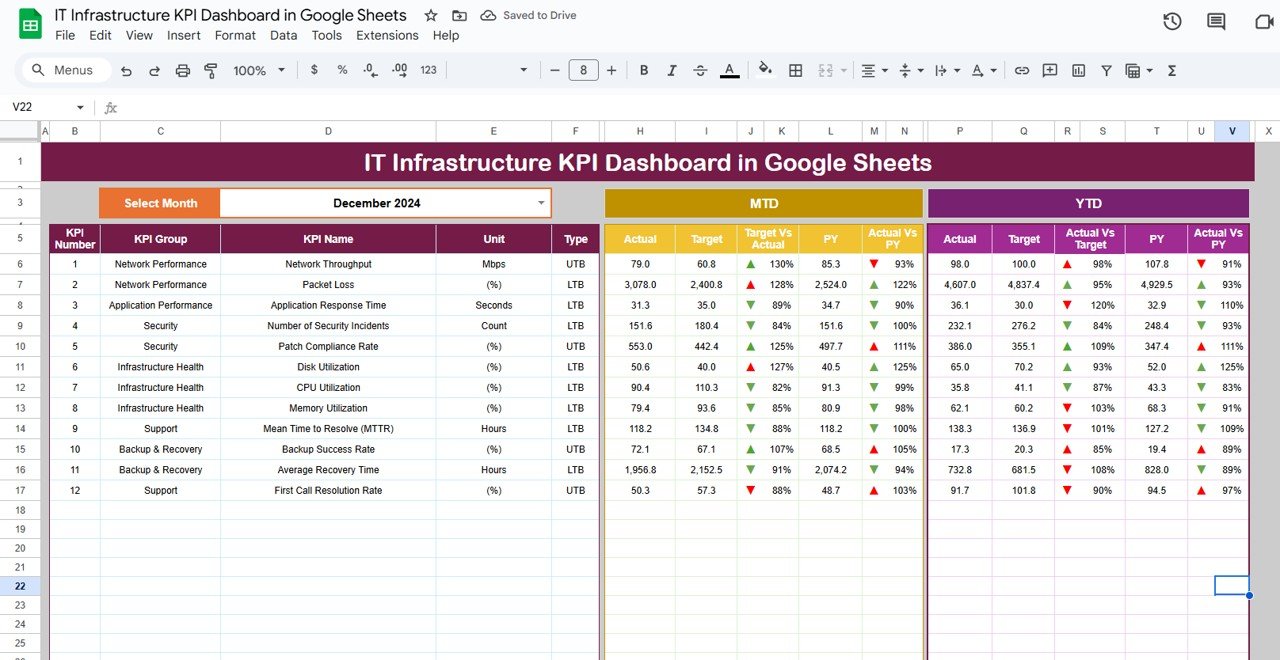
1. Dashboard Sheet Tab
The Dashboard Sheet provides an overview of all key KPIs and presents them in an easy-to-understand format. This sheet includes:
MTD (Month-to-Date) and YTD (Year-to-Date) Metrics:
The dashboard shows both MTD and YTD actual performance, target data, and previous year (PY) data. These metrics are displayed with conditional formatting to visually indicate whether performance is above or below expectations (up/down arrows).
Metrics Included:
- MTD Actual: Shows the actual performance for the month.
- MTD Target: Displays the target set for the month.
- PY vs Actual: Compares the actual performance with previous year’s data.
- YTD Actual: Displays the cumulative actual performance from the beginning of the year.
- YTD Target vs Actual: Compares the YTD target with the actual performance.

Click to buy Food Manufacturing KPI Dashboard in Google Sheets
2. KPI Trend Sheet Tab
The KPI Trend Sheet allows users to track the performance of specific KPIs over time.
KPI Selection:
You can select a KPI name from the dropdown in C3, and the sheet will display details for that KPI, including:
- KPI Group
- Unit of KPI
- Type of KPI (Lower the better/Upper the better)
- Formula: Describes how the KPI is calculated.
- KPI Definition: Provides a clear definition of the KPI and its relevance to the manufacturing process.

Click to buy Food Manufacturing KPI Dashboard in Google Sheets
3. Actual Number Sheet Tab
This sheet is where you input the actual performance data for both MTD and YTD. You can easily update the values for each KPI by selecting the appropriate month from E1 and entering the actual figures for the selected month.

Click to buy Food Manufacturing KPI Dashboard in Google Sheets
4. Target Sheet Tab
In this sheet, you input the target numbers for each KPI for both MTD and YTD. These targets are used to compare against actual performance and measure success.

Click to buy Food Manufacturing KPI Dashboard in Google Sheets
5. Previous Year Number Sheet Tab
This sheet stores the performance data from the previous year, allowing for comparisons between current and past performance. You enter the previous year’s data to analyze trends and identify improvements or declines.

Click to buy Food Manufacturing KPI Dashboard in Google Sheets
6. KPI Definition Sheet Tab
This sheet provides a detailed description of each KPI, including:
-
KPI Name
-
KPI Group
-
Unit
-
Formula
-
KPI Definition

Advantages of Using the Food Manufacturing KPI Dashboard
-
Centralized Tracking:
The dashboard centralizes all relevant KPI data, making it easier to manage and analyze production performance. -
Real-Time Updates:
The dashboard dynamically updates as new data is entered, ensuring you always have the latest performance metrics. -
Customization:
The dashboard can be easily customized to fit your specific food manufacturing needs, from production tracking to quality control and energy management. -
Data-Driven Decisions:
The visual representation of data allows for better decision-making and helps pinpoint areas that require improvement. -
Easy Collaboration:
Since it’s built in Google Sheets, it can be shared and updated in real-time with team members, fostering collaboration.
Best Practices for Using the Food Manufacturing KPI Dashboard
Click to buy Food Manufacturing KPI Dashboard in Google Sheets
-
Consistent Data Entry:
Ensure that data is entered regularly to maintain an accurate and up-to-date view of operations. -
Monitor Trends:
Review the KPI trends over time to identify areas of improvement or success in your production processes. -
Review Performance Against Targets:
Use the dashboard to compare actual performance to targets, helping identify areas where your operations may need adjustment. -
Use Data for Continuous Improvement:
Utilize the insights gained from the dashboard to optimize production processes, reduce waste, and improve overall efficiency.
Frequently Asked Questions (FAQs)
1. How do I update the Food Manufacturing KPI Dashboard?
Simply enter the latest data for MTD and YTD in the Actual Number Sheet, and the dashboard will automatically update.
2. Can I track multiple production lines with this dashboard?
Yes, you can customize the Data Sheet to track different production lines or plant locations, and the dashboard will automatically update.
3. How can I monitor energy consumption more effectively?
You can track energy consumption per unit of production, helping identify energy inefficiencies and areas for improvement.
4. Can I share the dashboard with my team?
Yes, since it’s built in Google Sheets, you can easily share it with team members for collaborative data entry and analysis.
Conclusion
Click to buy Food Manufacturing KPI Dashboard in Google Sheets
The Food Manufacturing KPI Dashboard in Google Sheets is an essential tool for food manufacturers looking to optimize their operations, monitor performance, and make data-driven decisions. By tracking KPIs such as production volume, quality defects, machine downtime, and cost per unit, manufacturers can identify areas for improvement and ensure that their processes are running efficiently. This ready-to-use template provides a comprehensive, real-time view of production performance, making it easier to manage and improve food manufacturing processes.
Visit our YouTube channel to learn step-by-step video tutorials
Youtube.com/@NeotechNavigators
Watch the step-by-step video Demo:
Click to buy Food Manufacturing KPI Dashboard in Google Sheets