In today’s fast-paced and data-driven world, keeping track of key performance indicators (KPIs) in manufacturing is crucial for making informed decisions and improving operational efficiency. Manufacturing companies rely on KPIs to assess productivity, quality, and other essential metrics that drive performance. With the power of Google Sheets, you can create a robust Manufacturing KPI Dashboard that helps monitor these metrics in real-time.
This article will explore the process of creating a Manufacturing KPI Dashboard in Google Sheets, discussing its features, key KPIs, best practices, and opportunities for improvement. We will guide you through the structure of the dashboard, and provide helpful tips on using this tool to its full potential.
What is a Manufacturing KPI Dashboard?
A Manufacturing KPI Dashboard in Google Sheets is a visual representation of key performance indicators, used to track and measure the performance of manufacturing operations. This tool consolidates various data points, such as production output, efficiency, quality, and downtime, into an easy-to-read format that helps decision-makers monitor performance and take corrective actions when needed.
Using Google Sheets for this purpose has many advantages, such as real-time collaboration, accessibility from anywhere, and the ability to customize the dashboard according to your needs.
Key Features of the Manufacturing KPI Dashboard in Google Sheets
The Manufacturing KPI Dashboard in Google Sheets is designed to be simple, yet powerful. It comes with 6 main worksheets that enable you to manage and track different aspects of manufacturing performance. Let’s dive into each sheet’s purpose and features:
Click to buy Manufacturing KPI Dashboard in Google Sheets
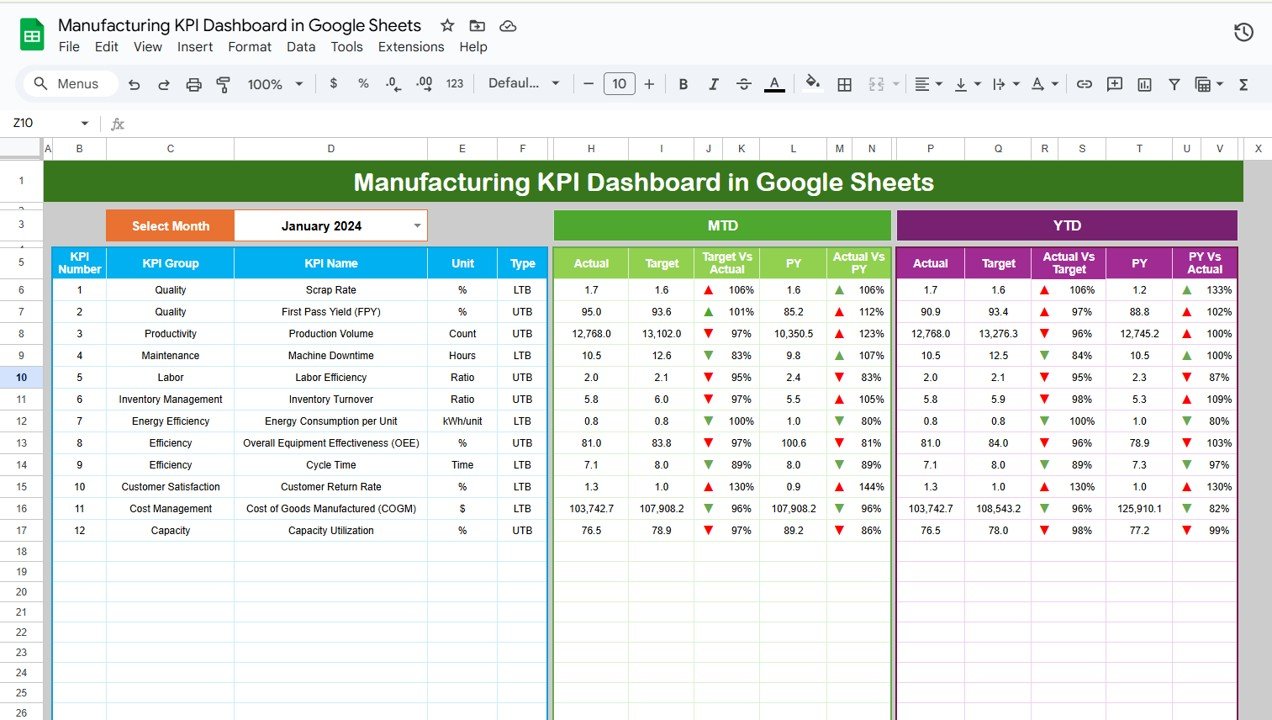
1. Dashboard Sheet Tab
The Dashboard Sheet Tab is the heart of the KPI Dashboard. It displays real-time data for all KPIs and offers a visual overview of your manufacturing performance. Key features include:
- Month Selector: Select the month from a dropdown in Range D3 to update the entire dashboard with relevant data for that month.
- MTD (Month-to-Date) Data: Displays actual performance for the current month, targets, previous year data, and the variance between targets and actuals. The data is color-coded with conditional formatting (up or down arrows) for better visual impact.
- YTD (Year-to-Date) Data: Similar to MTD, but showing cumulative performance throughout the year.
- Target vs Actual Comparison: Easily compare your manufacturing performance against the set targets and the performance of the previous year.
Click to buy Manufacturing KPI Dashboard in Google Sheets
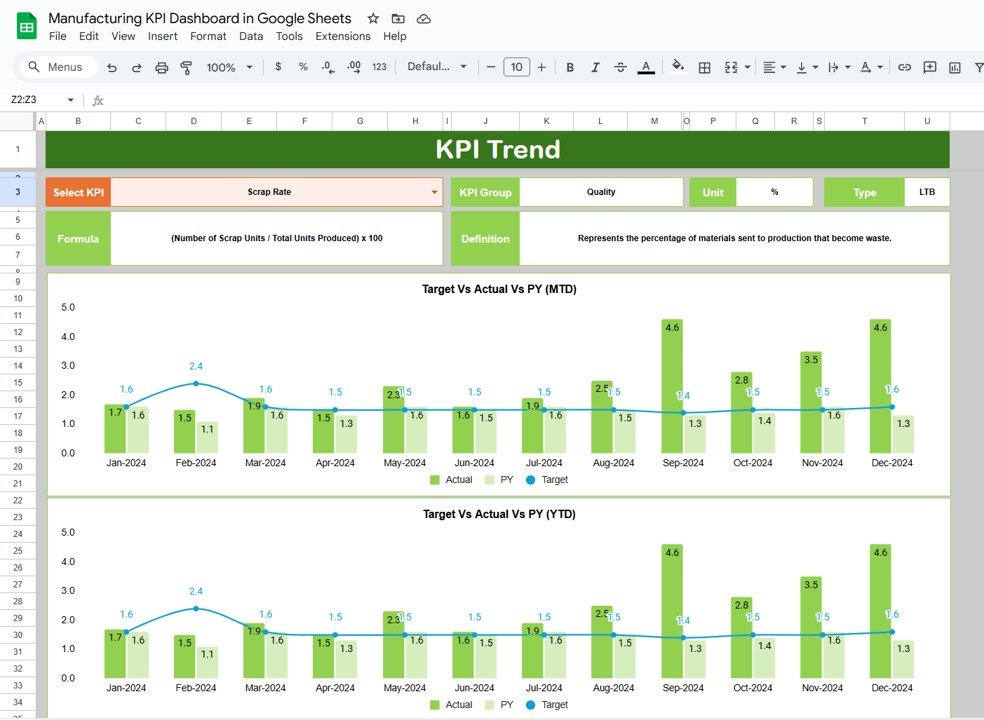
2. KPI Trend Sheet Tab
The KPI Trend Sheet Tab provides a deeper dive into the trends of each KPI. Here’s what it offers:
KPI Selection: You can select a specific KPI from the dropdown in Range C3.
KPI Details: The sheet displays important information about the selected KPI, including:
- KPI Group
- Unit of Measurement
- Type of KPI (Lower the better or Upper the better)
- Formula for calculation
- Definition of the KPI
Click to buy Manufacturing KPI Dashboard in Google Sheets
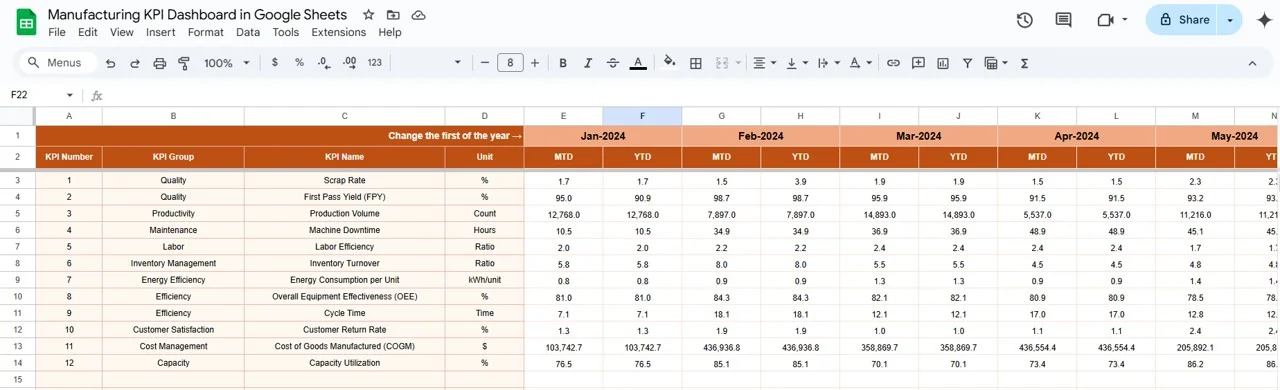
3. Actual Numbers Sheet Tab
This sheet is where you enter the actual numbers for the KPIs. The dashboard relies on this data to calculate MTD and YTD performance.
- Data Entry: Enter the actual performance numbers for each KPI, and the dashboard will automatically update.
- Month Selector: Use Range E1 to select the month you want to enter data for. Once entered, the sheet calculates the MTD and YTD performance based on your inputs.
Click to buy Manufacturing KPI Dashboard in Google Sheets
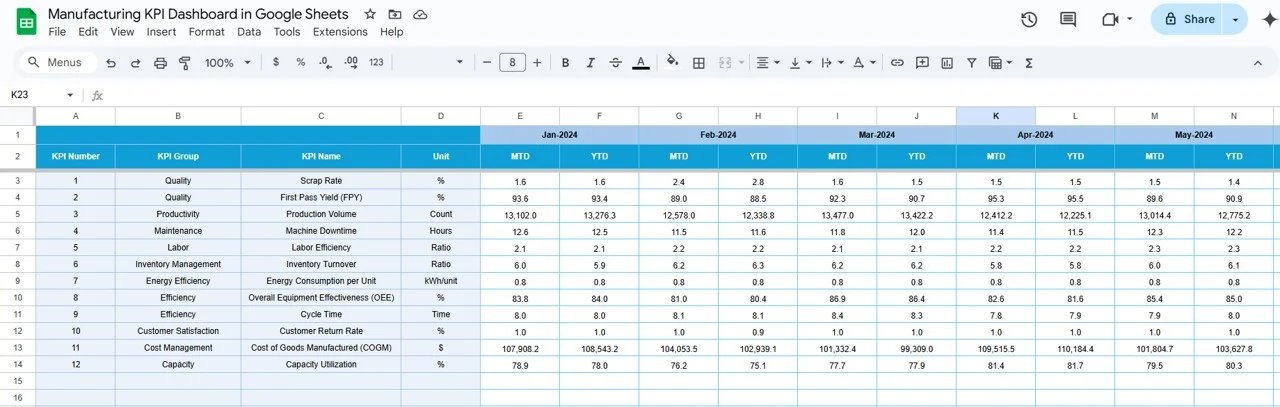
4. Target Sheet Tab
In this tab, you will input the target values for each KPI, which will be used for comparison against actual performance data.
- MTD and YTD Targets: Enter the monthly target as well as the cumulative YTD target for each KPI.
- Real-time Comparison: The dashboard will compare actual performance against targets to identify areas of improvement.
Click to buy Manufacturing KPI Dashboard in Google Sheets
5. Previous Year Numbers Sheet Tab
This tab allows you to enter data for the previous year for comparative analysis.
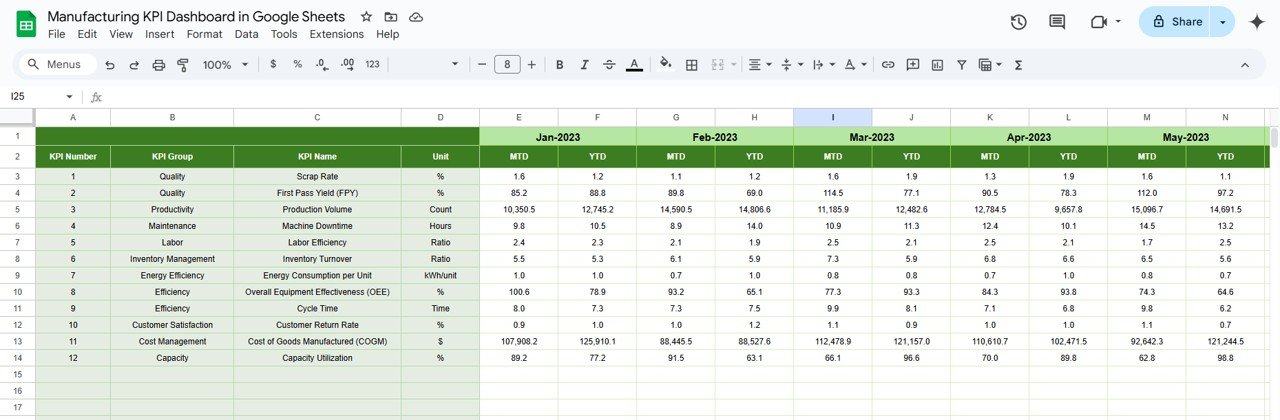
Click to buy Manufacturing KPI Dashboard in Google Sheets
- Year-over-Year Comparison: Compare current year data with previous year data to assess growth or decline. This comparison helps you identify trends and areas where performance is improving or lacking.
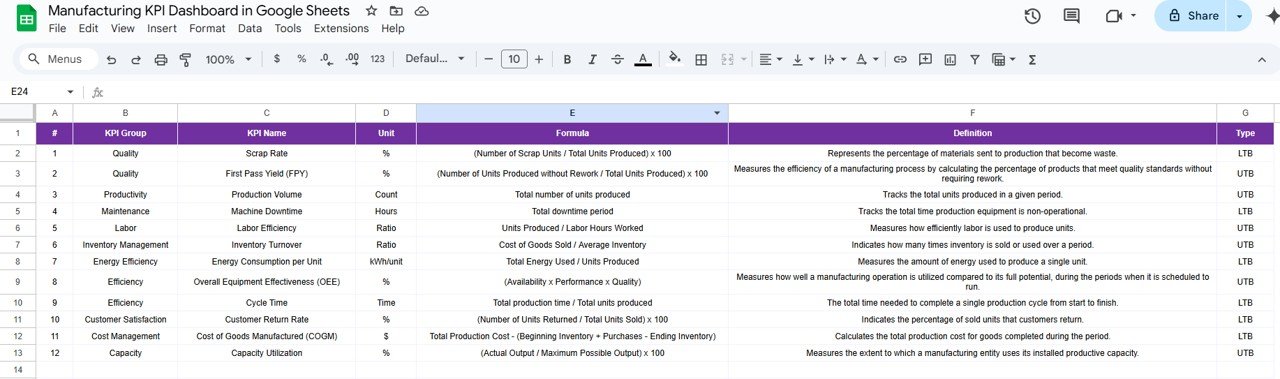
6. KPI Definition Sheet Tab
This is where you store the key details of each KPI, ensuring that the entire team is on the same page.
- Data Entry: Enter the KPI name, group, unit of measurement, formula, and definition.
- Clarification: This sheet provides clarity on each KPI, ensuring consistent understanding across the organization.
Click to buy Manufacturing KPI Dashboard in Google Sheets
Advantages of Using a Manufacturing KPI Dashboard in Google Sheets
Implementing a Manufacturing KPI Dashboard in Google Sheets offers several advantages, including:
- Real-time Monitoring: With Google Sheets, you can update data in real-time, enabling immediate access to performance metrics.
- Cost-Effective: Google Sheets is free and doesn’t require specialized software or licenses.
- Collaboration: Multiple team members can collaborate on the dashboard, ensuring that everyone has access to the same information at the same time.
- Customizability: You can customize the dashboard to include specific KPIs relevant to your manufacturing process.
- Automation: Google Sheets allows you to automate data entry and calculations, saving time and reducing the risk of errors.
Opportunities for Improvement in Your Manufacturing KPI Dashboard
While the Manufacturing KPI Dashboard in Google Sheets is a powerful tool, there are always opportunities for improvement:
- Incorporate Predictive Analytics: Add forecasting models to predict future trends in manufacturing performance.
- Real-Time Data Integration: Integrate Google Sheets with IoT devices or sensors to pull real-time data automatically.
- Add Interactive Elements: Use Google Sheets’ scripting capabilities to create dynamic charts and interactive elements for deeper insights.
- Improve Data Visualization: Incorporate advanced charts, such as heatmaps or sparklines, to make the dashboard more visually appealing and easier to understand.
Best Practices for Using a Manufacturing KPI Dashboard in Google Sheets
To maximize the effectiveness of your KPI Dashboard, follow these best practices:
- Regular Data Entry: Ensure that data is entered regularly (preferably daily or weekly) to keep the dashboard updated and reliable.
- Set Clear Targets: Define clear targets for each KPI to track progress against realistic goals.
- Review and Adjust KPIs Periodically: Regularly review the KPIs to ensure they are still relevant to your goals and objectives.
- Train Your Team: Educate team members on how to interpret the dashboard and use it to make data-driven decisions.
- Use Conditional Formatting: Leverage conditional formatting for easy visualization of KPI performance (green for good, red for bad).
Frequently Asked Questions
1. What is a KPI Dashboard, and why is it important for manufacturing?
A KPI Dashboard is a visual tool that displays key performance indicators for tracking and improving the performance of manufacturing operations. It helps managers make data-driven decisions and identify areas for improvement.
2. How often should I update my Manufacturing KPI Dashboard?
Ideally, you should update the dashboard weekly or monthly to reflect the most current data. However, this depends on the frequency of data collection and how fast your production process operates.
3. Can I customize the Manufacturing KPI Dashboard in Google Sheets?
Yes, Google Sheets is highly customizable. You can add new KPIs, change the layout, and adjust the formulas to fit your specific needs.
4. Is it possible to automate data entry in the dashboard?
Yes, you can automate data entry by integrating Google Sheets with other data sources or using Google Apps Script to pull data from external systems automatically.
5. How do I determine which KPIs to track in my manufacturing process?
The KPIs you track should align with your business goals. Start by focusing on essential metrics like OEE, cycle time, downtime, and defect rates, then expand to include other relevant KPIs.
Conclusion
A Manufacturing KPI Dashboard in Google Sheets is an invaluable tool for manufacturers looking to optimize their operations and make data-driven decisions. By tracking key metrics such as OEE, cycle time, and defect rates, you can gain insights into your production processes and identify areas for improvement. Whether you are a small manufacturer or part of a large-scale operation, this dashboard can help you achieve greater efficiency, higher quality, and ultimately, better bottom-line results.
Visit our YouTube channel to learn step-by-step video tutorials