Project Gantt Chart in Google Sheets is a comprehensive, ready-to-use project management template designed to help you plan, track, and manage tasks, timelines, team assignments, and project milestones — all within Google Sheets. Whether you are leading a software development sprint, managing a construction project, coordinating a marketing campaign, or overseeing any business initiative, this template provides a complete project management solution without expensive tools or complex setups.
This template features 5 professionally structured pages: a visual Gantt Chart, a data-driven Dashboard with 10+ KPIs, a Detailed Task List with dependency tracking, a Team Members directory, and a fully customizable Settings page. Every chart, KPI card, and metric updates automatically when you enter your project data — making it an ideal tool for project managers, team leads, freelancers, and business owners.
Key Features of Project Gantt Chart in Google Sheets
Click here to Purchase Project Gantt Chart in Google Sheets
- Visual Gantt Chart View — Displays your entire project timeline month-by-month with color-coded task bars. You can spot overlapping tasks, identify bottlenecks, and understand resource allocation at a single glance.
- Dynamic Dashboard with 10+ KPIs — Automatically calculates Total Tasks, Overall Completion, Overdue Tasks, Days Remaining, Task Status Distribution, Priority Breakdown, Tasks by Phase, Team Workload, Project Completion by Timeline Progress, and Milestones Hit.
- Detailed Task List with Dependency Tracking — Every task is tracked with Phase, Task Name, Assigned To, Start Date, End Date, Duration, Percentage Complete, Status, Priority, Dependencies, and Responsible Person.
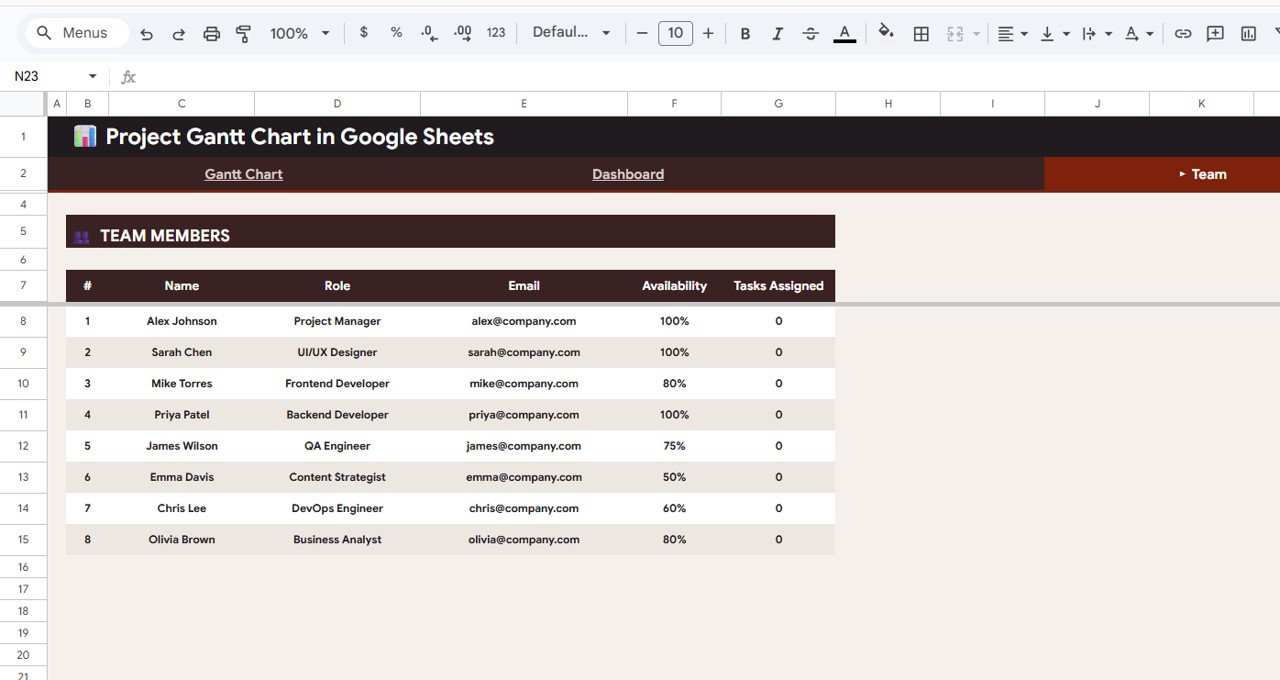
- Team Members Management — Maintain a directory with team member Name, Role, Email, Availability Percentage, and number of Tasks Assigned for workload balancing.
- Customizable Settings — Configure Project Name, Start and End Dates, Working Days, Project Manager, Company Name, Status Options, Priority Legend, and Status Bar Colors.
- Multiple Slicers and Filters — The Gantt Chart page includes slicers to quickly filter tasks by team member, status, priority, or phase.
- Works 100% in Google Sheets — No macros, no add-ons, no external software needed.
If you are looking for more Google Sheets Dashboard Templates, explore our full collection covering HR, Finance, Sales, Manufacturing, Supply Chain, and more.
Dashboard Pages Explained
Click here to Purchase Project Gantt Chart in Google Sheets
1. Gantt Chart Page
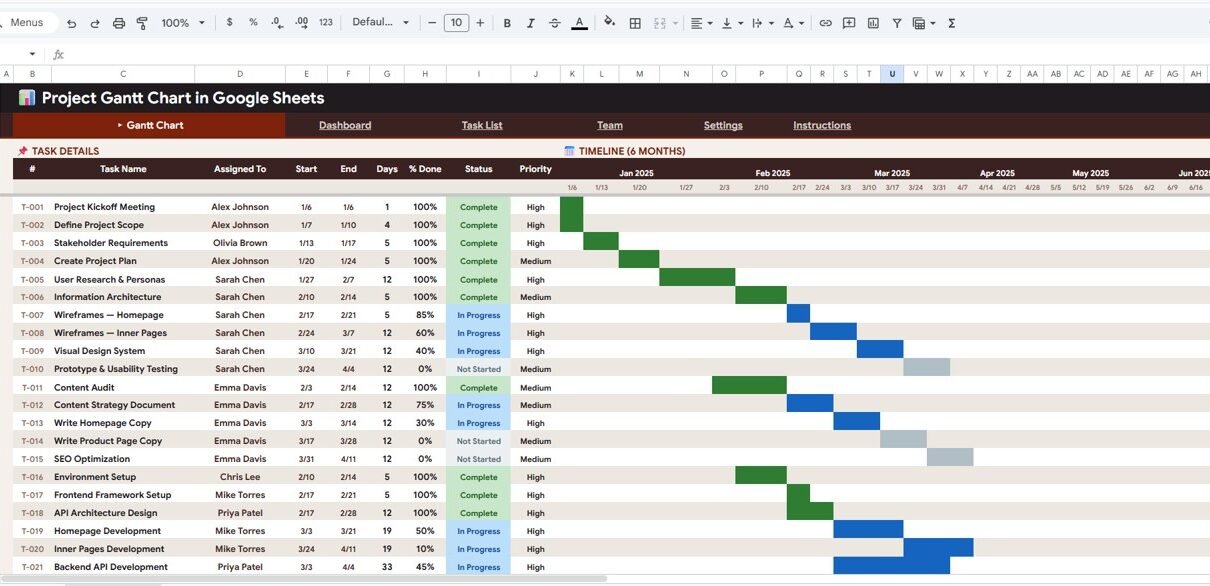
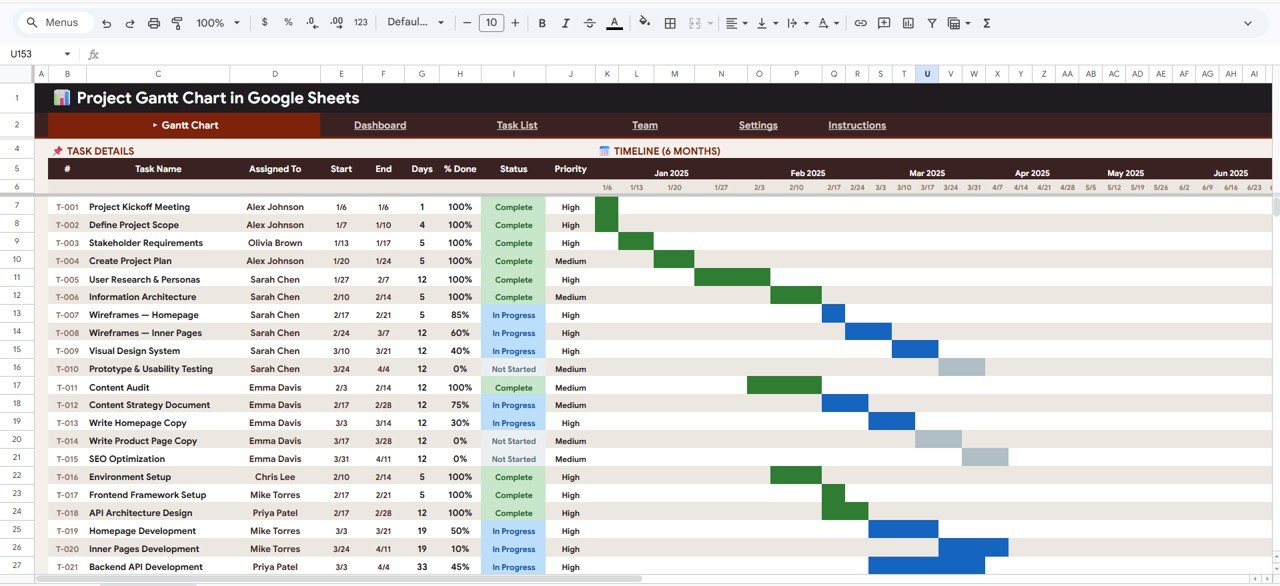
The Gantt Chart page is the visual centerpiece of this template. At the top, you will find information cards displaying high-level details for each task: Task ID, Task Name, Assigned To, Start Date, End Date, Days, % Done, Status, and Priority. These cards provide instant context for every task in your project.
Below the cards, the page features three analytical charts. Task Timeline by Month shows how tasks are distributed across the project timeline, helping you identify busy months and scheduling gaps. Task Progress by Assigned Team Member reveals how much work each team member has completed versus what remains, making it easy to rebalance workload. Task Duration by Task Name highlights which tasks consume the most time, so you can focus optimization efforts where they matter most.
Multiple slicers are available on this page to apply quick filters and drill down into specific subsets of your project data.
Gantt Chart Page – Project Gantt Chart in Google Sheets2. Dashboard
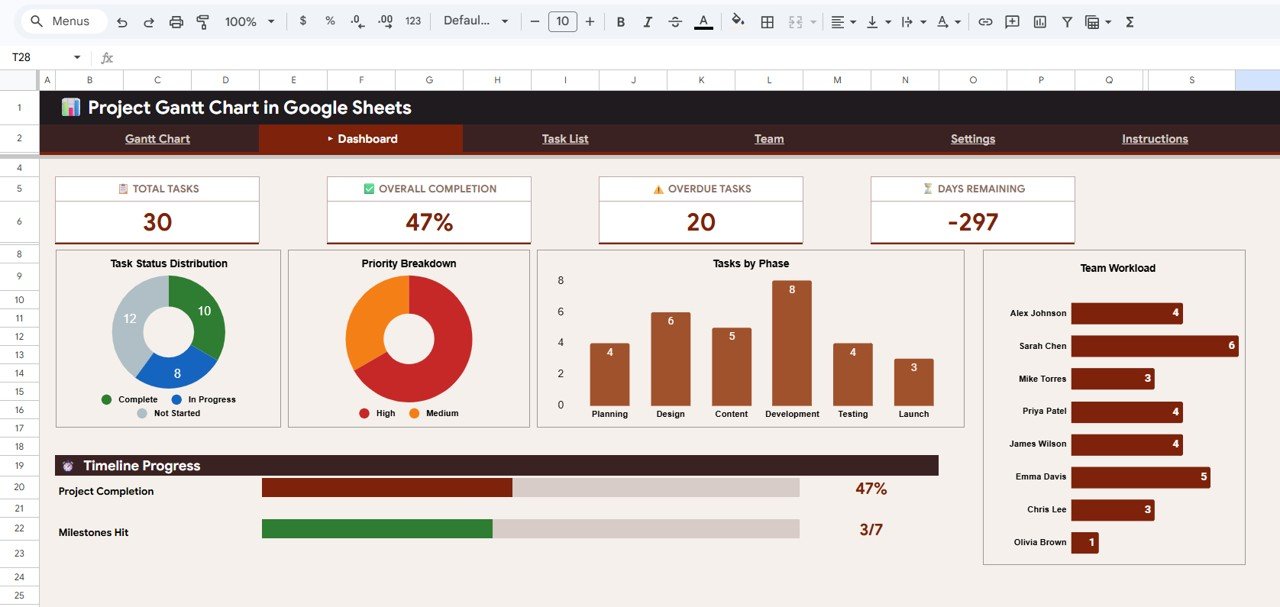
The Dashboard page brings together all critical project metrics in one view. It includes 10 key performance indicators and visual analyses: Total Tasks gives you the overall task count, Overall Completion shows the aggregate progress percentage, Overdue Tasks flags tasks that have exceeded their deadlines, and Days Remaining counts down to the project end date.
The visual breakdown includes Task Status Distribution by Status showing how many tasks are Not Started, In Progress, Completed, or On Hold. Priority Breakdown by Priority Level helps you understand the urgency spread. Tasks by Phase segments work by project phase. Team Workload by Team Member ensures no one is overloaded. Project Completion by Timeline Progress compares planned versus actual progress, and Milestones Hit by Total Milestones tracks key project achievements.
 Dashboard – Project Gantt Chart in Google Sheets
3. Detailed Task List
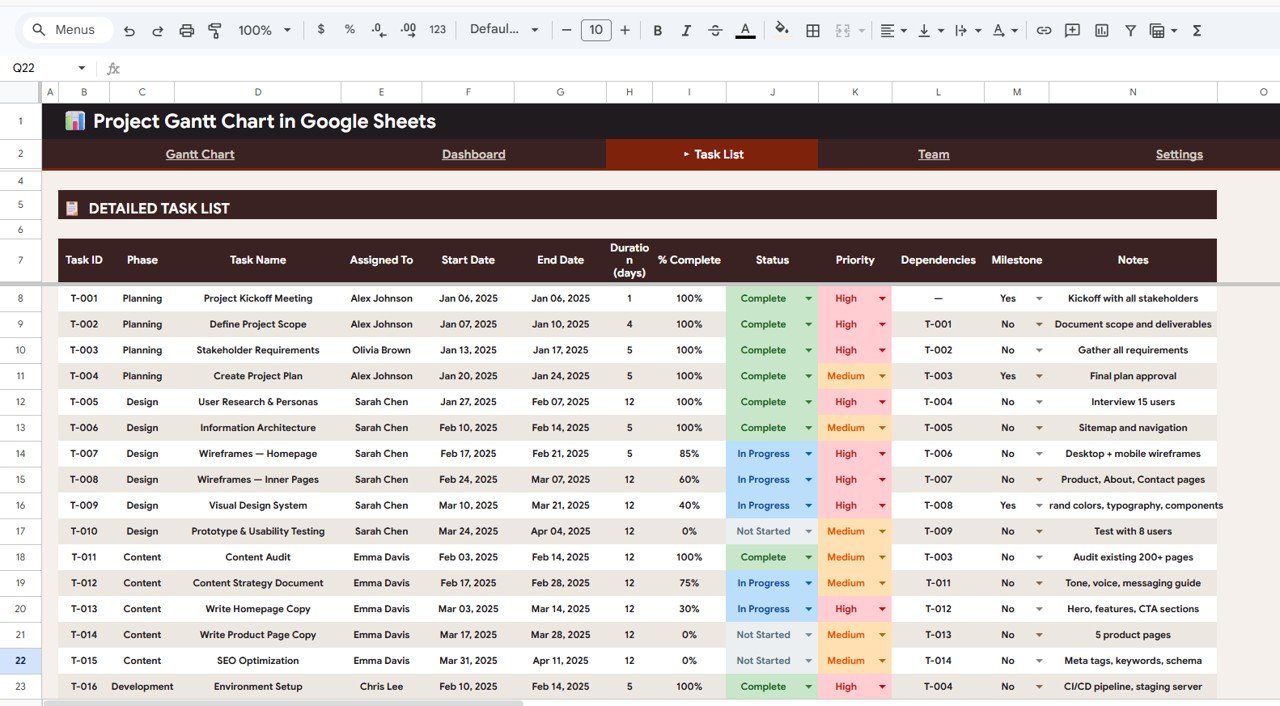
The Detailed Task List page is your complete project register. Every task is documented with full context: Task ID by Phase organizes tasks within their respective project phases. Task Name by Assigned To shows who is responsible for each deliverable. Start Date by End Date defines the task timeline window. Days by Percentage Complete tracks duration against actual progress. Status by Priority combines current state with urgency level. Dependencies by Responsible Person maps task relationships so you can understand which tasks are blocking others.
This page is essential for project workflow performance tracking and ensuring nothing falls through the cracks.
 Detailed Task List – Project Gantt Chart in Google Sheets
4. Team Members
The Team Members page serves as your project team directory. It records each Team Member Name by Role so you know everyone’s function. Email by Availability Percentage lets you quickly contact team members and understand how much capacity they have for this project. Tasks Assigned by Team Member provides a count of how many tasks each person is handling, making it straightforward to identify overloaded or underutilized team members.
For teams managing multiple projects, this page works well alongside a Project Deliverable Approval Tracker to keep both team assignments and deliverable status organized.
 Team Members – Project Gantt Chart in Google Sheets
5. Settings
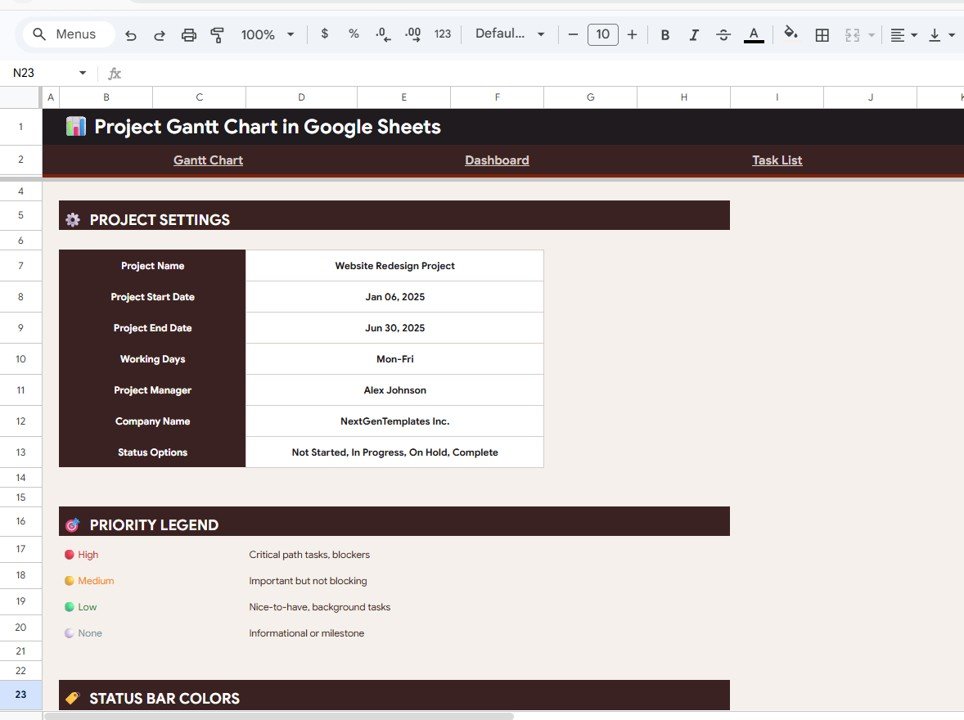
The Settings page is where you customize the entire template to match your project. Configure your Project Name, Project Start Date, Project End Date, and Working Days to define the project scope. Set the Project Manager and Company Name for documentation purposes. Define your Status Options (such as Not Started, In Progress, Completed, On Hold) so the dropdown menus and charts reflect your workflow. The Priority Legend by Priority Level sets color coding for High, Medium, and Low priorities. Status Bar Colors by Status allows you to customize the visual appearance of the Gantt Chart bars.
 Settings – Project Gantt Chart in Google Sheets
Advantages of Project Gantt Chart in Google Sheets
- Zero Learning Curve — If you know Google Sheets, you can use this template immediately. No training or onboarding needed.
- Cost Effective — Replace expensive project management tools like MS Project, Monday.com, or Smartsheet with a one-time purchase template.
- Real-Time Collaboration — Since it runs on Google Sheets, your entire team can view, edit, and update the project simultaneously from anywhere.
- Fully Automatic Calculations — All KPIs, charts, and status indicators update instantly as you enter or modify task data.
- Works on Any Device — Access your project plan from desktop, laptop, tablet, or mobile phone through Google Drive.
Opportunities for Improvement
Click here to Purchase Project Gantt Chart in Google Sheets
- Adding a Resource Allocation Gantt view showing team member capacity across weeks would enhance workforce planning capabilities.
- A Budget Tracking page linking tasks to cost estimates would transform this into a complete project control center — similar to the approach used in the Construction Progress and Cost Control Dashboard.
- Email notification integration via Google Apps Script could automate alerts for overdue tasks and upcoming milestones.
Best Practices for Using This Template
- Start with Settings — Always configure the Settings page first before entering any task data. This ensures all date calculations, status dropdowns, and color coding work correctly.
- Break Down Large Tasks — Instead of one big task, create sub-tasks with clear dependencies. This gives you more accurate progress tracking and better Gantt Chart visualization.
- Update Regularly — Set a routine (daily or weekly) to update task progress percentages. The Dashboard is only as accurate as your latest data entry.
- Use Slicers Often — The Gantt Chart page slicers are powerful. Use them in team meetings to focus on specific phases, team members, or priority levels.
- Review the Dashboard Weekly — Use the Dashboard page during weekly project review meetings to identify risks, overdue tasks, and workload imbalances early.
Explore Relevant Templates
If you found this Project Gantt Chart useful, check out these related Google Sheets project management templates:
- Project Workflow Performance Dashboard in Google Sheets — Track project workflows, team performance, and milestone completion with interactive charts.
- Project Deliverable Approval Tracker in Google Sheets — Monitor deliverable submissions, approval status, and reviewer feedback.
- Construction Progress & Cost Control Dashboard in Google Sheets — Manage construction timelines, budgets, and cost variances.
Frequently Asked Questions
Click here to Purchase Project Gantt Chart in Google Sheets
What is the best Gantt chart template for Google Sheets?
The Project Gantt Chart in Google Sheets by NextGenTemplates is one of the best options available. It includes 5 professionally designed pages — Gantt Chart, Dashboard with 10+ KPIs, Detailed Task List with dependency tracking, Team Members directory, and customizable Settings — all working automatically within Google Sheets without any add-ons.
How do I create a Gantt chart in Google Sheets?
You can create a Gantt chart from scratch using stacked bar charts and conditional formatting, but it takes considerable effort. A faster approach is to use a pre-built template like the Project Gantt Chart in Google Sheets, which comes with all formulas, charts, and formatting ready to use. Simply add your tasks and the Gantt chart generates automatically.
Can I track task dependencies with this template?
Yes. The Detailed Task List page includes a Dependencies column that maps task relationships. You can record which tasks must be completed before others can begin, helping you identify the critical path and avoid scheduling conflicts.
Is the Project Gantt Chart template suitable for Agile projects?
While this template follows a traditional Gantt Chart approach which is ideal for waterfall and hybrid project management, you can adapt it for Agile by treating sprints as phases and user stories as tasks. The Dashboard and Team Workload views work well for sprint retrospectives and capacity planning.
How many team members can I add to this template?
There is no fixed limit. The Team Members page can accommodate as many team members as your project requires. All related charts and KPIs in the Dashboard will automatically include data for every team member you add.
Does this template work on mobile devices?
Yes. Since it runs on Google Sheets, you can access and edit it from any device with the Google Sheets app or a mobile browser. However, for the best experience with charts and the Gantt Chart view, we recommend using a desktop or laptop screen.
Conclusion
The Project Gantt Chart in Google Sheets is a complete, professional project management solution that combines visual timeline tracking, comprehensive KPI analytics, detailed task management, and team coordination — all in one Google Sheets template. It eliminates the need for expensive software while giving you everything you need to keep your projects on track, on budget, and on time.
Click here to Purchase Project Gantt Chart in Google Sheets
For more project management and Google Sheets templates, visit NextGenTemplates.com.
Watch step-by-step tutorials on our YouTube channel: Youtube.com/@NeoTechNavigators