
In the textile industry, monitoring key performance indicators (KPIs) is crucial for ensuring optimal operations, maintaining quality, and maximizing efficiency. The Textile Industry KPI Dashboard in Google Sheets is a ready-to-use template designed to help textile manufacturers track their performance and make data-driven decisions.
In this article, we will explore the Textile Industry KPI Dashboard in Google Sheets, a powerful tool for monitoring important metrics in textile manufacturing. This guide will cover the dashboard’s key features, the KPIs it tracks, and how it can help improve your manufacturing processes.
Key Features of the Textile Industry KPI Dashboard in Google Sheets
Below are the key features of this dashboard template:
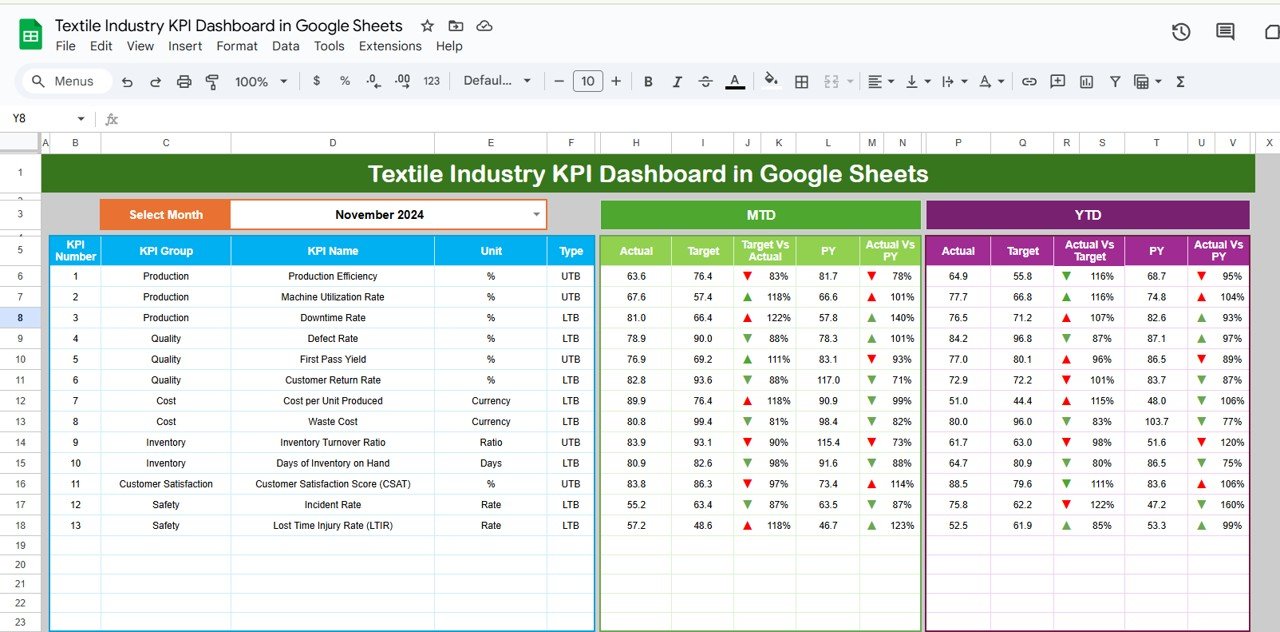
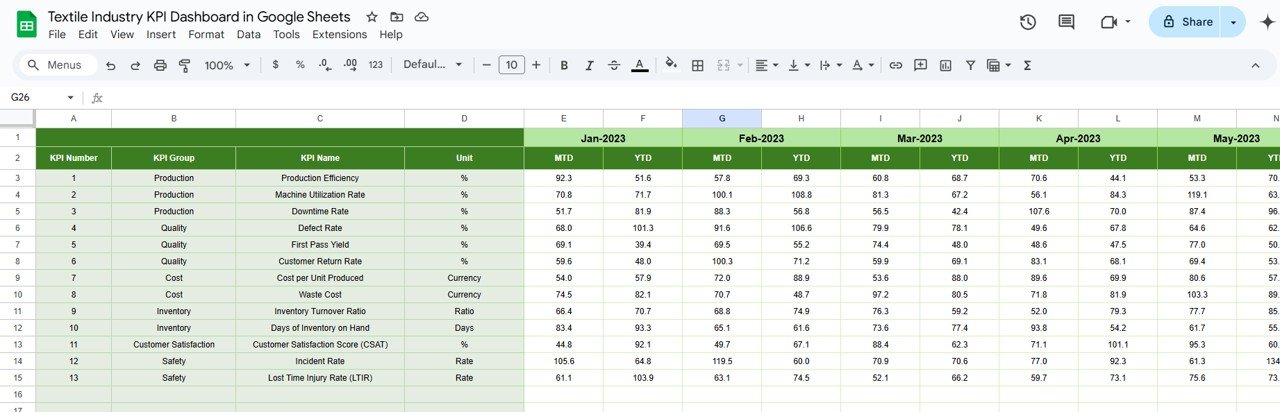
1. Dashboard Sheet Tab
This is the main sheet where all KPI data is displayed.
-
Month Selection: In Range D3, select the month from the drop-down menu, and the dashboard will update to show data for that month.
-
MTD (Month-to-Date): Displays actual numbers, target values, and comparisons with previous year data using conditional formatting (up or down arrows).
-
YTD (Year-to-Date): Shows cumulative performance with comparisons to target and previous year data.

Click to buy Textile Industry KPI Dashboard in Google Sheets
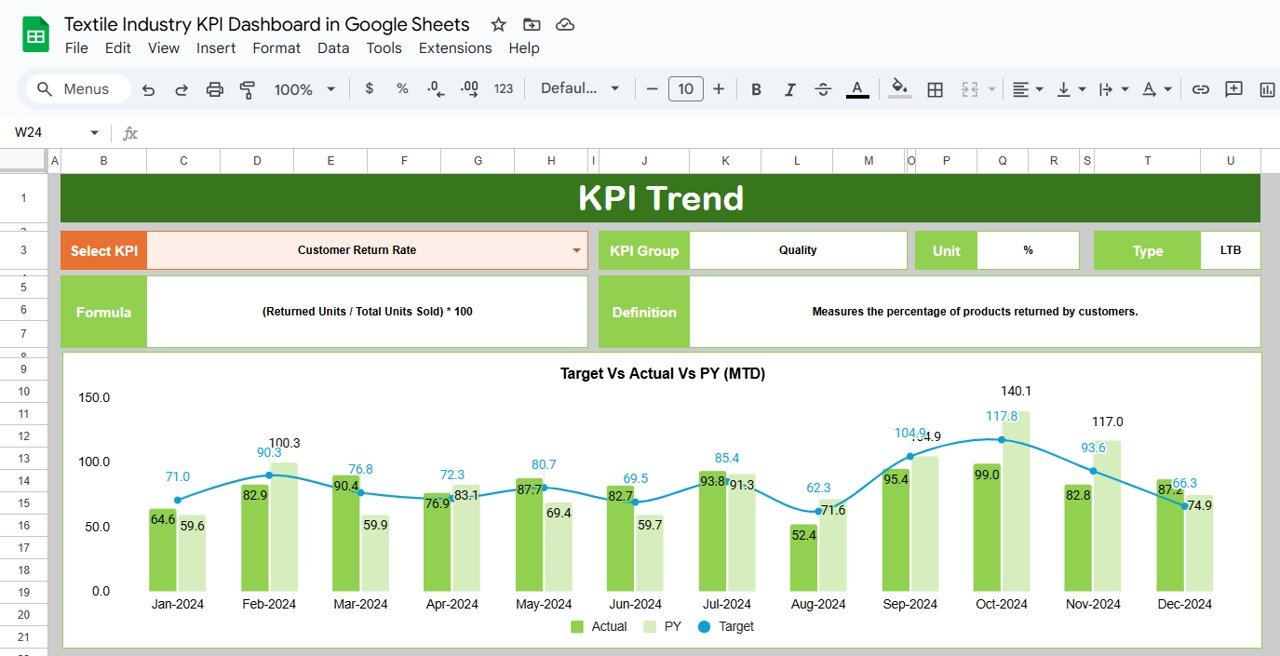
2. KPI Trend Sheet Tab
-
Select KPIs from the dropdown in Range C3.
-
Displays KPI group, unit of measure, type (Lower the Better or Upper the Better), formula, and KPI definition.

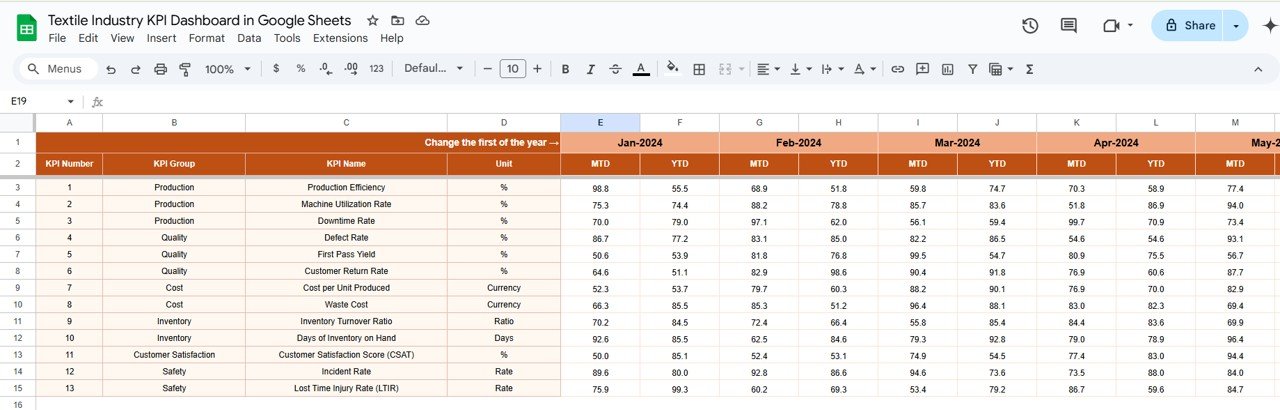
3. Actual Number Sheet Tab
-
Input actual numbers for MTD and YTD for the selected month.
-
The month selection is available in Range E1, where you input the first month of the year.

Click to buy Textile Industry KPI Dashboard in Google Sheets
4. Target Sheet Tab
-
Enter target values for each KPI for MTD and YTD.
-
Helps track performance against the set goals.

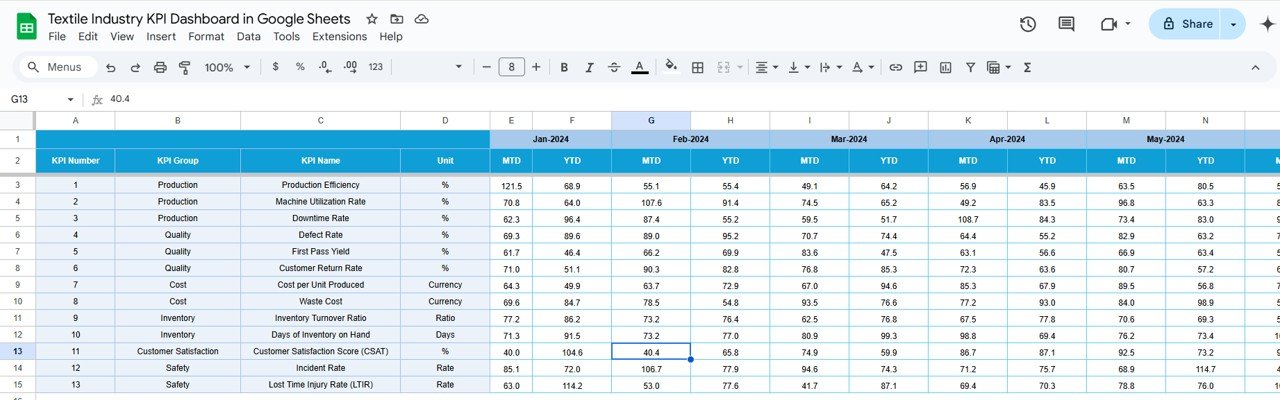
5. Previous Year Number Sheet Tab
Click to buy Textile Industry KPI Dashboard in Google Sheets
-
Enter the previous year’s data to enable year-over-year comparisons.
-
This data should be entered in the same format as the current year to maintain consistency.

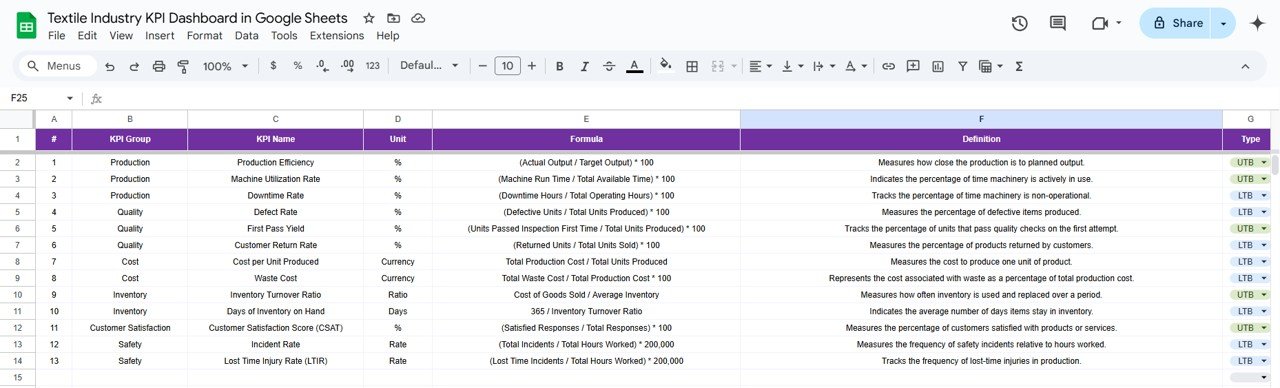
6. KPI Definition Sheet Tab
This sheet contains detailed information for each KPI, including:
- KPI Name
- KPI Group
- Unit of Measure
- Formula for KPI Calculation
- Definition of the KPI

Click to buy Textile Industry KPI Dashboard in Google Sheets
Advantages of Using the Textile Industry KPI Dashboard in Google Sheets
The Textile Industry KPI Dashboard in Google Sheets offers several benefits:
-
Real-Time Monitoring: Track KPIs in real-time, allowing for quick decision-making and operational improvements.
-
Customizable Templates: Easily modify the dashboard to track specific KPIs relevant to your textile manufacturing goals.
-
Cost-Effective: Google Sheets is free and easily accessible, making it an affordable solution for textile manufacturers.
-
Cloud-Based Collaboration: Share the dashboard with team members or management for collaborative decision-making.
-
Accessibility: Access the dashboard from any device with internet connectivity, making it easy to manage manufacturing performance from anywhere.
Opportunities for Improvement in the Textile Industry KPI Dashboard
While the Textile Industry KPI Dashboard in Google Sheets is a powerful tool, there are opportunities for improvement:
Automating Data Entry:
- Current Challenge: Manual data entry can be time-consuming and prone to errors.
- Opportunity: Integrate the dashboard with other systems (e.g., ERP software) to automate data entry and improve accuracy.
Advanced Visualizations:
- Current Challenge: The dashboard currently offers basic visualizations.
- Opportunity: Add advanced visualizations, such as heatmaps, sparklines, and interactive charts, to provide better insights and trend analysis.
Customizable Reporting:
- Current Challenge: Reporting is limited to basic metrics.
- Opportunity: Enhance reporting capabilities by adding customizable report generation features, such as exporting to PDF or automated email summaries.
Best Practices for Using the Textile Industry KPI Dashboard
Click to buy Textile Industry KPI Dashboard in Google Sheets
To get the most out of the Textile Industry KPI Dashboard in Google Sheets, consider these best practices:
-
Update Regularly: Ensure that data is updated at least once a month to maintain accurate insights into production performance.
-
Set Realistic Targets: Use historical data and industry benchmarks to set achievable goals for production efficiency and cost management.
-
Review KPIs Frequently: Regularly review KPIs to assess production efficiency and identify areas for improvement.
-
Collaborate Across Teams: Share the dashboard with relevant team members for better alignment and communication on production goals and performance.
-
Leverage Conditional Formatting: Use color coding or up/down arrows to quickly highlight areas needing attention, such as increased defect rates or downtime.
Conclusion
The Textile Industry KPI Dashboard in Google Sheets is a valuable tool for textile manufacturers to track key metrics, improve production efficiency, and reduce operational costs. By using this dashboard, businesses can make data-driven decisions, streamline operations, and enhance overall performance.
Frequently Asked Questions (FAQs)
What is a KPI in the textile industry?
A KPI (Key Performance Indicator) is a measurable value used to track the performance of manufacturing operations. Common KPIs include defect rate, production efficiency, and energy consumption.
How do I customize my Textile Industry KPI Dashboard?
The dashboard is customizable, allowing you to add or remove KPIs, adjust formulas, and modify data sources according to your manufacturing goals.
How do I enter data into the Textile Industry KPI Dashboard?
Simply input actual numbers for MTD and YTD in the relevant sheets (Actual Numbers Sheet, Target Sheet, Previous Year Numbers Sheet) for each month.
Can I automate data entry? Yes, you can integrate the dashboard with other systems like ERP or manufacturing software to automate data entry, improving efficiency and accuracy.
Which KPIs should I track in the textile industry?
Essential KPIs for the textile industry include production efficiency, defect rate, energy consumption per unit, and order fulfillment time.
Visit our YouTube channel to learn step-by-step video tutorials
Youtube.com/@NeotechNavigators
Click to buy Textile Industry KPI Dashboard in Google Sheets