Business development plays a crucial role in the growth and success of any organization. Companies constantly track sales performance, revenue growth, marketing spend, customer acquisition, and profitability to evaluate business performance. However, managing this information across multiple spreadsheets and reports can quickly become complicated.Business Development Dashboard in Google Sheets
Because businesses generate large volumes of operational and financial data, decision-makers need a structured way to analyze this information. Without proper visualization tools, it becomes difficult to identify trends, evaluate performance, and make strategic decisions.
Therefore, organizations increasingly rely on business intelligence dashboards to transform raw data into meaningful insights. One highly effective solution is the Business Development Dashboard in Google Sheets.Business Development Dashboard in Google Sheets
The Business Development Dashboard in Google Sheets is a powerful analytics tool that helps organizations monitor key performance metrics such as revenue, profit, marketing spend, sales channels, and product performance. Because Google Sheets allows real-time collaboration and dynamic calculations, businesses can easily track performance and make data-driven decisions.
In this article, you will learn everything about the Business Development Dashboard in Google Sheets, including its structure, features, advantages, best practices, and frequently asked questions.Business Development Dashboard in Google Sheets
What is a Business Development Dashboard in Google Sheets?
A Business Development Dashboard in Google Sheets is an interactive reporting dashboard designed to analyze business performance using key metrics, charts, and filters.
The dashboard consolidates important business data into a single visual interface. As a result, managers and executives can quickly monitor performance trends and identify growth opportunities.
Typically, the dashboard tracks the following metrics:
- Total Revenue
- Cost of Goods Sold (COGS)
- Profit
- Marketing Spend
- Units Sold
- Sales Channel Performance
- Regional Sales Performance
- Product Category Performance
- Monthly Business Trends
Because Google Sheets automatically updates formulas and charts, users can analyze real-time business data without manually creating multiple reports.
Key Features of the Business Development Dashboard in Google Sheets
Click to Buy Business Development Dashboard in Google Sheets
The Business Development Dashboard in Google Sheets contains multiple analytical sections that provide deep insights into business performance.
The dashboard uses filters, KPI cards, and charts to make analysis simple and effective.
Overview Dashboard
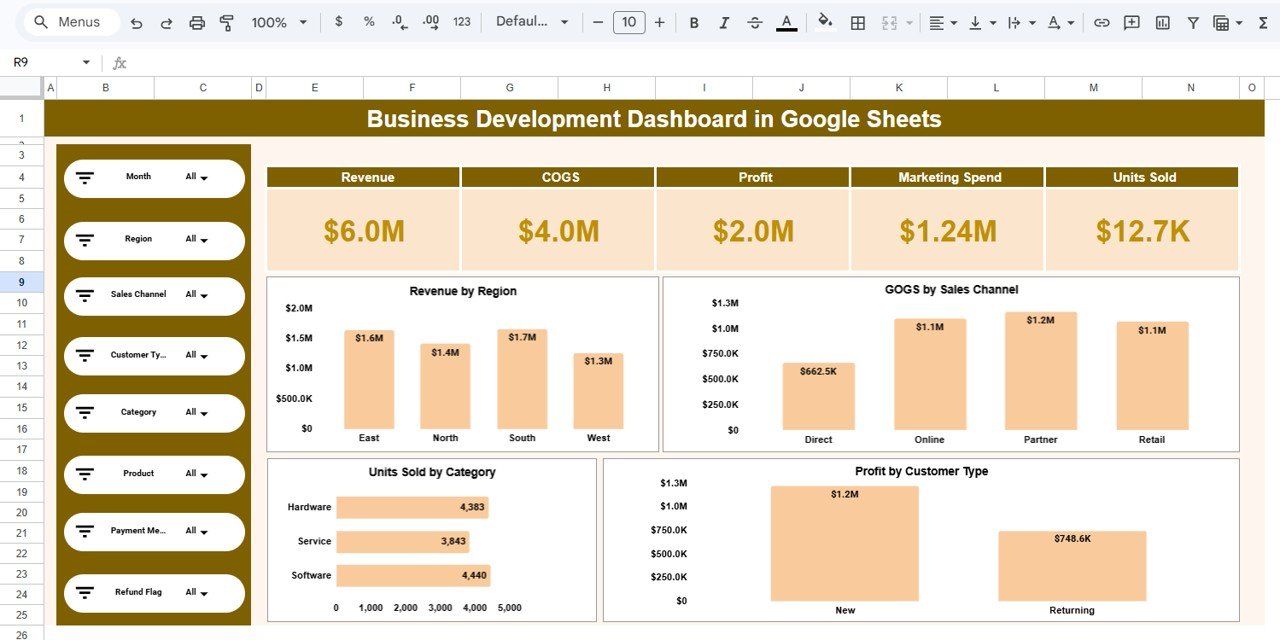
The Overview Dashboard provides a quick summary of the overall business performance.
This section displays key performance indicators using large KPI cards.
Key Metrics Displayed
The dashboard shows the following metrics:
-
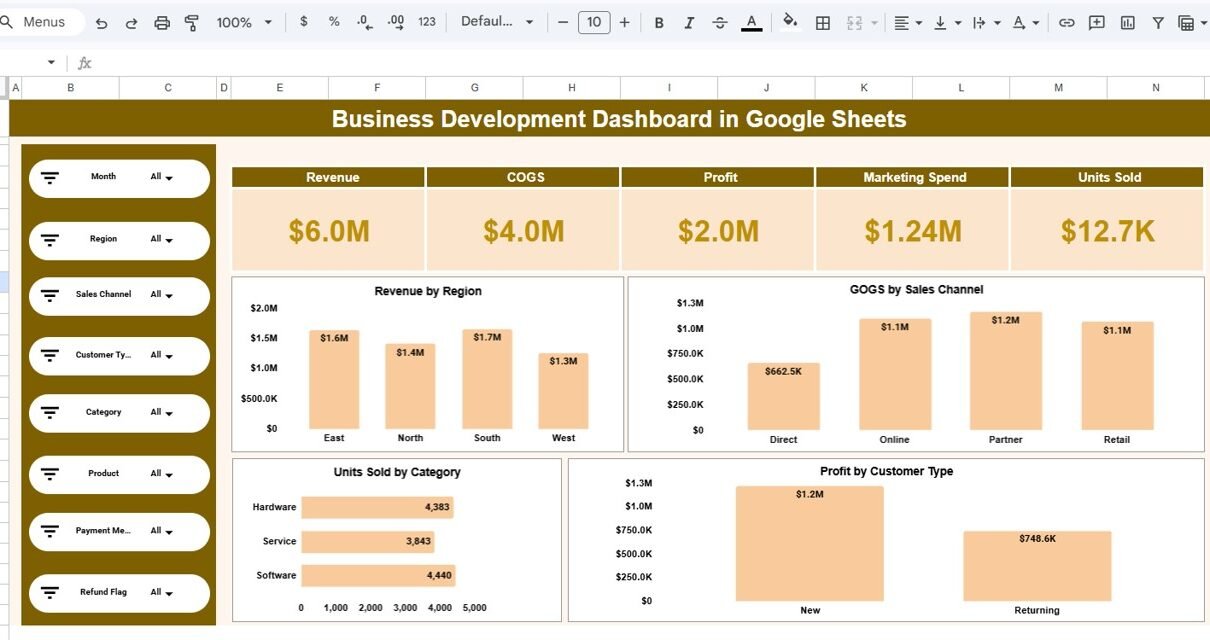
Revenue: $6.0M
-
COGS (Cost of Goods Sold): $4.0M
-
Profit: $2.0M
-
Marketing Spend: $1.24M
-
Units Sold: 12.7K
These metrics allow decision-makers to quickly evaluate the company’s financial health.
Interactive Filters for Data Analysis
On the left side of the dashboard, several interactive filters allow users to customize the analysis.
Users can filter the dashboard by:
- Month
- Region
- Sales Channel
- Customer Type
- Category
- Product
- Payment Method
- Refund Status
Because these filters dynamically update charts, users can analyze specific segments of data instantly.
Click to Buy Business Development Dashboard in Google Sheets
Revenue Analysis by Region
Understanding regional sales performance is essential for business growth.
The dashboard includes a Revenue by Region chart that shows how different regions contribute to total revenue.
Example regional revenue distribution:
-
East – $1.6M
-
North – $1.4M
-
South – $1.7M
-
West – $1.3M
This analysis helps businesses identify strong markets and underperforming regions.
For example, if the South region generates the highest revenue, companies may increase marketing investment there.
COGS Analysis by Sales Channel
The dashboard also tracks Cost of Goods Sold (COGS) by sales channel.
This analysis helps businesses understand operational costs associated with different distribution channels.
Example COGS distribution:
-
Direct – $662.5K
-
Online – $1.1M
-
Partner – $1.2M
-
Retail – $1.1M
By analyzing these numbers, organizations can identify which channels operate more efficiently.
Units Sold by Product Category
Product performance plays a significant role in business development. Therefore, the dashboard tracks units sold by category.
Example data includes:
-
Hardware – 4,383 units
-
Service – 3,843 units
-
Software – 4,440 units
This analysis allows businesses to determine which product categories generate the highest demand.
Consequently, companies can focus marketing efforts on high-performing categories.
Profit Analysis by Customer Type
Another important feature of the dashboard is profit analysis by customer type.
This section compares profits generated from:
-
New Customers
-
Returning Customers
Example:
-
New Customers – $1.2M
-
Returning Customers – $748.6K
This insight helps organizations evaluate customer acquisition strategies.
For example, if new customers generate more profit, businesses may invest more in customer acquisition campaigns.
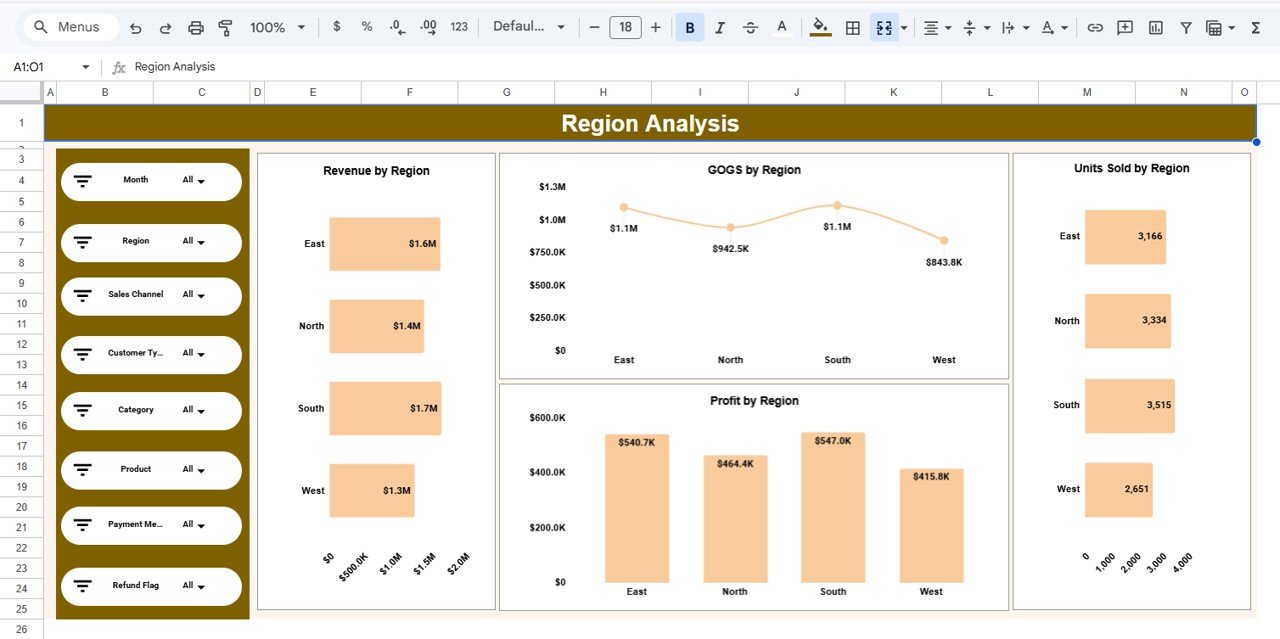
Region Analysis Dashboard
The Region Analysis Page provides deeper insights into regional performance.
This page includes charts such as:
-
Revenue by Region
-
COGS by Region
-
Profit by Region
-
Units Sold by Region
These insights allow businesses to understand regional sales trends and operational costs.
Managers can use this information to allocate resources effectively.
Click to Buy Business Development Dashboard in Google Sheets
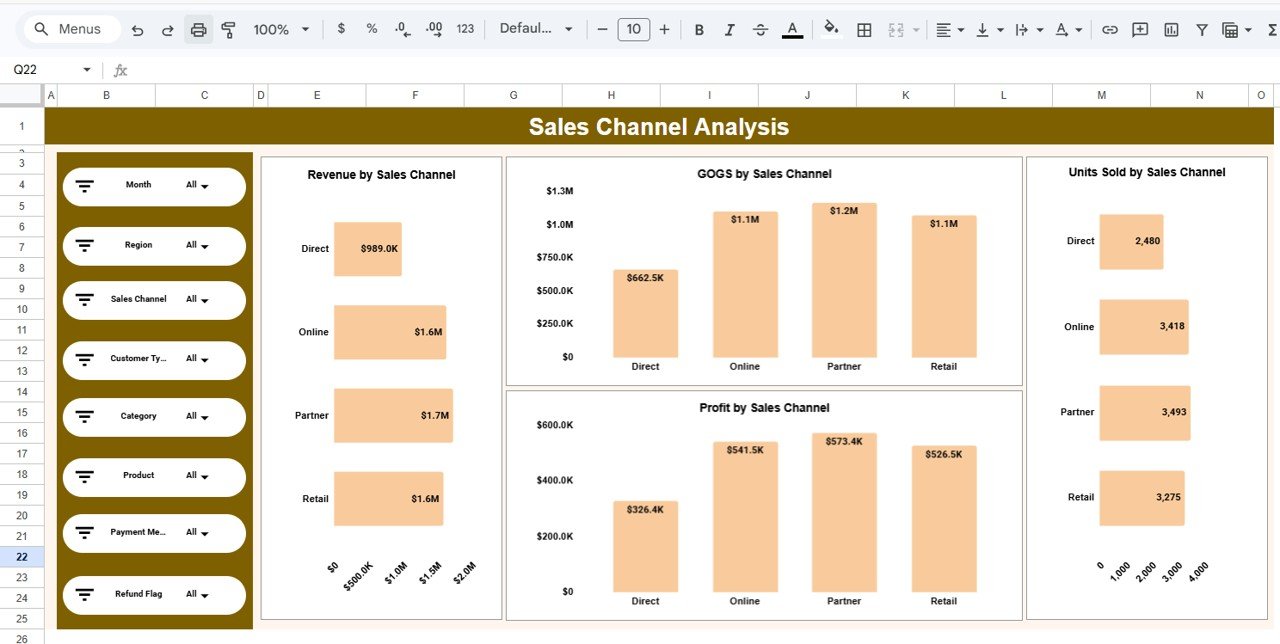
Sales Channel Analysis Dashboard
Sales channels often influence revenue performance.
The Sales Channel Analysis Page helps organizations analyze channel performance through charts such as:
-
Revenue by Sales Channel
-
COGS by Sales Channel
-
Profit by Sales Channel
-
Units Sold by Sales Channel
Example revenue by sales channel:
-
Direct – $989K
-
Online – $1.6M
-
Partner – $1.7M
-
Retail – $1.6M
This information helps businesses identify the most profitable distribution channels.
Click to Buy Business Development Dashboard in Google Sheets
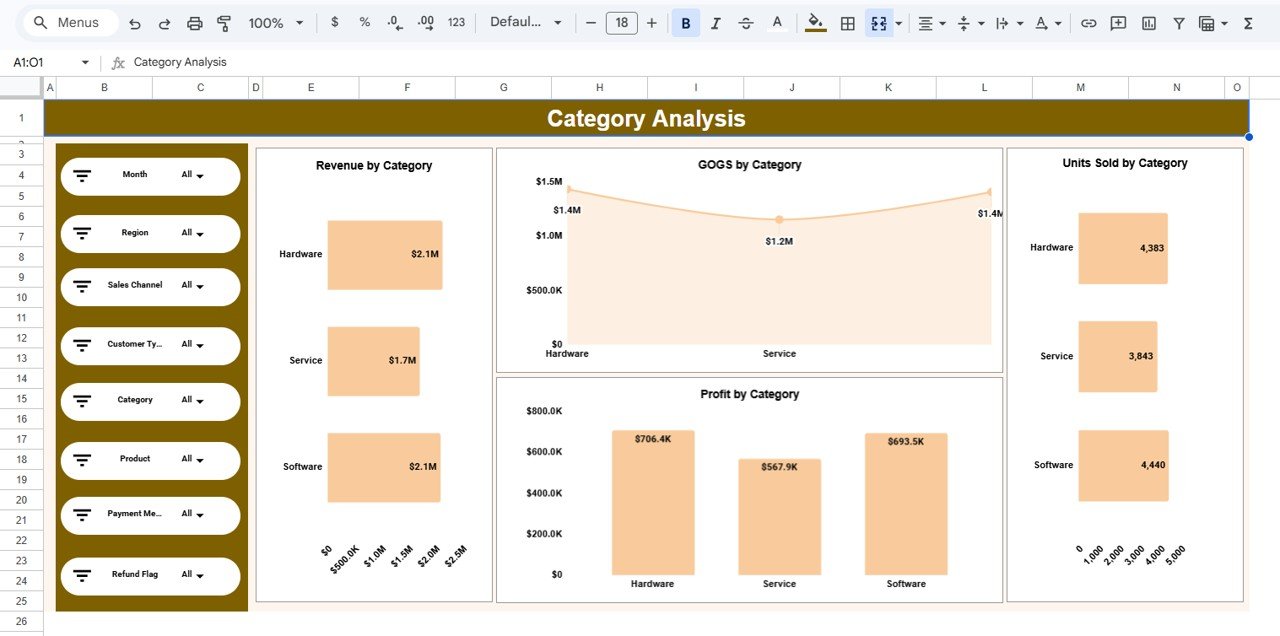
Category Analysis Dashboard
The Category Analysis Page focuses on product category performance.
This page includes charts such as:
-
Revenue by Category
-
COGS by Category
-
Profit by Category
-
Units Sold by Category
Example revenue distribution:
-
Hardware – $2.1M
-
Service – $1.7M
-
Software – $2.1M
This analysis helps companies evaluate product demand and profitability.
Click to Buy Business Development Dashboard in Google Sheets
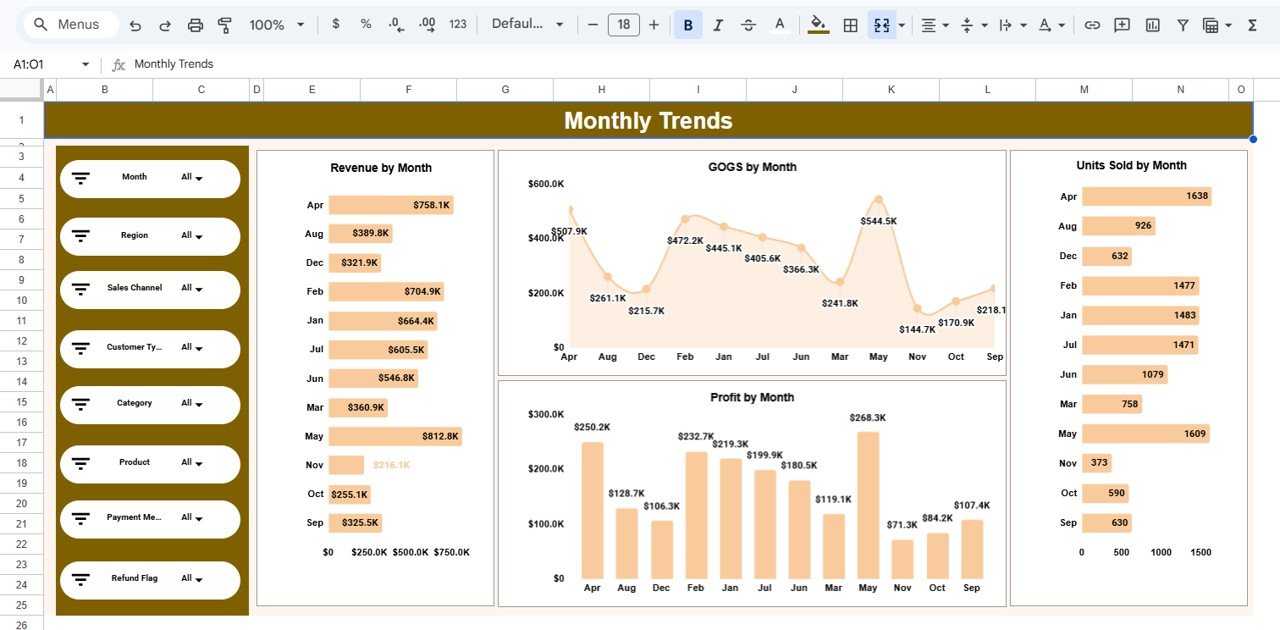
Monthly Trends Analysis
Business performance changes throughout the year. Therefore, the dashboard includes a Monthly Trends Page.
This section tracks:
- Revenue by Month
- COGS by Month
- Profit by Month
- Units Sold by Month
By analyzing monthly trends, businesses can identify seasonal patterns.
For example, revenue may increase during holiday seasons or promotional campaigns.
Click to Buy Business Development Dashboard in Google Sheets
Advantages of Business Development Dashboard in Google Sheets
Using a Google Sheets dashboard provides several benefits.
Real-Time Collaboration
Multiple users can access and update the dashboard simultaneously.
Easy Accessibility
Users can access the dashboard from any device with internet access.
Automated Calculations
Google Sheets automatically updates formulas and charts when new data is entered.
Cost-Effective Solution
Unlike expensive business intelligence tools, Google Sheets provides a powerful analytics solution at minimal cost.
Improved Data Visualization
Charts and visual indicators make complex business data easier to understand.
Opportunities for Improvement
Although the dashboard already provides powerful analytics, organizations can enhance it further.
Integration with CRM Systems
Connecting the dashboard to CRM platforms can automate sales data updates.
Predictive Sales Forecasting
Machine learning models can help predict future revenue trends.
Customer Segmentation Analysis
Analyzing customer demographics can reveal valuable insights.
Advanced Data Visualization
Additional charts and heatmaps can improve data interpretation.
Best Practices for the Business Development Dashboard
Click to Buy Business Development Dashboard in Google Sheets
Organizations should follow these best practices when using business dashboards.
Focus on Key Metrics
Tracking too many metrics can confuse users. Instead, focus on critical KPIs.
Maintain Clean Data
Accurate data ensures reliable analysis.
Update Data Regularly
Frequent updates help managers track performance effectively.
Use Interactive Filters
Filters allow users to explore different business segments.
Optimize Dashboard Layout
Important KPIs should appear at the top for quick analysis.
Conclusion
The Business Development Dashboard in Google Sheets provides a powerful solution for monitoring and analyzing business performance. Because companies generate large amounts of financial and operational data, they need tools that transform raw numbers into actionable insights.
This dashboard simplifies data analysis by combining key performance indicators, charts, and interactive filters into a single platform. Through sections such as revenue analysis, sales channel analysis, category performance, and monthly trends, businesses can gain a comprehensive view of their operations.
Moreover, Google Sheets enables real-time collaboration, automatic calculations, and easy accessibility. As a result, teams can analyze performance quickly and make better business decisions.
Organizations that leverage data-driven dashboards like this one can improve strategic planning, optimize marketing efforts, and drive sustainable business growth.
Frequently Asked Questions (FAQs)
Click to Buy Business Development Dashboard in Google Sheets
What is a Business Development Dashboard?
A Business Development Dashboard is a reporting tool that tracks important business metrics such as revenue, profit, sales performance, and marketing results.
Why use Google Sheets for business dashboards?
Google Sheets offers real-time collaboration, automatic calculations, and easy access from anywhere.
What metrics are included in the dashboard?
The dashboard tracks revenue, COGS, profit, marketing spend, units sold, regional performance, sales channels, and monthly trends.
Can this dashboard be customized?
Yes. Businesses can modify KPIs, charts, and filters according to their requirements.
Who should use the Business Development Dashboard?
Business managers, sales teams, marketing analysts, and executives can all benefit from this dashboard.
Visit our YouTube channel to learn step-by-step video tutorials
Youtube.com/@NeotechNavigators
Watch the step-by-step video tutorial:
Click to Buy Business Development Dashboard in Google Sheets