Introduction
The Profitability Analysis KPI Dashboard in Google Sheets is a powerful, ready-to-use template designed to help businesses monitor and analyze their key profitability indicators effectively. With a user-friendly interface and dynamic data visualization, this dashboard empowers decision-makers to track actual performance against targets and previous year results with ease.Profitability Analysis KPI Dashboard in Google Sheets
Key Features of Profitability Analysis KPI Dashboard in Google Sheets
- Interactive month selector that updates all dashboard metrics instantly.
- Comparison of Month-to-Date (MTD) and Year-to-Date (YTD) Actual, Target, and Previous Year (PY) data.
- Conditional formatting highlights performance trends using up and down arrows for quick visual insights.
- Six well-structured worksheets for comprehensive data input and visualization, making data management streamlined.
Dashboard Pages Explanation
Click to Buy Profitability Analysis KPI Dashboard in Google Sheets
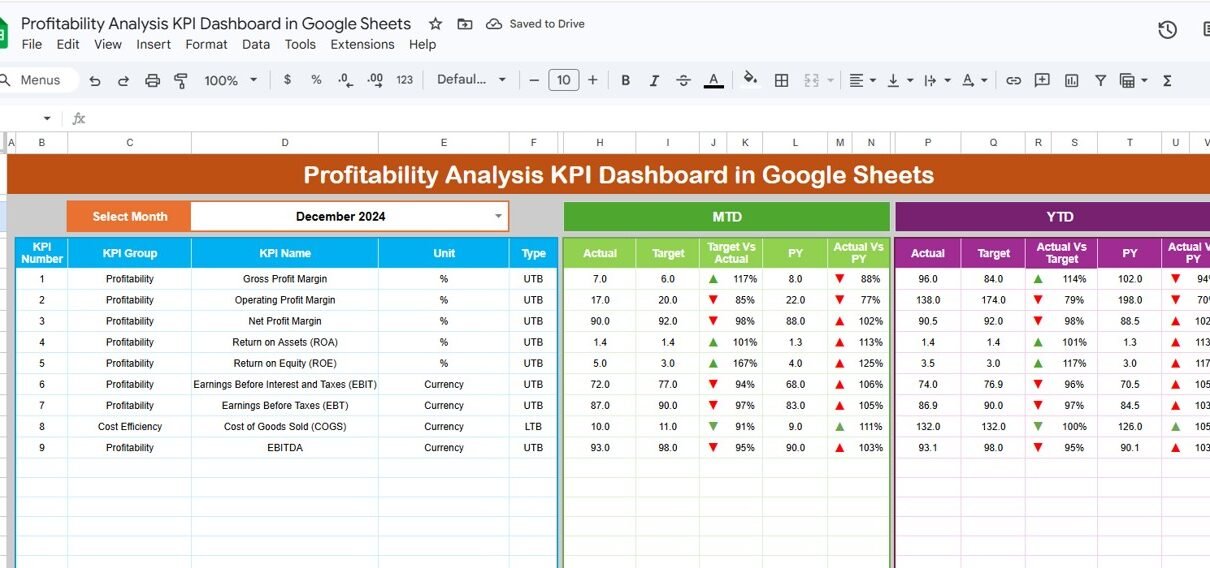
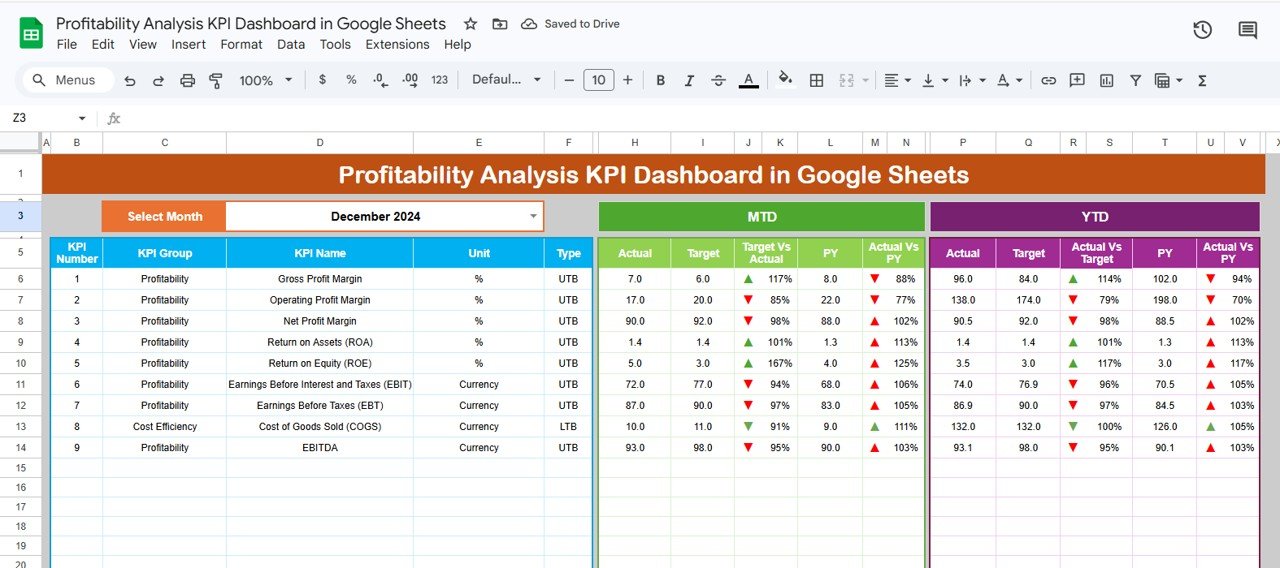
1. Dashboard Sheet Tab
This is the heart of the Profitability Analysis KPI Dashboard in Google Sheets. Here you can select the desired month (cell D3) from a dropdown menu to view updated MTD and YTD KPIs. It showcases actuals, targets, and previous year data side by side, while conditional formatting arrows indicate whether performance is above or below targets and prior year values. This provides an at-a-glance understanding of profitability trends.Profitability Analysis KPI Dashboard in Google Sheets
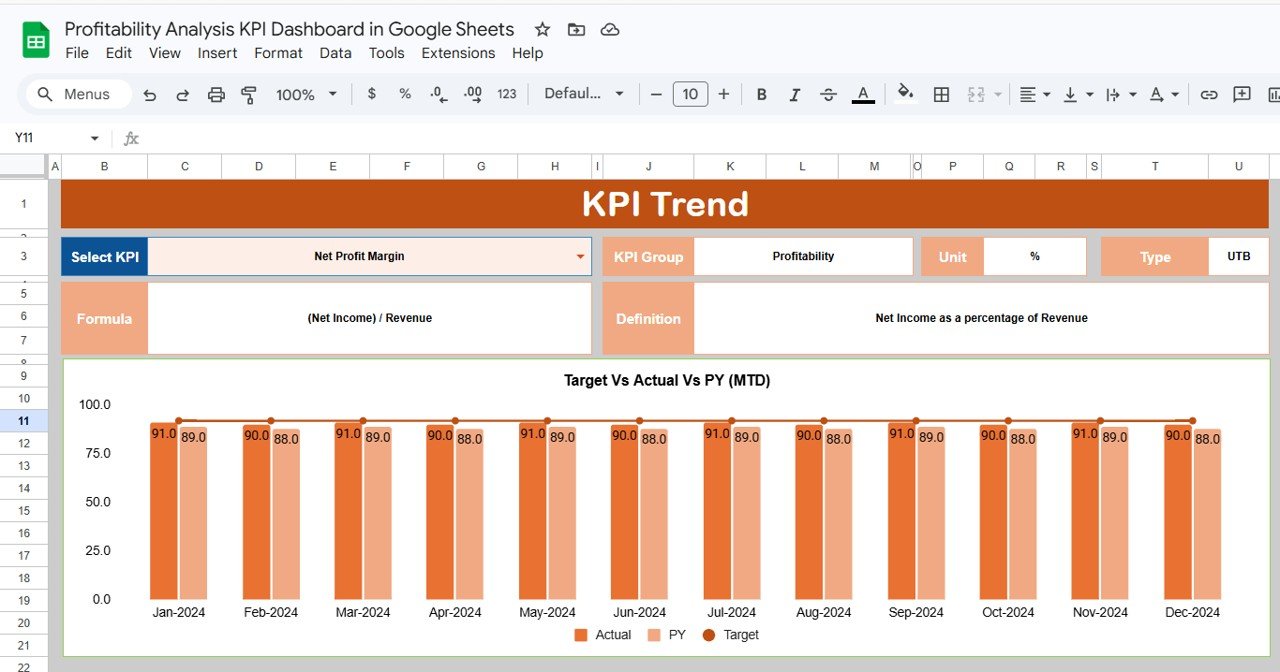
2. KPI Trend Sheet Tab
Click to Buy Profitability Analysis KPI Dashboard in Google Sheets
On this sheet, users can select a specific KPI (dropdown in cell C3) to analyze detailed trends. It displays the KPI group, unit, type (whether lower or upper the better), formula, and a clear definition for better understanding. The sheet also includes MTD and YTD trend charts illustrating actual, target, and previous year performance, enabling visual tracking of KPI movements over time.Profitability Analysis KPI Dashboard in Google Sheets
Click to Buy Profitability Analysis KPI Dashboard in Google Sheets
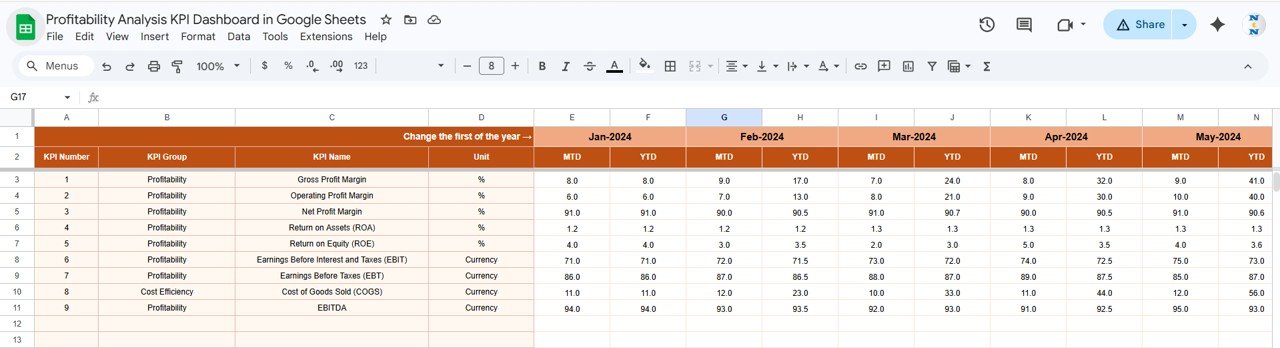
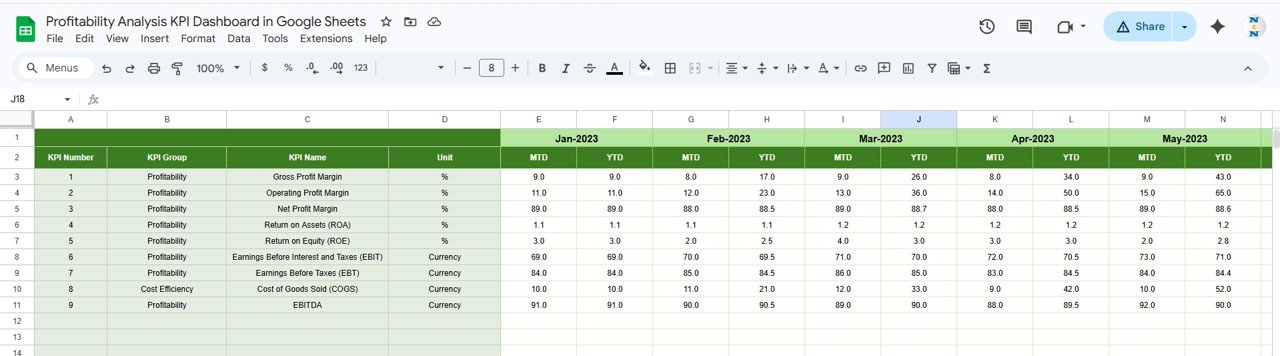
3. Actual Numbers Input Sheet
This sheet is where you enter the actual MTD and YTD numbers for each KPI. You can set the starting month of the year using cell E1, allowing the dashboard to adjust dynamically based on your fiscal calendar. Accuracy here is crucial for reliable KPI reporting.Profitability Analysis KPI Dashboard in Google Sheets
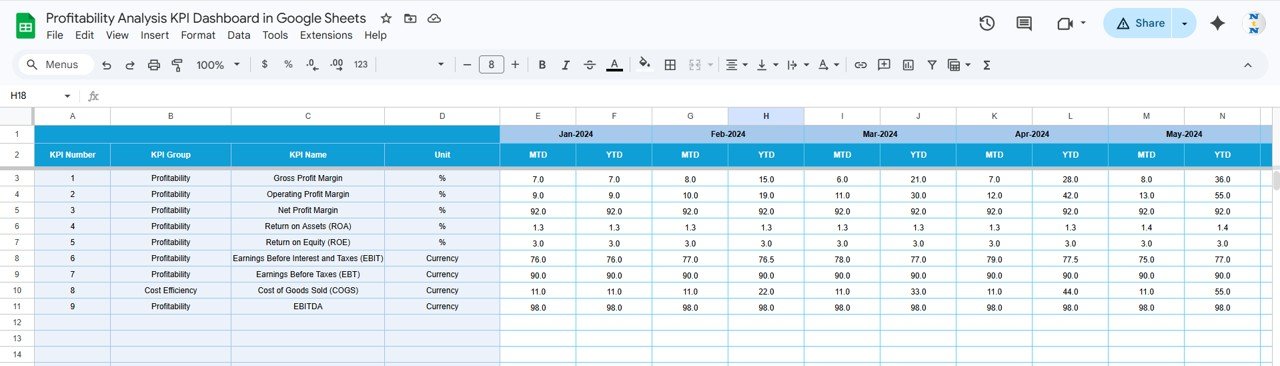
4. Target Number Input Sheet
This tab is used to input target values for each KPI for both MTD and YTD periods. Regular updates of target figures ensure the dashboard reflects realistic and relevant goals for performance measurement.
Click to Buy Profitability Analysis KPI Dashboard in Google Sheets
5. Previous Year Number Sheet Tab
This sheet enables input of data for the previous year, perfectly mirroring the current year’s format. This allows direct comparison, giving you valuable insights into growth and performance changes year over year.
Click to Buy Profitability Analysis KPI Dashboard in Google Sheets
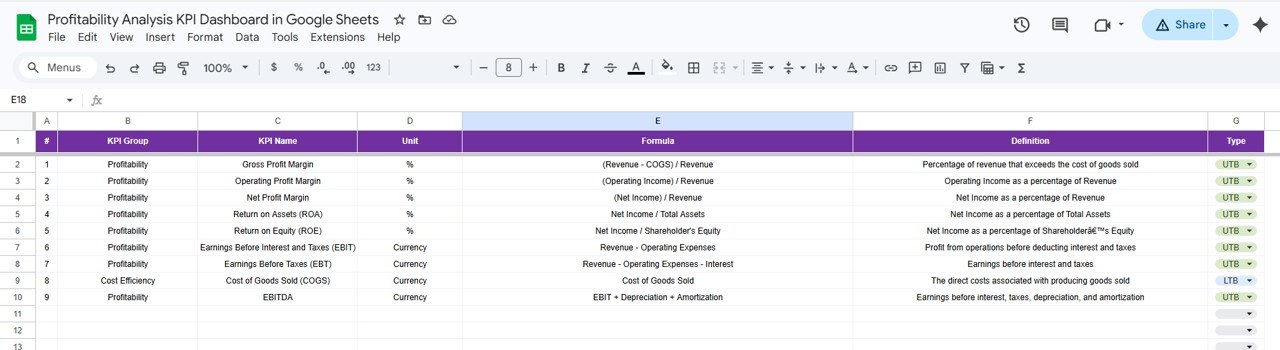
6. KPI Definition Sheet Tab
The foundation of all KPIs, this tab contains fields to enter KPI Name, Group, Unit, Formula, and a detailed definition. Additionally, it categorizes KPIs based on whether ‘Lower The Better (LTB)’ or ‘Upper The Better (UTB)’, guiding how performance trends and conditional formatting behave across the dashboard.
Advantages of Profitability Analysis KPI Dashboard in Google Sheets
Click to Buy Profitability Analysis KPI Dashboard in Google Sheets
- Accessibility: Cloud-based Google Sheets allows multiple team members to access and update data in real time.
- Cost effective: Free to use with a Google account, eliminating expensive software costs.
- Customization: Easily modify KPIs, formulas, and visuals to suit specific business needs.
- Data-driven insights: Immediate visibility of performance gaps and success drivers via dynamic charts and conditional formatting.
- User-friendly Interface: Clear navigation through well-named worksheets minimizes training time for new users.
Opportunities for Improvement
- Integrate automated data imports from other business systems (ERP, CRM) to reduce manual data entry.
- Add drill-down capabilities for deeper analysis of specific KPIs or departments within the dashboard.
- Enhance mobile responsiveness to facilitate easy use on smartphones and tablets.
- Include more advanced visualization options like heatmaps or bullet charts for trend analysis.
Best Practices
Click to Buy Profitability Analysis KPI Dashboard in Google Sheets
- Maintain consistent and accurate data entry schedules to ensure dashboard reliability.
- Regularly update KPI definitions and targets to align with evolving business objectives.
- Leverage the trend charts to proactively identify performance issues before they impact profitability.
- Train your team on interpreting dashboard signals such as color codes and arrows for swift decision-making.
FAQs
Can I add more KPIs to this dashboard?
Yes, the KPI Definition sheet allows you to add additional KPIs. Make sure to fill all relevant columns and update formulas if necessary.
Is this dashboard suitable for all types of businesses?
Absolutely! It is designed to be flexible and customizable for various industries and company sizes.
Can this dashboard be used collaboratively?
Yes, since it is built in Google Sheets, multiple users can collaborate and update data simultaneously with proper access controls.
How is conditional formatting applied?
Based on whether the KPI is defined as ‘Lower the Better’ or ‘Upper the Better’, conditional formatting triggers up/down arrows to represent performance trends compared to targets and previous year numbers.
Conclusion
Click to Buy Profitability Analysis KPI Dashboard in Google Sheets
The Profitability Analysis KPI Dashboard in Google Sheets is an invaluable tool for businesses aiming to enhance profitability tracking without incurring additional costs or complexity. Its combination of clear visualizations, dynamic updates, and comprehensive data sheets ensures that every user can derive actionable insights efficiently. By adopting this dashboard, organizations can make data-driven decisions, identify growth opportunities, and stay ahead in competitive markets.
For further learning and a step-by-step demo, visit our YouTube channel to watch the demo.
Also, explore detailed KPI and dashboard best practices on Microsoft Excel support for additional inspirations.
Click to Buy Profitability Analysis KPI Dashboard in Google Sheets