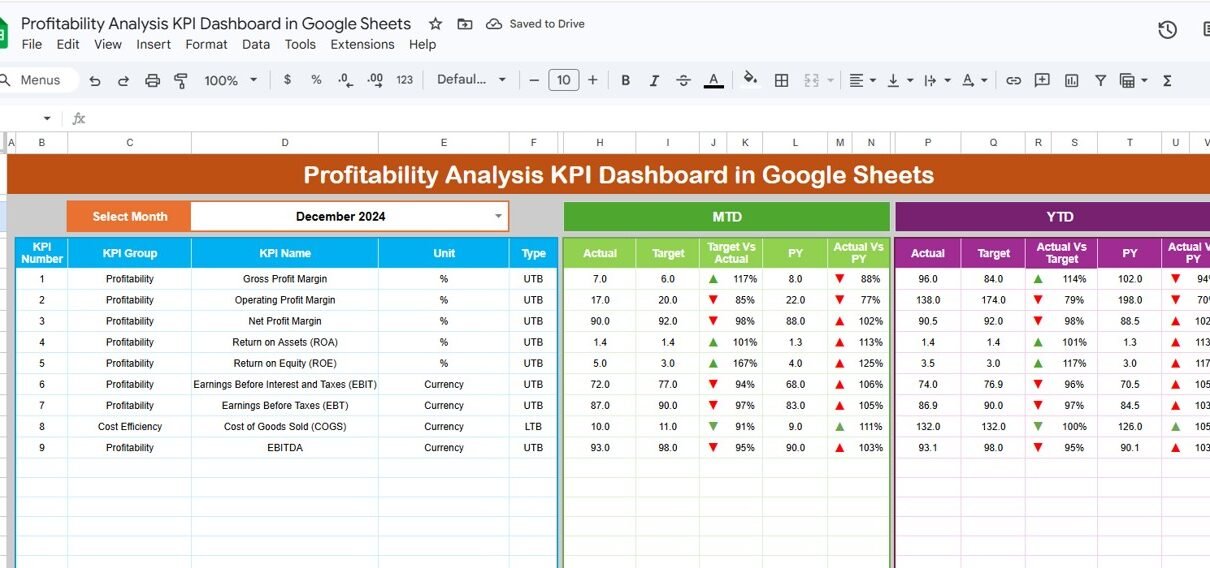
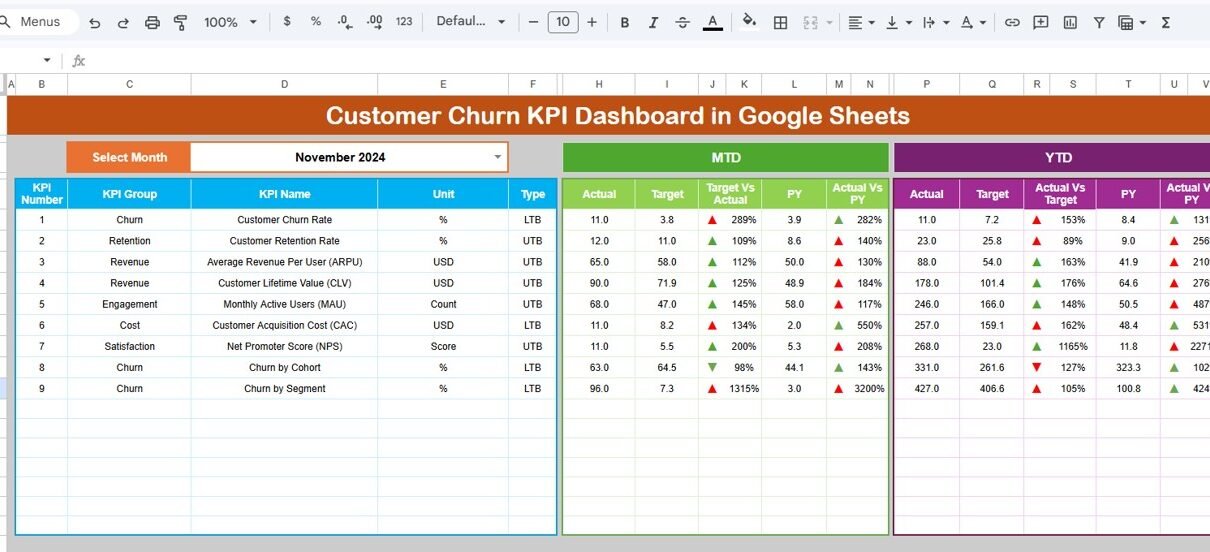
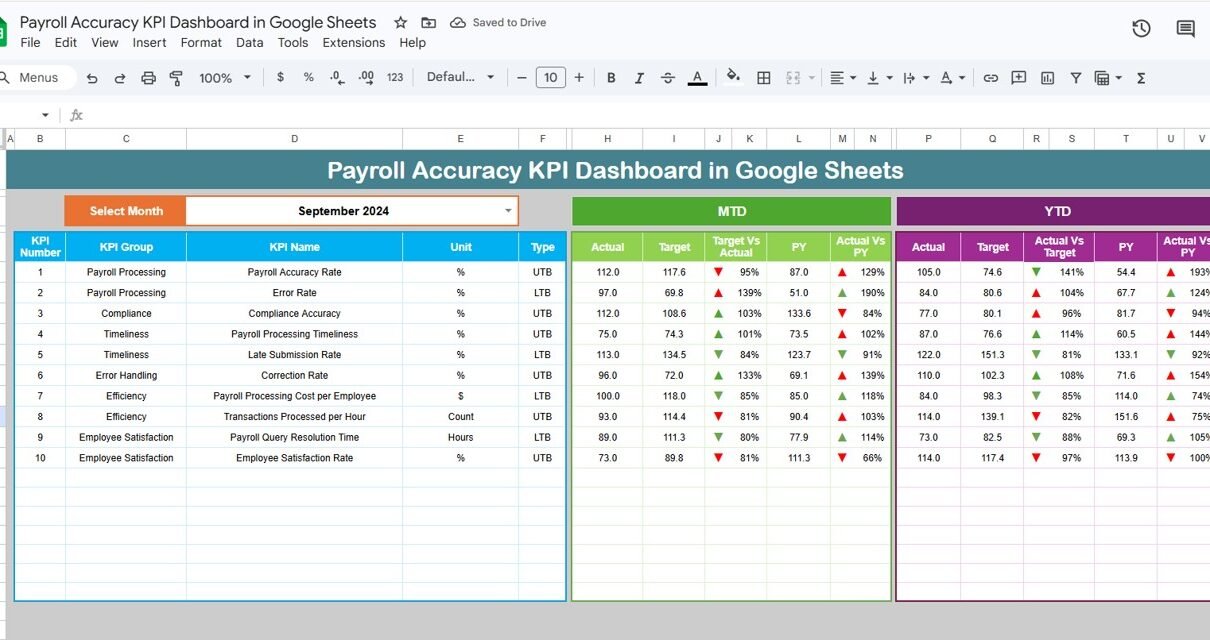
Legal KPI Dashboard in Google Sheets
In the fast-paced legal environment, staying on top of key performance indicators (KPIs) is essential for tracking progress, improving efficiency, and ensuring smooth operations. A Legal KPI Dashboard in Google…
Online Tutorial for Data Analysis and Automation
In the fast-paced legal environment, staying on top of key performance indicators (KPIs) is essential for tracking progress, improving efficiency, and ensuring smooth operations. A Legal KPI Dashboard in Google…
In today’s competitive pharmaceutical industry, tracking key performance indicators (KPIs) is essential for monitoring the performance of various processes, improving decision-making, and ensuring efficiency. Whether it’s managing inventory, production cycles,…
The media and entertainment industry thrives on creativity, innovation, and performance. However, to truly succeed in a competitive environment, it’s essential for organizations to track and measure their performance against…
In today’s fast-paced world, data-driven decision-making is crucial, especially in the public sector. Public Sector organizations face unique challenges such as transparency, accountability, and efficiency. One powerful tool that can…
PowerPoint isn’t just about text and images. It is a versatile tool that can be used to create engaging, data-driven visuals that captivate your audience. One of the most effective…
In the world of data visualization, Microsoft Power BI has revolutionized the way users interact with their data. One powerful is Field Parameters in Power BI, which allow users to…
In today’s data-driven world, having a well-organized sales report and tracker is essential for businesses to understand performance and make informed decisions. Google Sheets provides an excellent platform to create…
Google Sheets is a powerful tool for managing data and creating visualizations. One of its advanced features is the ability to create dynamic maps. A dynamic map in Google Sheets…
Power BI is a powerful tool that allows users to connect, analyze, and visualize data from various sources. Among these sources, Text/CSV files are common data formats used across industries…
Google Sheets offers a wide range of features to help you visualize and analyze data efficiently. One of the most powerful and visually appealing options is Conditional Formatting in Google…