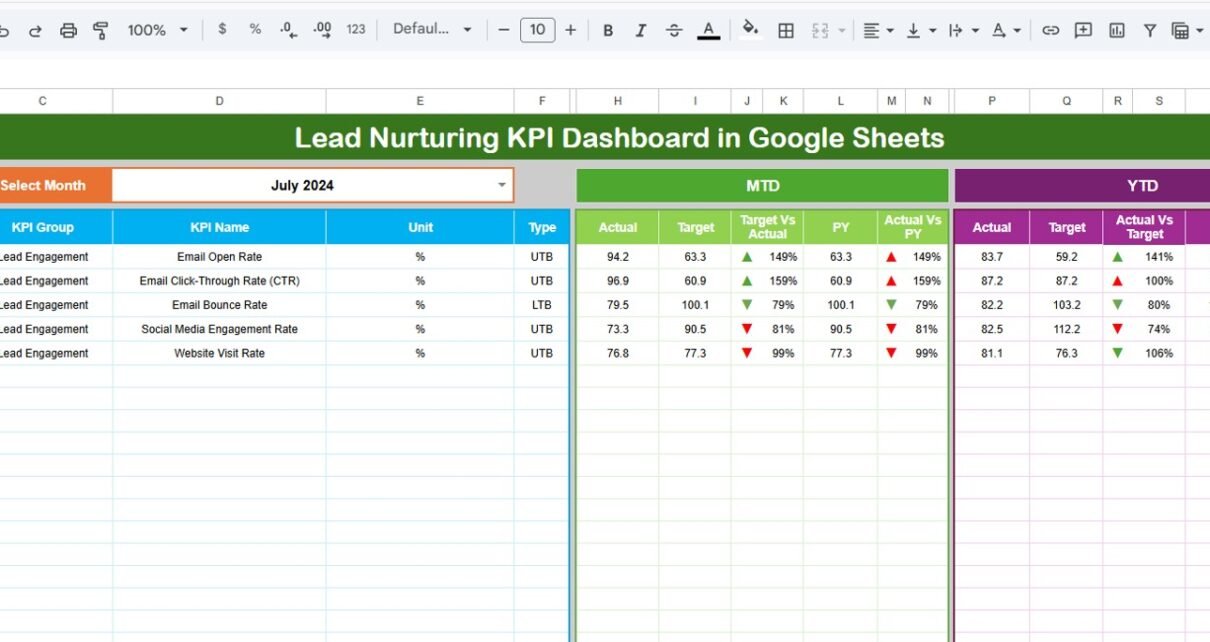
Track lead nurturing KPIs in Google Sheets with a 6-sheet dashboard for MTD/YTD actuals, targets, previous-year comparisons, KPI trends, and editable definitions.
Online Tutorial for Data Analysis and Automation
Track lead nurturing KPIs in Google Sheets with a 6-sheet dashboard for MTD/YTD actuals, targets, previous-year comparisons, KPI trends, and editable definitions.
Track 10 transportation safety KPIs with automated MTD/YTD calculations, traffic light indicators, and trend analysis charts using this ready-to-use Google Sheets scorecard template.
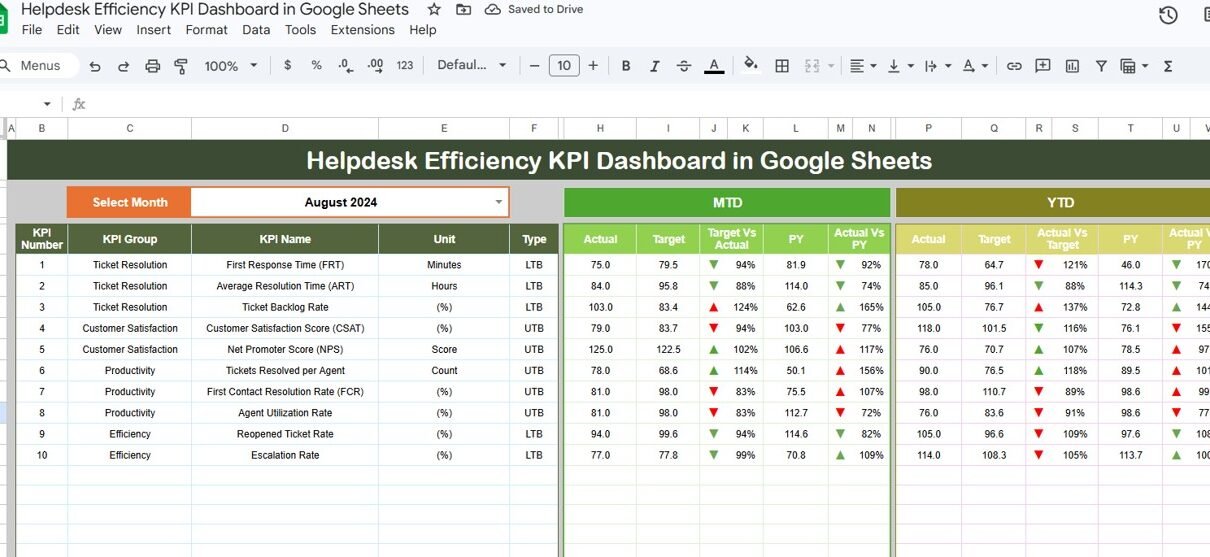
Track and optimize helpdesk performance with this ready-to-use KPI Dashboard in Google Sheets. Monitor MTD and YTD actuals vs targets with trend charts, conditional formatting, and a complete KPI definition library.
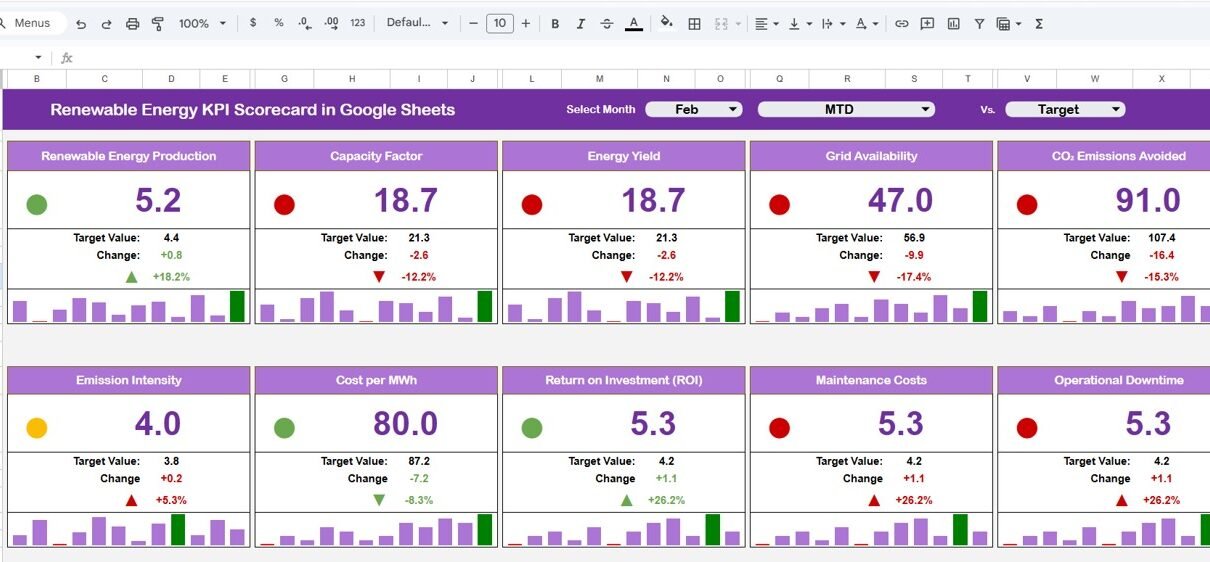
In today’s rapidly evolving Renewable Energy KPI Scorecard in Google Sheets landscape, renewable energy companies must continuously monitor performance to stay competitive. Whether you manage solar farms, wind projects, or hydroelectric plants, tracking key performance indicators (KPIs) plays a crucial role in ensuring efficiency and profitability. However, when organizations rely on scattered spreadsheets or manual […]
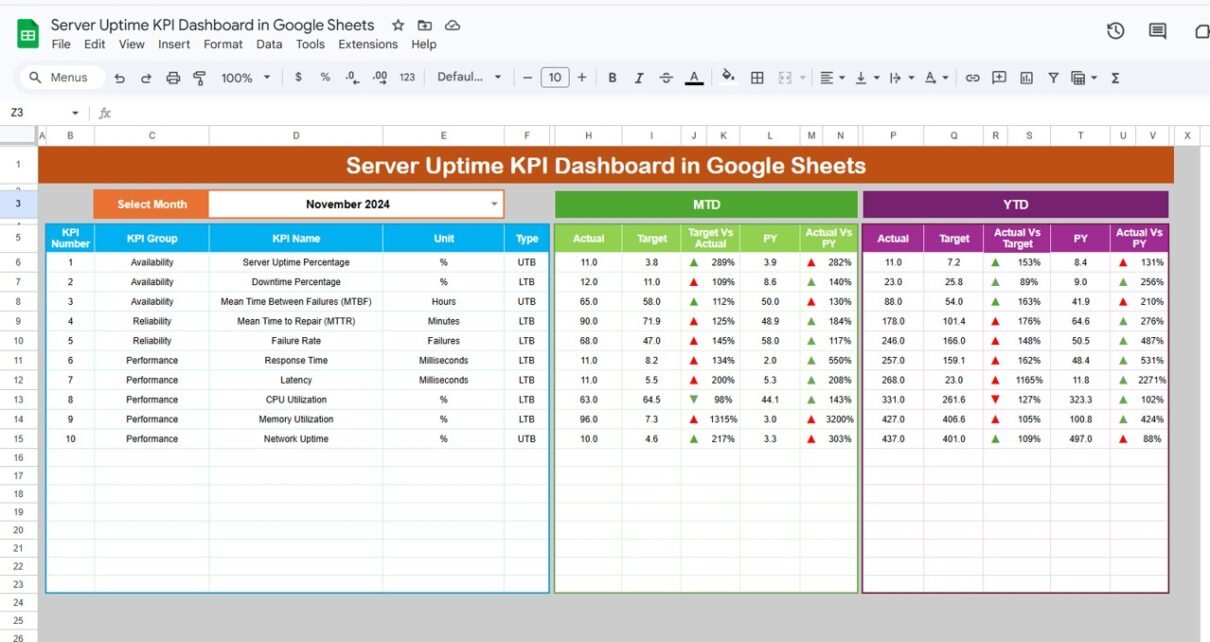
In today’s digital-first world, businesses depend heavily on servers and IT infrastructure. Whether you run a website, SaaS platform, or enterprise system, server uptime directly impacts performance, revenue, and user experience. However, when organizations fail to track uptime metrics properly, they often face unexpected downtimes, system failures, and customer dissatisfaction. So, how can you effectively […]
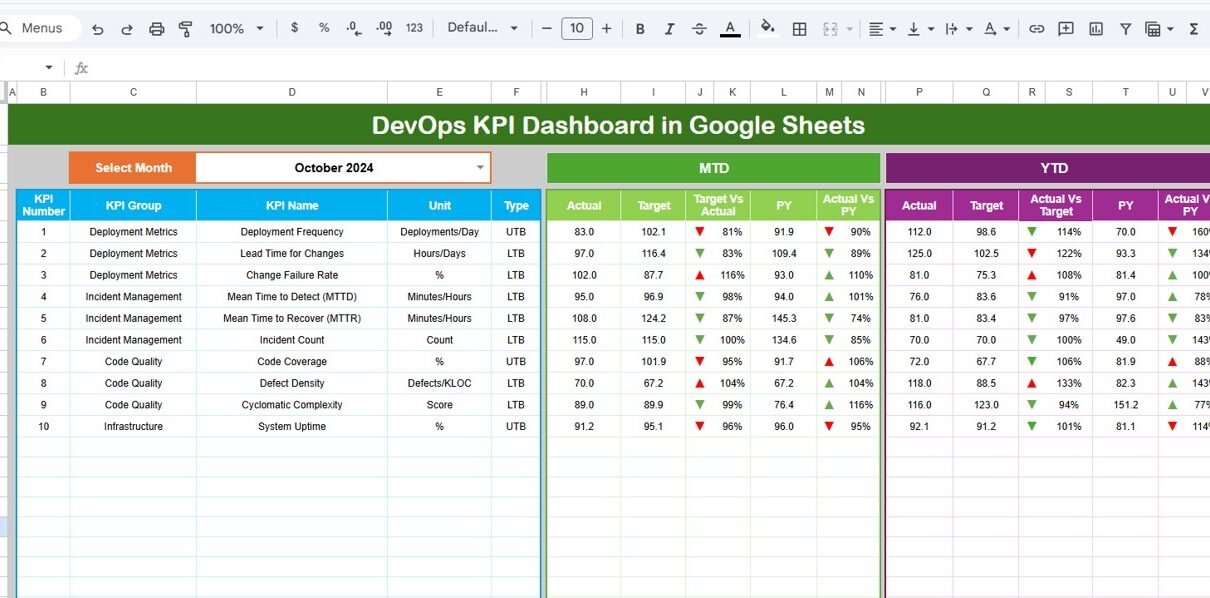
In today’s fast-paced digital world, organizations rely heavily on DevOps practices to deliver software faster, improve system reliability, and enhance collaboration between development and operations teams. However, managing DevOps performance requires continuous monitoring of key metrics such as deployment frequency, system uptime, failure rates, and lead time. Many organizations still track these metrics using manual […]
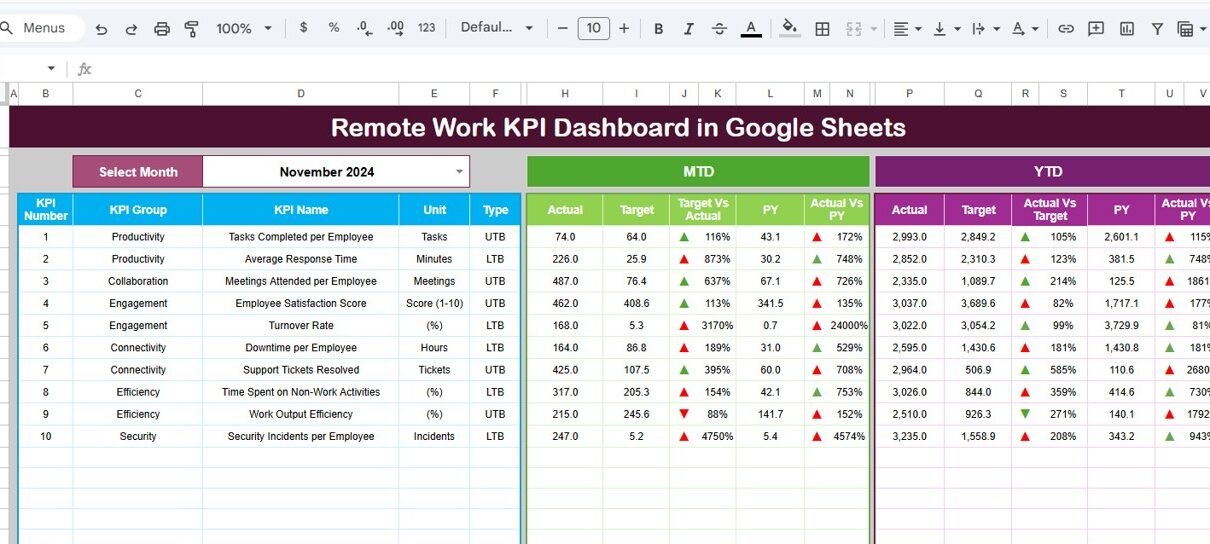
Remote work has become a major part of modern business operations. Many companies now allow employees to work from home, remote offices, or hybrid environments. While remote work offers flexibility and improved productivity, organizations must still monitor performance, collaboration, and operational efficiency. However, managing remote teams without proper data can become difficult. Managers often struggle […]
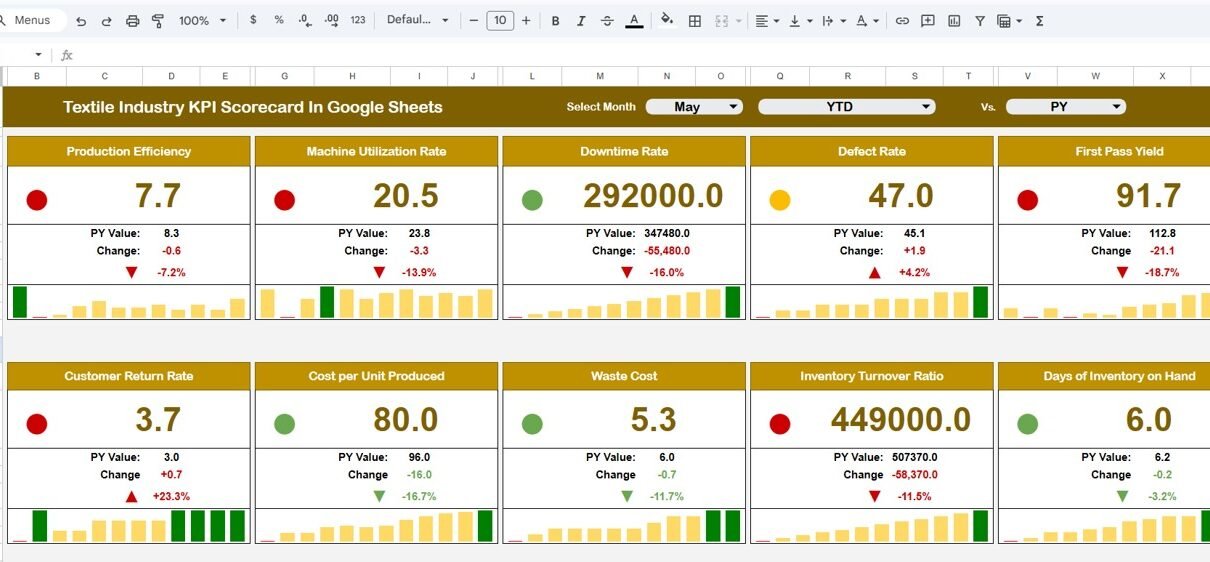
The textile industry operates in a highly competitive environment where manufacturers must control costs, maintain product quality, optimize production efficiency, and meet delivery deadlines. However, many textile companies still rely on manual reports and scattered spreadsheets to monitor their operational performance. As a result, managers often struggle to track key performance indicators, identify production issues, […]
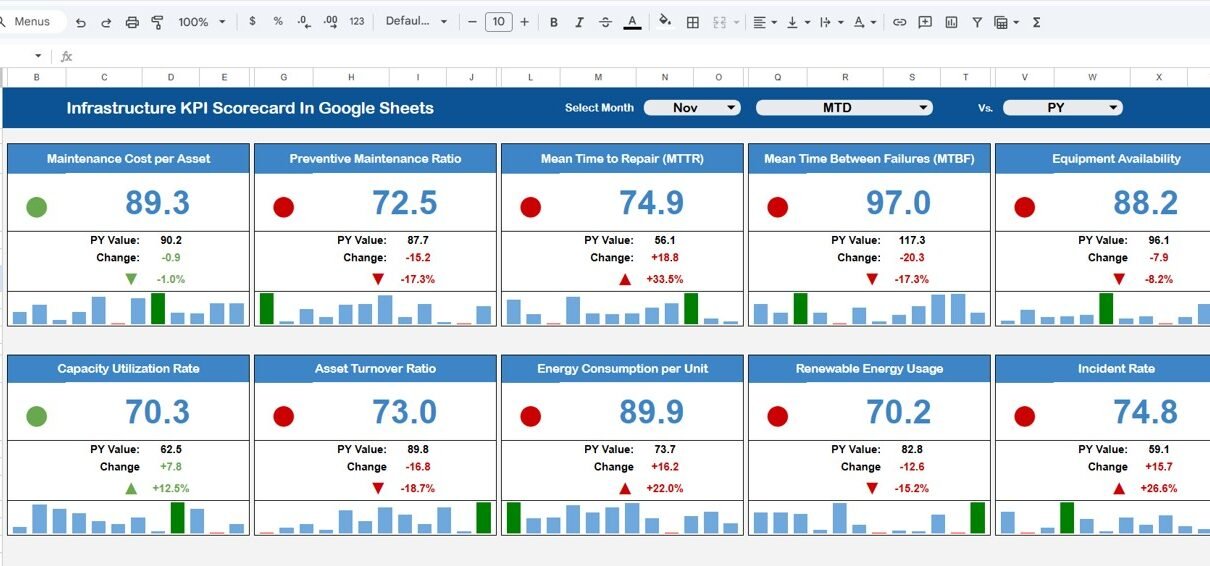
Infrastructure projects require careful monitoring and structured performance measurement. Organizations responsible for infrastructure development—such as construction companies, utilities, transportation authorities, and government agencies—must track key performance indicators to ensure projects remain efficient, profitable, and on schedule. However, many organizations still rely on multiple spreadsheets and manual reports to track infrastructure performance. As a result, managers […]
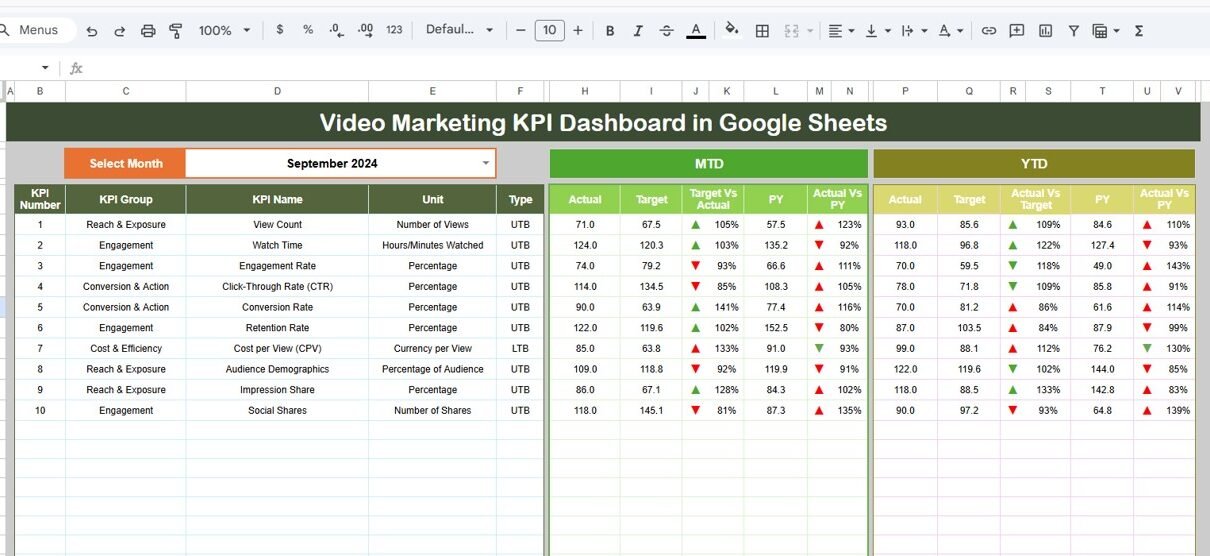
Video marketing has become one of the most powerful ways to attract audiences, build brand awareness, and increase conversions. Today, businesses publish videos across platforms like YouTube, social media, and websites. However, creating videos alone does not guarantee success. You must measure performance consistently to understand what works and what needs improvement.Video Marketing KPI Dashboard […]