Track 15+ ecommerce KPIs with MTD, YTD and Previous Year comparisons using this ready-to-use Google Sheets KPI Dashboard. Includes trend charts, conditional formatting arrows, and customizable KPI definitions.

Online Tutorial for Data Analysis and Automation
Track 15+ ecommerce KPIs with MTD, YTD and Previous Year comparisons using this ready-to-use Google Sheets KPI Dashboard. Includes trend charts, conditional formatting arrows, and customizable KPI definitions.
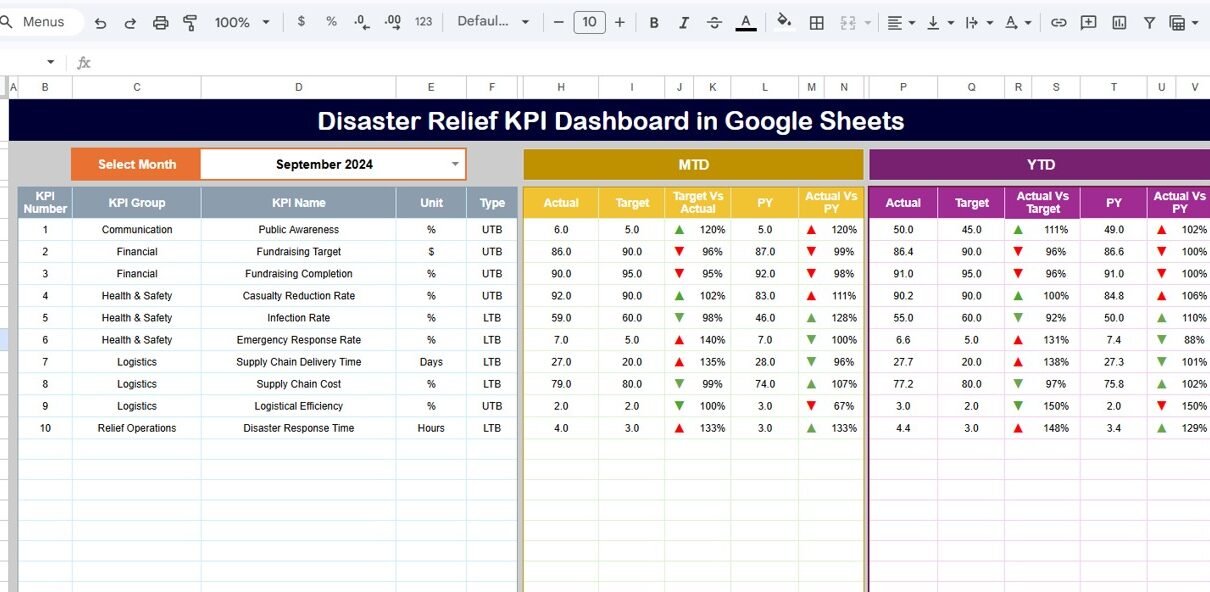
Track 12+ disaster relief KPIs across 6 interactive Google Sheets with MTD, YTD, Target, and Previous Year data. Features trend charts, conditional formatting arrows, and a month-selector dropdown. Setup in under 10 minutes.
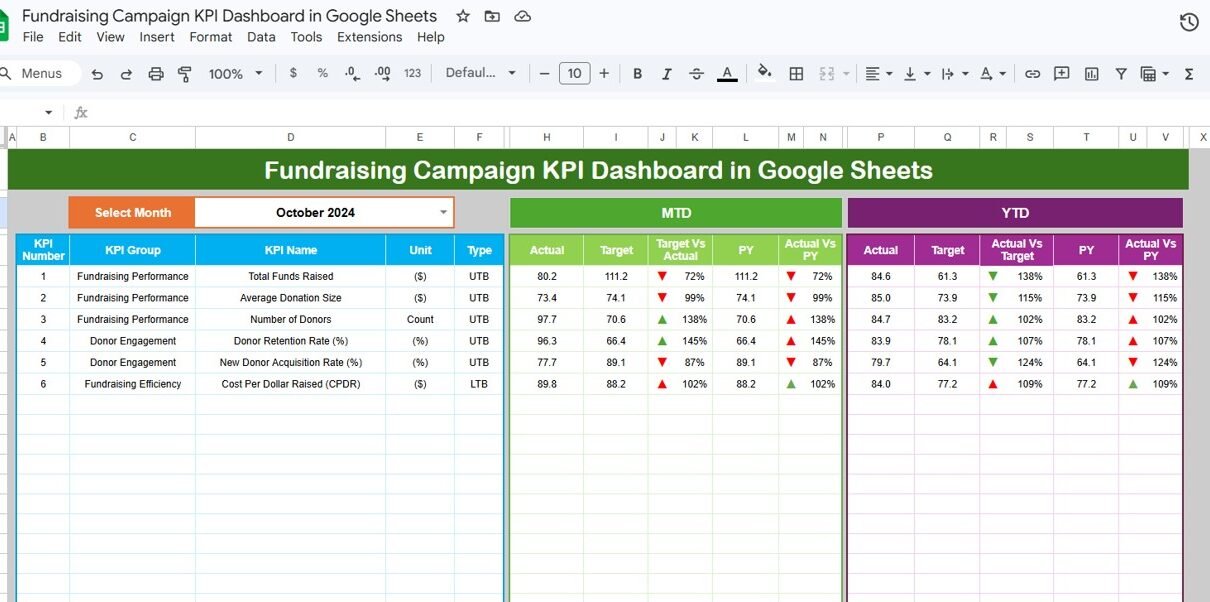
Track fundraising campaign KPIs across 6 worksheets with MTD/YTD comparisons, target tracking, prior-year analysis, trend charts, and conditional formatting in this ready-to-use Google Sheets KPI Dashboard template.
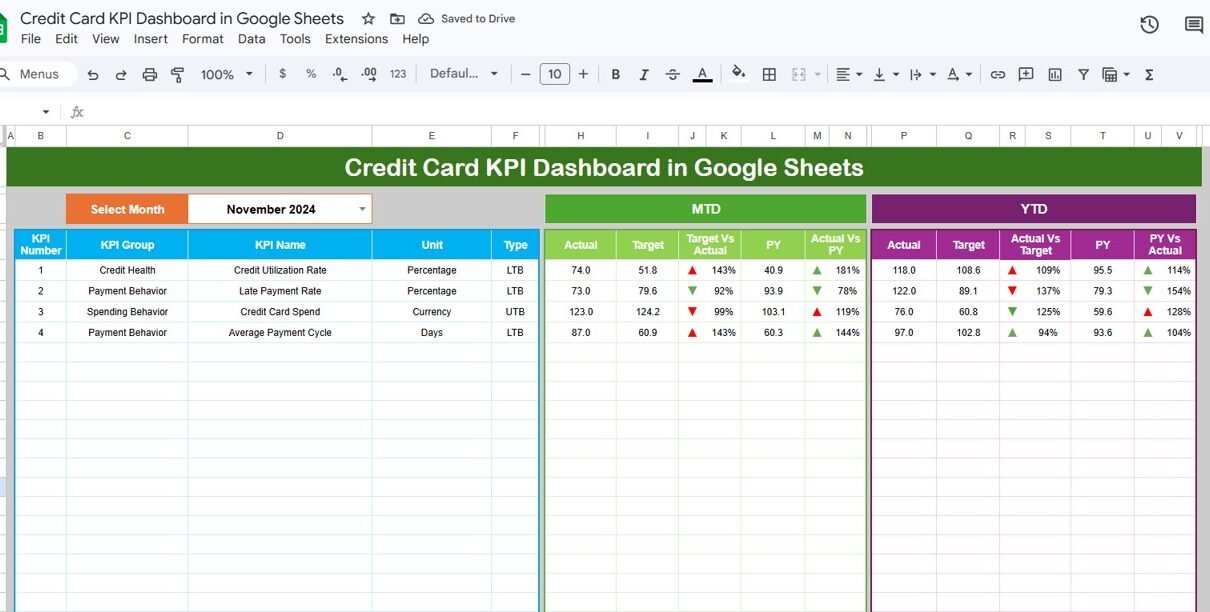
Track credit card KPIs with this ready-to-use Google Sheets template. Includes MTD/YTD comparisons, trend charts, conditional formatting arrows and LTB/UTB logic across 6 worksheets.
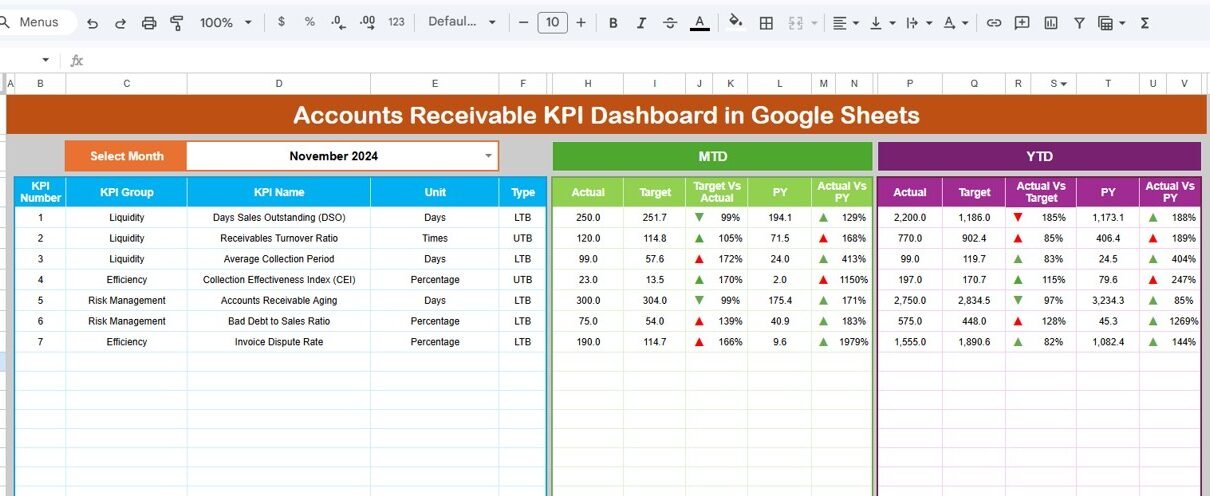
Track 15+ accounts receivable KPIs including DSO, CEI, aging buckets, and bad debt ratio with MTD/YTD trend charts and conditional formatting in Google Sheets. One-time $8.99 download.
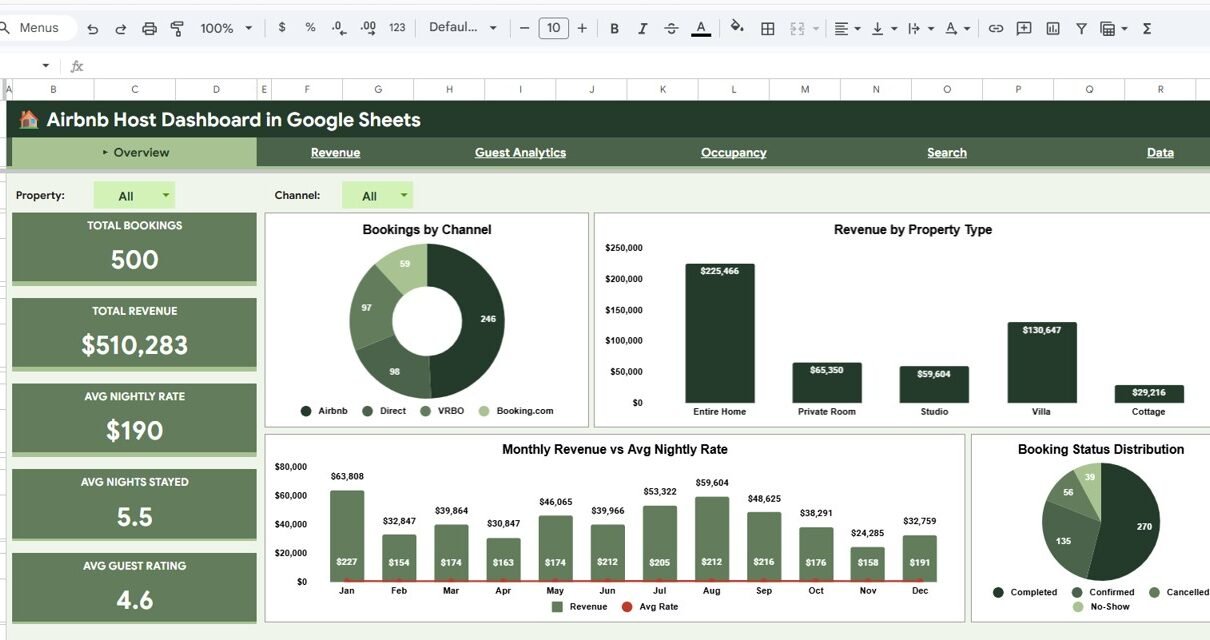
Track Airbnb hosting revenue, guest ratings, occupancy, and booking performance with this interactive Airbnb Host Dashboard in Google Sheets featuring 4 dashboard pages, booking lookup, and dynamic slicers.
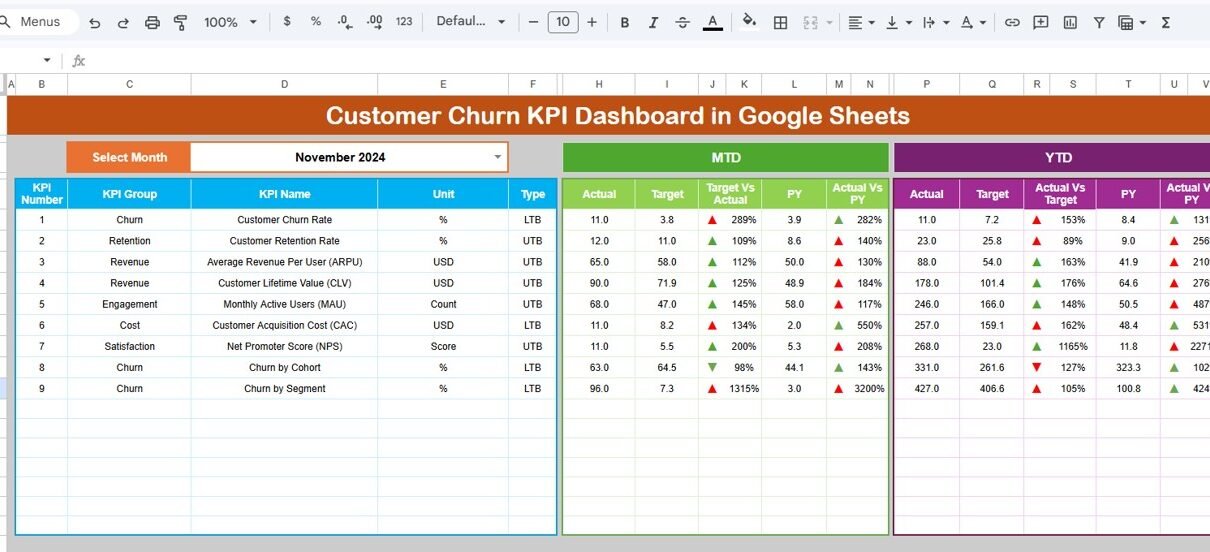
Introduction Customer churn is a critical metric for businesses aiming to retain customers and grow sustainably. Monitoring churn rates effectively can guide strategic decisions and operational improvements. This article presents a detailed overview of a Customer Churn KPI Dashboard in Google Sheets, a ready-to-use template designed to help businesses track and analyze their churn metrics […]
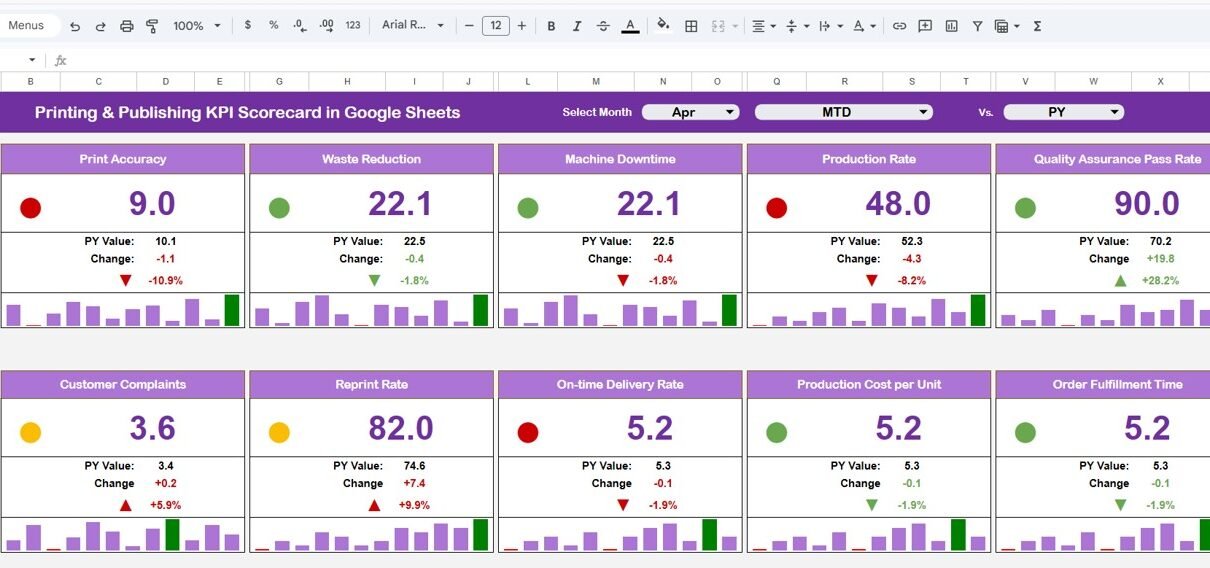
In today’s competitive printing and publishing industry, tracking performance is not optional—it is essential. Businesses must monitor production efficiency, costs, quality, and delivery timelines. However, when data stays scattered across multiple sheets, it becomes difficult to evaluate performance effectively.Printing & Publishing KPI Scorecard in Google Sheets So, how can you track KPIs, monitor trends, and […]
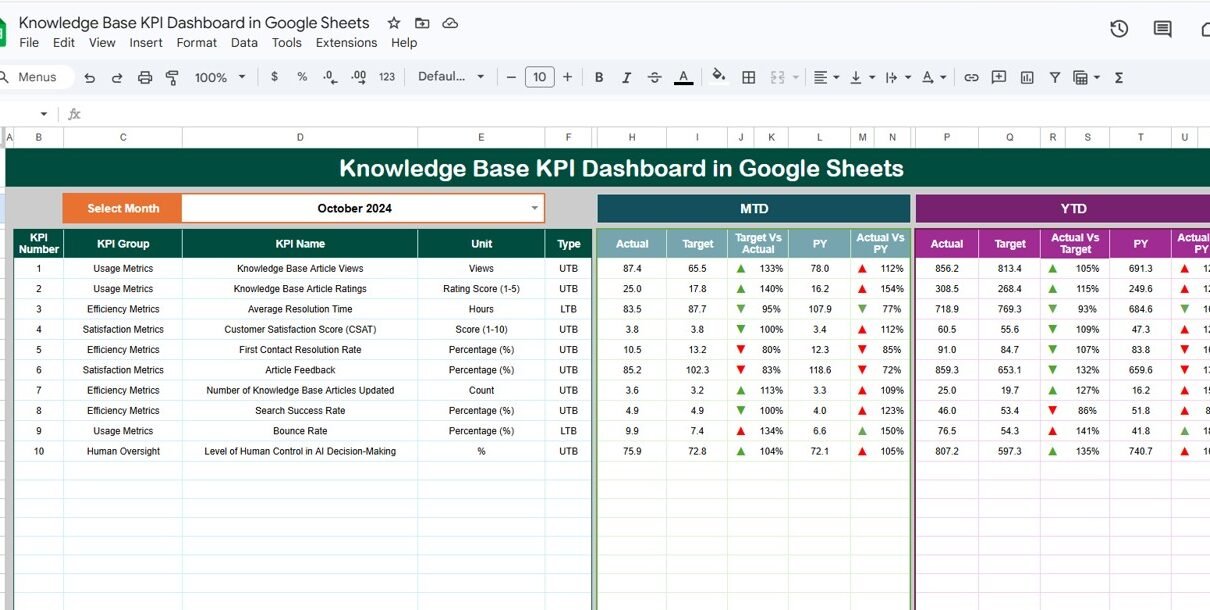
In today’s knowledge-driven world, organizations rely heavily on internal knowledge bases to support employees, customers, and operations. However, many teams struggle to measure how effective their knowledge base actually is. Without proper tracking, it becomes difficult to identify gaps, improve content quality, and enhance user experience.Knowledge Base KPI Dashboard in Google Sheets So, how can […]
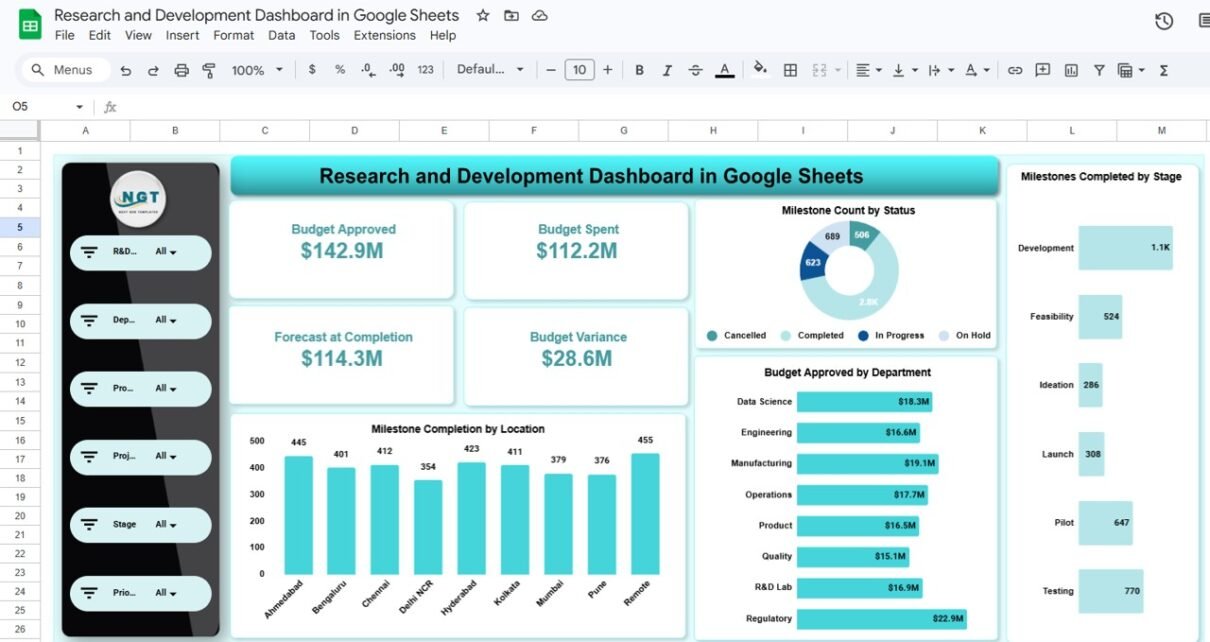
Research and Development (R&D) drives innovation, competitive advantage, and long-term business growth. Companies invest significant budgets into new products, process improvements, and technological innovation. However, managing R&D activities becomes challenging when teams rely on scattered spreadsheets, manual tracking, or disconnected reports.Research and Development Dashboard in Google Sheets Without a structured monitoring system, organizations face: Budget […]