According to Baymard Institute research, the average ecommerce cart abandonment rate sits at 70.19%, meaning nearly 7 out of 10 shoppers leave without completing a purchase. For ecommerce teams tracking conversion rates, cart abandonment, checkout completion, and average order value, the difference between growth and stagnation often comes down to consistent KPI monitoring. The Ecommerce Conversion Rate KPI Dashboard in Google Sheets tracks 15+ KPIs across 6 worksheets with MTD, YTD, and Previous Year comparisons — giving you a structured performance view that updates in seconds.Ecommerce Conversion Rate KPI Dashboard in Google Sheets
Most ecommerce businesses rely on platform-native analytics like Shopify Analytics or Google Analytics 4, which provide raw data but lack structured target-vs-actual and year-over-year comparison views. This dashboard fills that gap with pre-built conditional formatting arrows, trend charts, and customizable KPI definitions — all in Google Sheets, requiring no macros, add-ons, or paid subscriptions. If you need a ready-to-use ecommerce KPI dashboard in Google Sheets that your entire team can access and edit simultaneously, this template delivers exactly that.Ecommerce Conversion Rate KPI Dashboard in Google Sheets
Key Features of Ecommerce Conversion Rate KPI Dashboard in Google Sheets
The Ecommerce Conversion Rate KPI Dashboard tracks 15+ ecommerce KPIs including cart abandonment rate, checkout completion rate, add-to-cart rate, product page conversion, bounce rate, average order value, and customer acquisition cost. Each KPI displays MTD Actual, Target, and Previous Year data alongside YTD metrics on a single dashboard view.Ecommerce Conversion Rate KPI Dashboard in Google Sheets
The KPI Trend sheet provides individual KPI deep-dives with 12-month trend charts comparing Actual, Target, and Previous Year lines. Every KPI includes its group classification, unit of measurement, calculation formula, definition text, and LTB (Lower the Better) or UTB (Upper the Better) type designation.Ecommerce Conversion Rate KPI Dashboard in Google Sheets
Conditional formatting arrows deliver instant visual feedback — green up arrows for positive variances and red down arrows for negative variances across both Target vs Actual and PY vs Actual columns. Three separate input sheets (Actual, Target, Previous Year) keep your raw data organized while the Dashboard and KPI Trend sheets handle all calculations and visualizations automatically.
For related tracking, explore the E-commerce KPI Scorecard in Google Sheets for a scorecard-style approach to ecommerce metrics.Ecommerce Conversion Rate KPI Dashboard in Google Sheets
Dashboard Pages Explanation
🛒 Click here to Purchase the Ecommerce Conversion Rate KPI Dashboard in Google Sheets
1. Dashboard Sheet
This is the main sheet tab and control center of the entire template. On cell D3, you can select any month from the drop-down and the whole dashboard refreshes instantly. The dashboard displays MTD Actual, Target, Previous Year data along with Target vs Actual and PY vs Actual variance columns — all with conditional formatting up/down arrows. The YTD section mirrors this structure, showing YTD Actual, Target, Previous Year data with the same variance calculations.Ecommerce Conversion Rate KPI Dashboard in Google Sheets
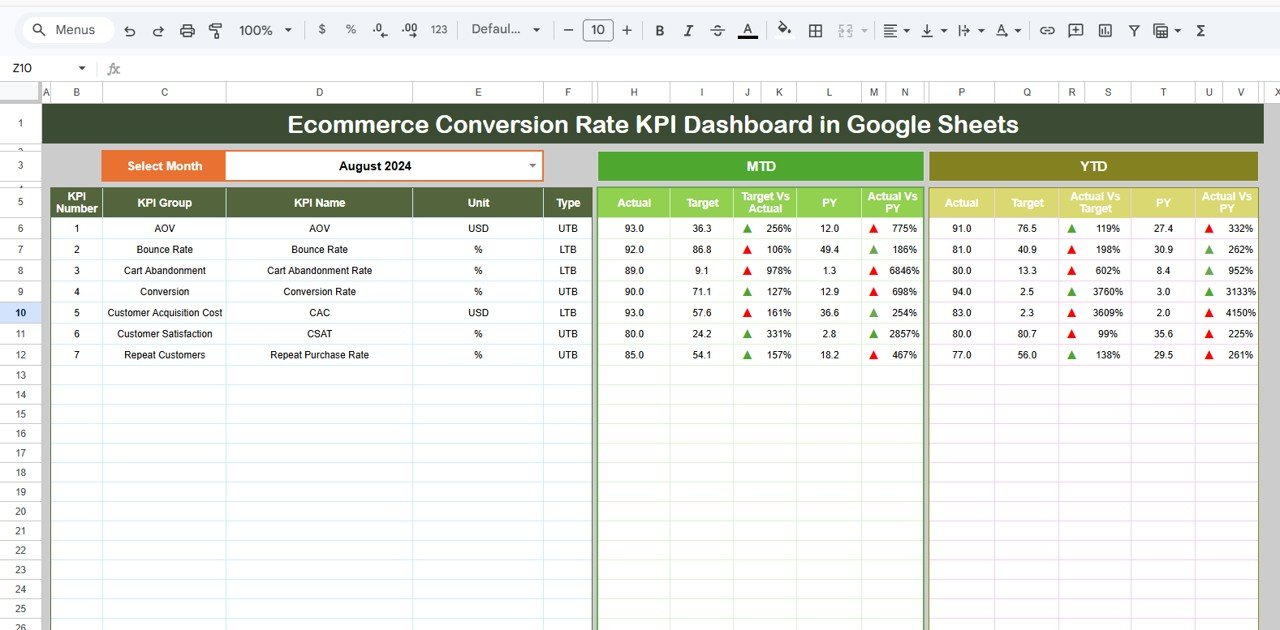
Ecommerce Conversion Rate KPI Dashboard in Google Sheets
2. KPI Trend Sheet
Select any KPI name from the drop-down on cell C3 to view its complete profile. The sheet displays the KPI Group, Unit, Type (LTB or UTB), Formula, and Definition. Below the metadata, two trend charts show the MTD and YTD monthly comparisons for Actual, Target, and Previous Year numbers across all 12 months.Ecommerce Conversion Rate KPI Dashboard in Google Sheets
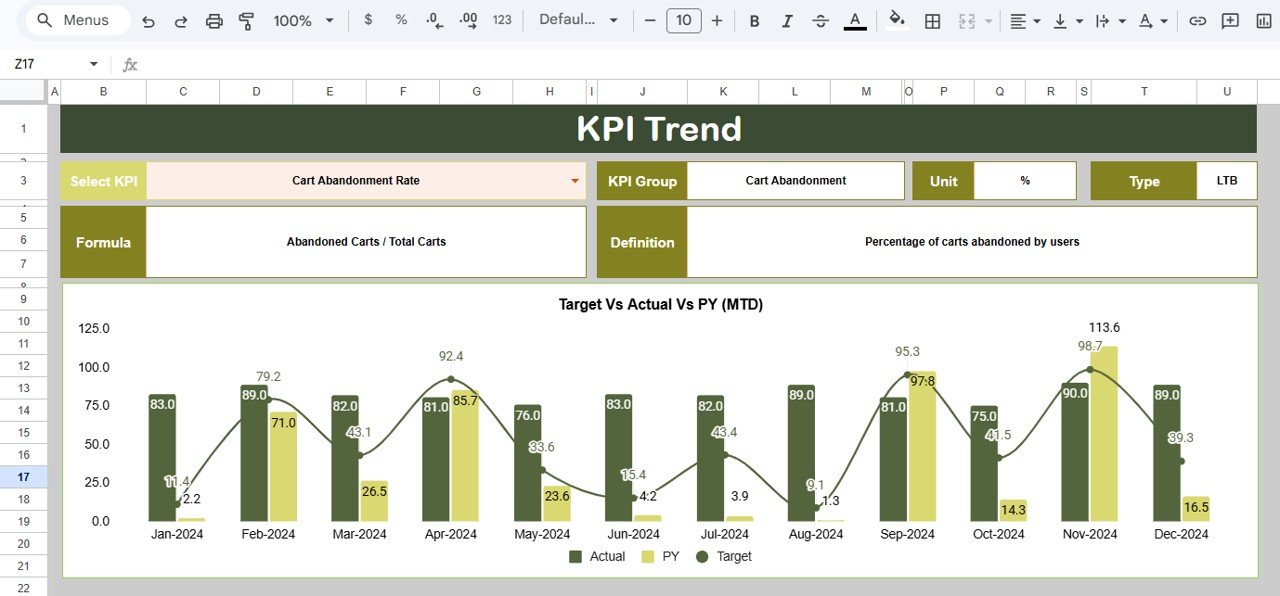
KPI Trend Sheet
3. Actual Numbers Input Sheet
Enter your actual numbers for both YTD and MTD for each month. You can change the starting month from cell E1 — just input the first month of your fiscal year. All KPIs are listed vertically, and the 12 monthly columns populate automatically based on your starting month.
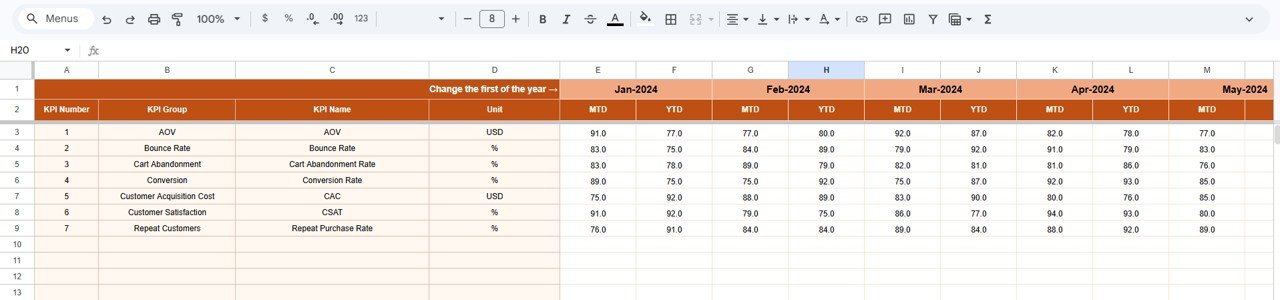
Actual Numbers Input Sheet
4. Target Number Input Sheet
Enter target numbers for each KPI for every month, including both MTD and YTD targets. This sheet follows the same layout as the Actual sheet for consistency, making it easy to enter data quickly.
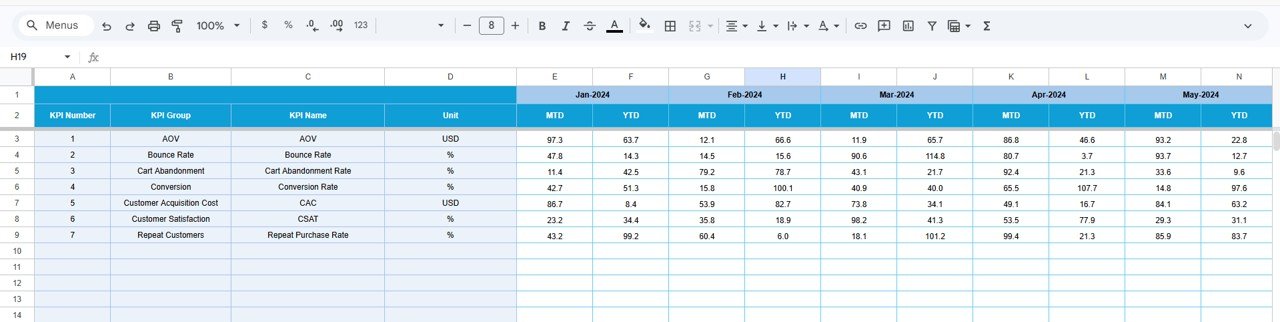
Target Number Input Sheet
5. Previous Year Number Sheet
Enter prior year data in the same format as the current year. This enables the PY vs Actual comparisons on the Dashboard sheet and the Previous Year trend line on the KPI Trend charts, giving you accurate year-over-year performance tracking.Ecommerce Conversion Rate KPI Dashboard in Google Sheets
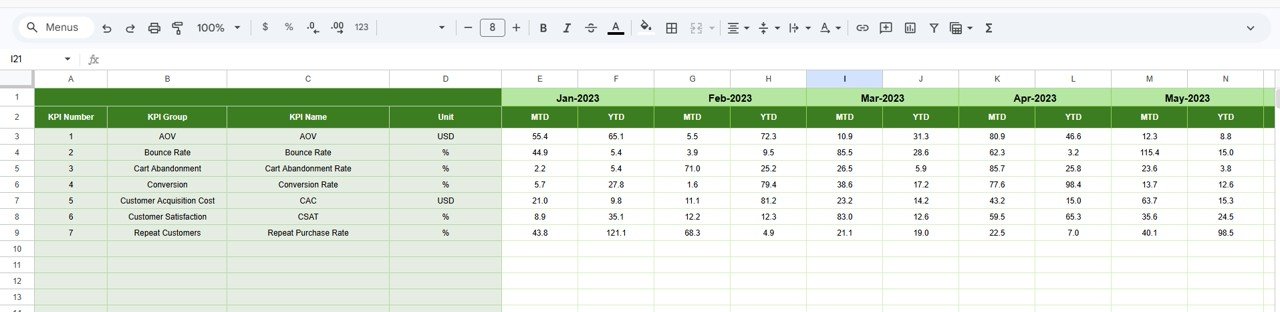
Previous Year Number Input Sheet
6. KPI Definition Sheet
Enter each KPI’s Name, Group, Unit, Formula, and Definition. In the last column, specify the KPI type as LTB (Lower the Better) or UTB (Upper the Better). This metadata feeds into the KPI Trend sheet, so anyone viewing the dashboard understands what each metric means and how it’s calculated.Ecommerce Conversion Rate KPI Dashboard in Google Sheets
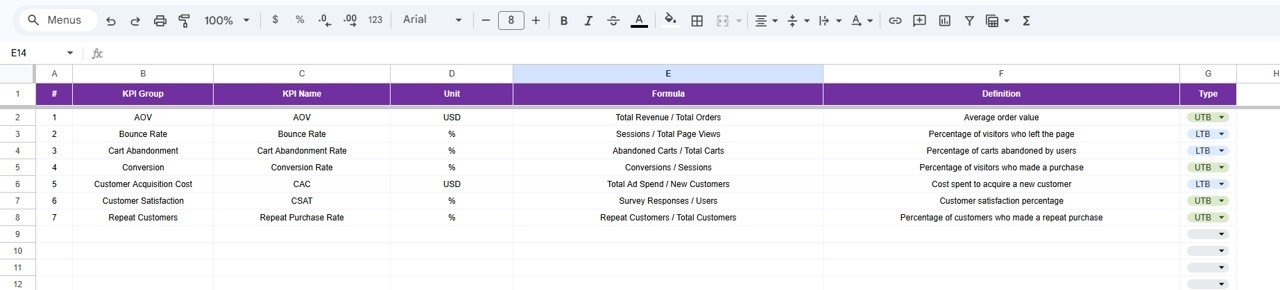
KPI Definition Sheet
Ecommerce Conversion Rate KPI Dashboard vs. Microsoft Excel Dashboard vs. Shopify Analytics — Feature Comparison
| Feature | Ecommerce Conversion Rate KPI Dashboard (Google Sheets) | Microsoft Excel Dashboard | Shopify Analytics / GA4 |
|---|---|---|---|
| Cost | $8.99 one-time | $15-20 one-time (template) | Free (basic) / $79-399/mo (Shopify) |
| Platform | Google Sheets (free, browser-based) | Microsoft Excel (license required) | Web-based SaaS |
| Setup Time | Under 10 minutes | 10-15 minutes | 30-60 minutes |
| Real-time Team Collaboration | ✅ Built-in | ❌ Requires OneDrive/SharePoint | ✅ Yes |
| Custom KPI Definitions | ✅ Fully customizable | ✅ Manual setup | ❌ Fixed metrics |
| MTD + YTD + PY Comparison | ✅ All three built-in | ✅ With formulas | ❌ Limited PY |
| Mobile Access | ✅ Google Sheets app | Limited | ✅ Yes |
| Share with Link | ✅ One click | ❌ File sharing only | ✅ Dashboard links |
| Year-1 Cost (5 users) | $8.99 total | $15-20 + Excel licenses | $948-$4,788/year |
For ecommerce teams that want structured KPI tracking with MTD, YTD, and Previous Year comparisons without monthly SaaS fees, the Ecommerce Conversion Rate KPI Dashboard sits in the sweet spot.
Who Should Use This Template
🛒 Click here to Purchase the Ecommerce Conversion Rate KPI Dashboard in Google Sheets
Perfect for:
- Ecommerce managers tracking conversion rates, cart abandonment, and AOV across their online store
- Small to mid-size DTC brands wanting structured KPI reporting without expensive analytics tools
- Marketing teams comparing monthly and yearly ecommerce performance against set targets
- Freelance ecommerce consultants building KPI reports for multiple clients
Not a fit if:
- You need real-time API integration pulling data automatically from Shopify, WooCommerce, or Magento
- Your team requires automated data ingestion — this template uses manual data entry
- You need multi-currency or multi-store consolidated reporting in a single view
Real-World Use Cases
Priya runs a DTC skincare brand with 2,000 monthly orders. She uses the Ecommerce Conversion Rate KPI Dashboard to track add-to-cart rate, checkout completion, and cart abandonment month over month. Her team reviews the dashboard every Monday morning and adjusts ad spend based on conversion trends — replacing a $199/month analytics subscription they no longer need.
Marcus manages ecommerce operations for a mid-size electronics retailer. He enters weekly conversion data and shares the Google Sheet with his leadership team for monthly performance reviews. The PY vs Actual comparison helps him quantify seasonal improvements and justify budget requests with hard numbers instead of assumptions.
Aisha is a freelance ecommerce consultant. She creates a copy of this dashboard for each of her 5 clients, customizing the KPI definitions per niche — fashion, electronics, home goods. The professional formatting and trend charts save her 3+ hours per client on monthly reporting while delivering insights that keep clients engaged.
Advantages of Ecommerce Conversion Rate KPI Dashboard
The template saves ecommerce teams 5-8 hours per month compared to building KPI reports from scratch. With pre-built conditional formatting, drop-down selectors, and trend charts, you get a professional-grade dashboard without writing a single formula. Google Sheets’ native collaboration means your entire team views the same data in real time — no version control issues, no file-sharing friction.
The KPI Definition sheet adds transparency that most analytics platforms lack. Every metric includes its formula and definition, so new team members understand what each KPI measures without needing a training session. The LTB/UTB classification ensures the conditional formatting arrows always point in the correct direction — a detail that catches errors other dashboards miss.
For ecommerce teams exploring adjacent dashboards, the Order Fulfillment KPI Dashboard in Google Sheets tracks shipping accuracy and delivery timelines, while the Customer Retention KPI Dashboard in Google Sheets monitors churn rate and CLV.
Opportunities for Improvement
🛒 Click here to Purchase the Ecommerce Conversion Rate KPI Dashboard in Google Sheets
This dashboard uses manual data entry, which means someone on your team needs to input actual numbers monthly. Teams with high data volumes across multiple stores may find this time-consuming compared to automated solutions. The template does not pull data directly from Shopify, WooCommerce, or Google Analytics APIs — if you need live data sync, you would need to build a custom Apps Script integration or use a third-party connector like Supermetrics.
The current design tracks one store in one currency. Multi-store or multi-currency ecommerce operations would need separate copies of the dashboard per store or manual currency conversion before entering data.
Best Practices
Update your actual numbers on the same day each month for consistent comparisons. Use the KPI Definition sheet to document exactly how each metric is calculated — this prevents confusion when different team members interpret metrics differently. Set targets at the beginning of each quarter based on historical trends visible in the PY data, not arbitrary goals.
Share the dashboard with view-only access for stakeholders and edit access only for the person responsible for data entry. This prevents accidental formula overwrites. Use Google Sheets’ protected ranges feature to lock the Dashboard and KPI Trend sheets while keeping the input sheets editable.
Explore Relevant Templates
📊 Order Fulfillment KPI Dashboard in Google Sheets – Track fulfillment rates, shipping accuracy, and delivery timelines.
📊 Customer Retention KPI Dashboard in Google Sheets – Monitor churn rate, customer lifetime value, and repeat purchase trends.
📊 Etsy Seller Analytics Dashboard in Google Sheets – Dedicated analytics for Etsy sellers including views, favorites, and revenue.
📊 Digital Marketing Campaign Dashboard in Google Sheets – Track campaign performance, ROI, and channel metrics.
Browse all templates in the Google Sheets Dashboard Templates collection.
Frequently Asked Questions
🛒 Click here to Purchase the Ecommerce Conversion Rate KPI Dashboard in Google Sheets
What KPIs does the Ecommerce Conversion Rate KPI Dashboard track?
The Ecommerce Conversion Rate KPI Dashboard tracks 15+ KPIs including cart abandonment rate, checkout completion rate, add-to-cart rate, product page conversion, bounce rate, average order value, and customer acquisition cost. All metrics update automatically when you enter your data.
Can I add custom KPIs to this dashboard?
Yes. The KPI Definition sheet lets you add, remove, or modify any KPI. Enter the KPI name, group, unit, formula, definition, and LTB/UTB type. The dashboard and trend charts adjust automatically to reflect your custom KPIs.
How does this compare to Shopify Analytics?
Shopify Analytics provides real-time data from your store but lacks customizable MTD + YTD + Previous Year comparison views. This dashboard costs $8.99 one-time vs Shopify’s monthly plans and gives you full control over KPI definitions, targets, and trend analysis.
How long does setup take?
Setup takes under 10 minutes. Open the Google Sheets copy link, define your KPIs on the KPI Definition sheet, enter your actual and target numbers, and the Dashboard sheet generates your complete performance view instantly.
Does this work on mobile devices?
Yes. The dashboard works fully on the Google Sheets mobile app for iOS and Android. You can view KPIs, switch months, and check trend charts from your phone or tablet without any functionality loss.
Can multiple team members use this dashboard simultaneously?
Yes. Google Sheets supports real-time collaboration. Share the file via link or email, set view or edit permissions, and your entire team can access the dashboard simultaneously without additional licenses or per-user fees.
Is this template compatible with Google Workspace?
Yes. The Ecommerce Conversion Rate KPI Dashboard works with both free Google accounts and Google Workspace business accounts. No macros, add-ons, or third-party integrations are required.
About the Author
Built by PK — Microsoft Certified Professional with 15+ years of Excel, Google Sheets, and Power BI experience. Founder of NextGenTemplates, reaching 300K+ subscribers across YouTube channels. Every template is hand-built and tested before release.
Conclusion
The Ecommerce Conversion Rate KPI Dashboard in Google Sheets gives ecommerce teams a structured way to track conversion rates, cart abandonment, AOV, and 12+ additional KPIs with month-over-month and year-over-year comparisons. With 6 worksheets covering dashboards, trends, actual input, targets, previous year data, and KPI definitions, it replaces manual reporting with a professional template that takes under 10 minutes to set up.
🛒 Click here to Purchase the Ecommerce Conversion Rate KPI Dashboard in Google Sheets
✅ Instant download · One-time payment · No subscription
👉 Visit our YouTube channel for step-by-step tutorials: YouTube.com/@NeoTechNavigators