According to a 2025 PYMNTS study, businesses that actively track accounts receivable KPIs reduce their average Days Sales Outstanding by 23% within the first year. Yet 68% of small and mid-sized finance teams still rely on manual spreadsheets with no structured KPI monitoring — leading to missed collections, rising bad debt, and inaccurate cash flow forecasts.
The Accounts Receivable KPI Dashboard in Google Sheets solves this by tracking 15+ AR metrics including DSO, Collection Effectiveness Index, Aging Bucket Percentages, and Bad Debt Ratio across 6 interactive worksheets with MTD and YTD trend analysis, conditional formatting arrows, and a dropdown-based month selector. Built entirely in Google Sheets, it gives AR managers, controllers, and finance teams a cloud-based receivable command center that costs $8.99 one-time — replacing $200/month accounting software for KPI-level AR monitoring.
Click here to Purchase Accounts Receivable KPI Dashboard in Google Sheets
Key Features of Accounts Receivable KPI Dashboard in Google Sheets
This ready-to-use Google Sheets dashboard template delivers a structured AR monitoring system that any finance professional can set up in under 10 minutes. Here are the features that make it one of the best accounts receivable tracking solutions built in Google Sheets:
- 15+ Accounts Receivable KPIs — Tracks Days Sales Outstanding (DSO), Collection Effectiveness Index (CEI), Aging Bucket Percentages (0-30, 31-60, 61-90, 90+ days), Bad Debt Ratio, Average Days Delinquent, and more
- MTD + YTD Dual Tracking — Every KPI shows Month-to-Date and Year-to-Date values for Actual, Target, and Previous Year side by side
- Conditional Formatting Arrows — Green up-arrows and red down-arrows for Target vs Actual and PY vs Actual variance analysis at a glance
- One-Click Month Selector — A single dropdown on cell D3 refreshes the entire Dashboard sheet for any month without editing formulas
- KPI Trend Charts — Select any KPI from the dropdown to view its MTD and YTD line charts for Actual, Target, and Previous Year data
- Self-Documenting KPI Definitions — Every metric includes its Name, Group, Unit, Formula, Definition, and Type (LTB/UTB) on a dedicated sheet
- 3 Organized Input Sheets — Separate worksheets for Actual Numbers, Target Numbers, and Previous Year Numbers with consistent month-column layouts
- Configurable Fiscal Year — Set your fiscal year start month on cell E1 of the Actual Numbers sheet and all months align automatically
- Cloud-Based Collaboration — Share with your team via Google Drive, collaborate in real time, access from any device
The Accounts Receivable KPI Dashboard in Google Sheets tracks 15+ KPIs across 6 worksheets with automated MTD/YTD trend analysis. Every KPI updates with conditional formatting arrows when you enter new data — no manual chart building or formula writing required.
Dashboard Pages Explanation
Click here to Purchase Accounts Receivable KPI Dashboard in Google Sheets
Click here to Purchase Accounts Receivable KPI Dashboard in Google Sheets
The template includes 6 interconnected worksheets, each serving a specific role in your AR monitoring workflow.
1. Dashboard Sheet
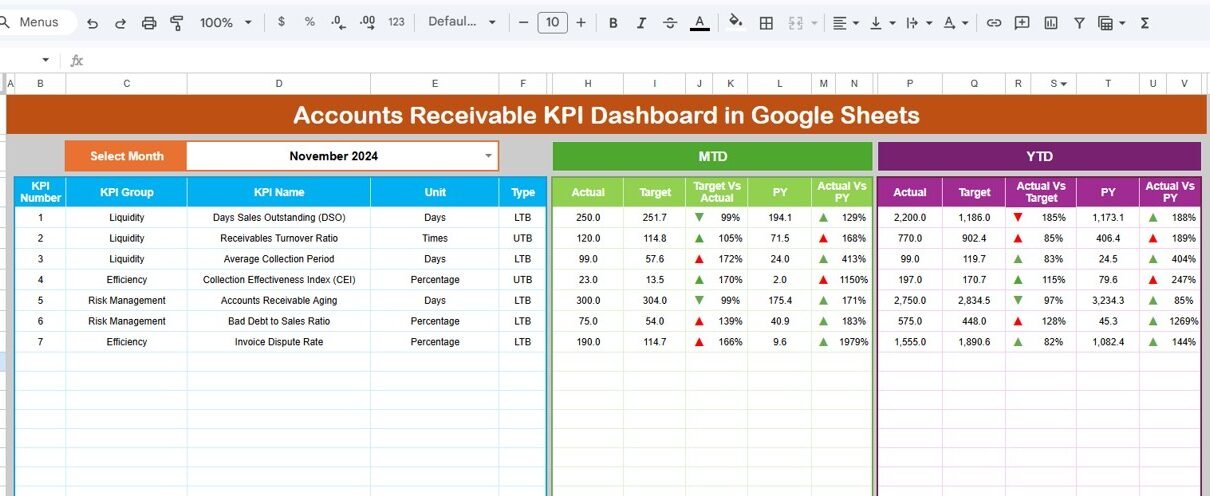
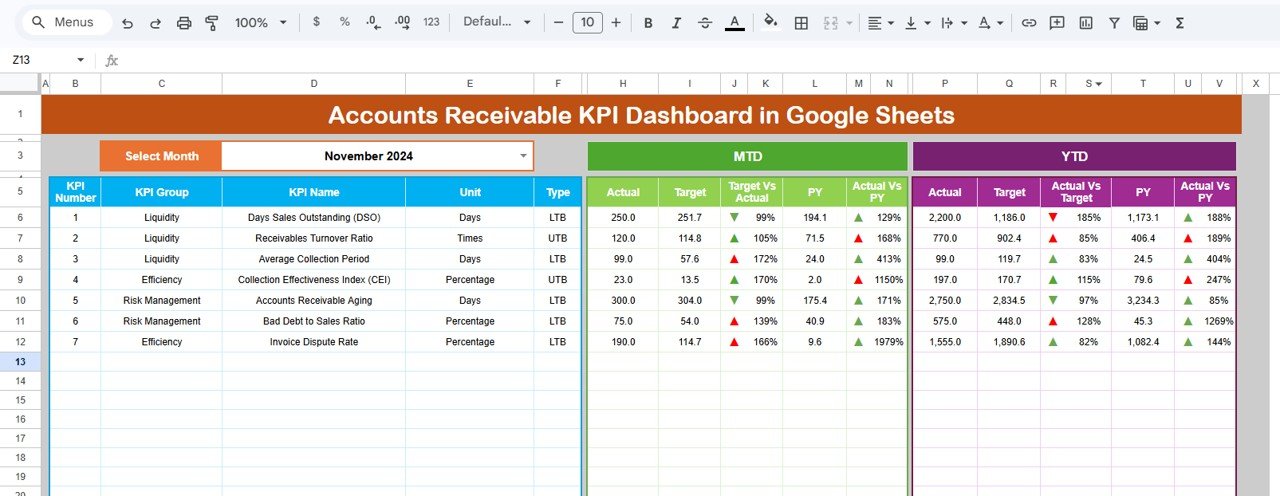
The Dashboard sheet is the main KPI overview page. On range D3, you can select any month from the dropdown and the entire dashboard updates instantly. It displays all KPIs with MTD Actual, Target, and Previous Year data alongside YTD Actual, Target, and Previous Year data. Each comparison column includes conditional formatting up-down arrows — green arrows indicate favorable performance (Actual beating Target or improving over PY) and red arrows flag areas needing attention.
This layout gives AR managers a complete receivable health snapshot in one view. You can see exactly which KPIs are on track, which are falling behind target, and how current performance compares to the same period last year.
Accounts Receivable KPI Dashboard in Google Sheets
2. KPI Trend Sheet
The KPI Trend sheet lets you deep-dive into any individual KPI. Select a KPI name from the dropdown on range C3 and the page displays its KPI Group, Unit, Type (Lower the Better or Upper the Better), Formula, and Definition. Below these details, two trend charts show the MTD and YTD trajectories for Actual, Target, and Previous Year numbers across all months.
This sheet is especially useful for identifying deteriorating collection patterns early. If DSO has been trending upward for 3 consecutive months against a flat target, the trend chart makes it immediately visible — something that is easy to miss when looking at a single month’s snapshot.
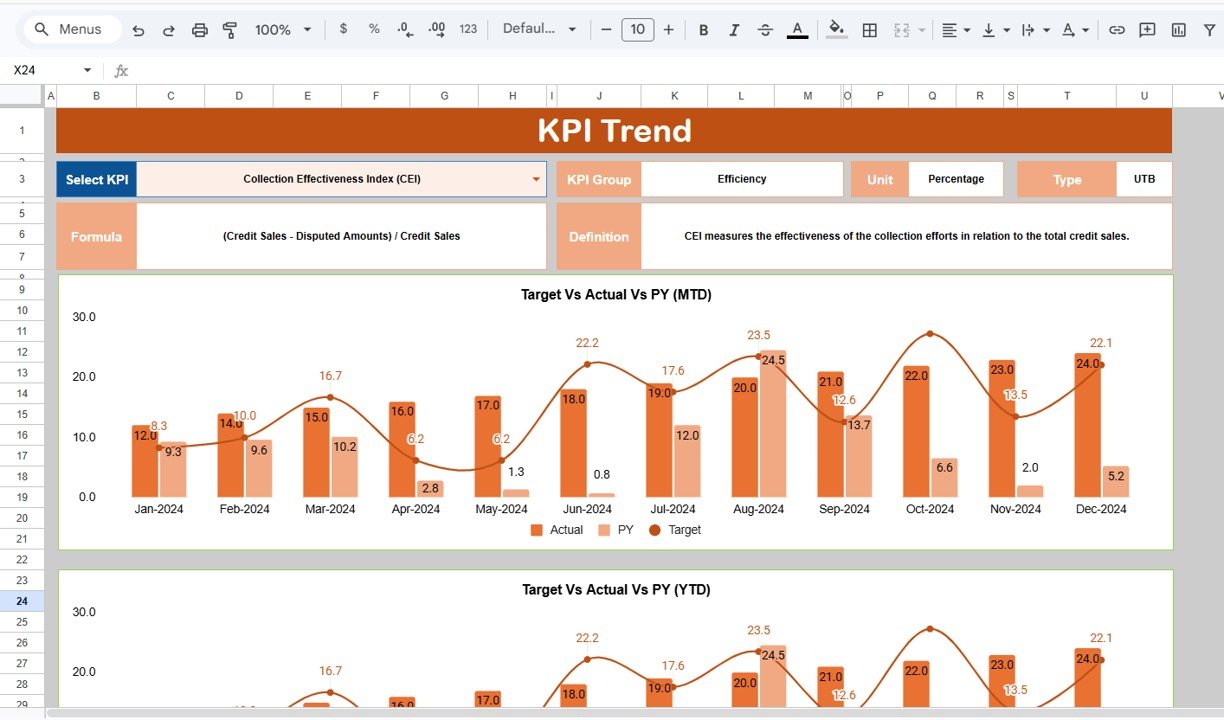
KPI Trend Sheet
3. Actual Numbers Input Sheet
The Actual Numbers Input sheet is where you enter the real MTD and YTD data for each KPI by month. Cell E1 controls the starting month of your fiscal year — simply input the first month and all subsequent columns align accordingly. This makes the template compatible with any fiscal year configuration (January start, April start, October start, etc.).
Each row represents one KPI, and each column pair represents a month’s MTD and YTD actual values. The Dashboard and KPI Trend sheets pull directly from this data.
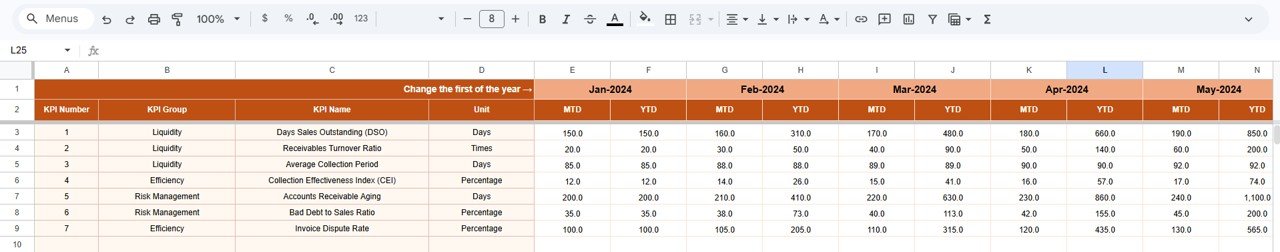
Actual Numbers Input Sheet
Click here to Purchase Accounts Receivable KPI Dashboard in Google Sheets
4. Target Number Input Sheet
The Target Number Input sheet mirrors the Actual Numbers sheet structure. Enter your monthly MTD and YTD target values for each KPI here. The Dashboard sheet uses these targets to calculate the Target vs Actual variance and apply the conditional formatting arrows. Setting realistic targets based on industry benchmarks and historical performance ensures your dashboard provides meaningful variance insights.
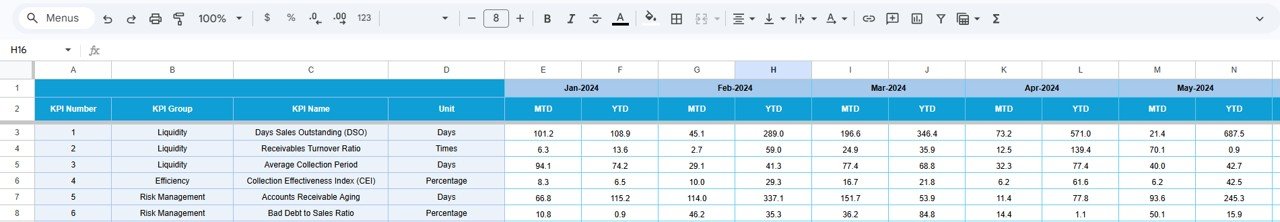
Target Number Input Sheet
5. Previous Year Number Sheet
Enter the prior year’s KPI data in this sheet using the same structure as the Actual and Target sheets. The Dashboard uses this data for the PY vs Actual comparison, and the KPI Trend sheet plots the Previous Year line alongside current Actual and Target. Year-over-year comparison is critical for identifying seasonal patterns and measuring genuine improvement versus cyclical fluctuations.
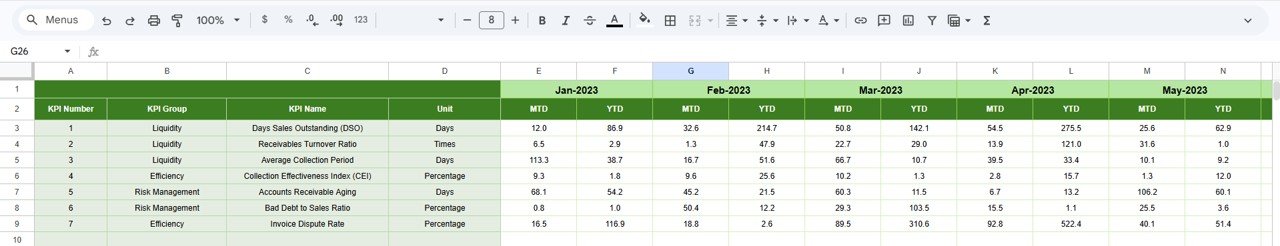
Previous Year Number Input Sheet
6. KPI Definition Sheet
The KPI Definition sheet is the configuration backbone of the entire dashboard. For each KPI, you define the KPI Name, KPI Group (e.g., Collection Efficiency, Aging, Cash Flow), Unit (%, $, days, ratio), Formula (e.g., “Total Receivables / Average Daily Sales”), KPI Definition (a plain-language explanation), and Type — LTB (Lower the Better) for metrics like DSO and bad debt ratio, or UTB (Upper the Better) for metrics like CEI and on-time payment rate.
The Type field is especially important because it controls the conditional formatting logic on the Dashboard sheet. An increase in DSO (LTB) triggers a red arrow, while an increase in CEI (UTB) triggers a green arrow. This makes the dashboard self-documenting and audit-friendly.
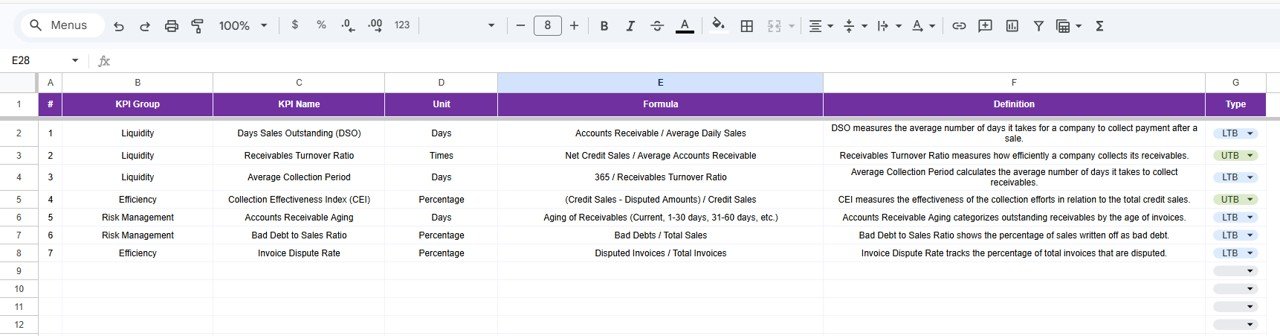
KPI Definition Sheet
Accounts Receivable KPI Dashboard vs. Microsoft Excel Dashboard vs. QuickBooks Advanced — Feature Comparison
| Feature | Accounts Receivable KPI Dashboard in Google Sheets | Microsoft Excel AR Dashboard | QuickBooks Advanced |
|---|---|---|---|
| Cost | $8.99 one-time | $14.99+ one-time (Excel version) | $200/month |
| Platform | Google Sheets (cloud-based) | Microsoft Excel (desktop) | Web-based SaaS |
| Setup time | Under 10 minutes | Under 10 minutes | 1-2 weeks |
| Real-time team collaboration | ✅ Built-in Google Sheets sharing | ❌ Requires OneDrive/SharePoint | ✅ Yes |
| Mobile access | ✅ Google Sheets mobile app | ⚠️ Limited on mobile | ✅ Yes |
| Customizable KPIs | ✅ Add/edit any KPI freely | ✅ Yes | ⚠️ Limited to preset reports |
| MTD + YTD trend charts | ✅ Yes | ✅ Yes | ✅ Yes |
| Year-over-year comparison | ✅ Built-in PY tracking | ✅ With manual setup | ✅ Yes |
| Year-1 cost at 5 users | $8.99 total | $14.99 + Excel licenses | $2,400+/year |
For finance teams that want structured AR KPI monitoring without paying $200/month for full accounting software, the Accounts Receivable KPI Dashboard in Google Sheets delivers the same receivable visibility at a fraction of the cost.
Who Should Use This Template
✅ Perfect for:
- AR managers and controllers at small to mid-sized companies (10-500 employees) tracking receivable KPIs monthly
- Finance teams needing a lightweight, shareable AR dashboard without paying for NetSuite or QuickBooks Advanced
- Startup CFOs and bookkeepers monitoring DSO, CEI, aging buckets, and bad debt ratios
- Fractional CFOs managing AR reporting across multiple client accounts
- Consultants and freelancers tracking client payment collection metrics
❌ Not a fit if:
- Your enterprise AR department needs automated ERP integration with real-time bank feeds
- You require multi-currency receivable tracking with live exchange rate conversion
- Your organization needs SOC 2 compliant audit trails with role-based access controls
Real-World Use Cases
Click here to Purchase Accounts Receivable KPI Dashboard in Google Sheets
Maria manages accounts receivable at a 60-person logistics company. She uses the Accounts Receivable KPI Dashboard in Google Sheets to track DSO, CEI, and aging bucket percentages month over month. Before board meetings, she selects the current month on the Dashboard sheet and screenshots the MTD vs Target comparison — saving 3 hours of manual report building she used to do in disconnected spreadsheets. Her CFO appreciates the year-over-year trend view that shows collection improvement since adopting the template.
James is a fractional CFO serving 4 small business clients. He duplicates the template for each client, enters their AR data monthly, and uses the KPI Trend sheet to identify which clients have deteriorating collection rates. The $8.99 one-time cost per client beats paying for separate QuickBooks Advanced subscriptions. When a client’s DSO jumped from 35 to 48 days over three months, the trend chart flagged it before it became a cash flow crisis.
Priya runs credit and collections at a SaaS startup with 200 enterprise accounts. She tracks Bad Debt Ratio and Average Days Delinquent using the dashboard’s YTD trend view. When the CEO asks for a receivable health snapshot before investor meetings, she shares the Google Sheet link directly — no exports, no PDFs, no formatting headaches. The KPI Definition sheet also serves as her team’s training document for new AR analysts.
Advantages of Accounts Receivable KPI Dashboard in Google Sheets
Click here to Purchase Accounts Receivable KPI Dashboard in Google Sheets
- Eliminates Manual Report Building — All KPIs calculate automatically from input data. No formulas to write, no charts to build manually.
- Saves $2,400+/Year vs SaaS — At $8.99 one-time, this template replaces the KPI monitoring features of $200/month accounting platforms for AR tracking.
- Cloud-Based Team Access — Share with unlimited team members via Google Drive. Real-time collaboration means everyone sees the same numbers simultaneously.
- Self-Documenting — The KPI Definition sheet ensures every team member understands each metric’s formula, purpose, and interpretation — critical for onboarding and audits.
- Configurable Fiscal Year — Set your start month on cell E1 and all months align. Works with January, April, July, or any fiscal year start.
- Year-Over-Year Comparison Built In — The Previous Year sheet enables genuine trend analysis rather than just month-to-month snapshots.
Opportunities for Improvement
- Adding Google Apps Script automation could enable email alerts when specific KPIs breach threshold values
- A direct integration with accounting software APIs (QuickBooks, Xero) could automate data import instead of manual entry
- Multi-currency support would benefit international businesses tracking receivables in different currencies
- Adding a customer-level drill-down sheet would help AR teams identify which specific clients drive aging issues
- A printable PDF export option would make it easier to share KPI reports with stakeholders who prefer offline documents
Best Practices
Click here to Purchase Accounts Receivable KPI Dashboard in Google Sheets
- Start by defining all your KPIs on the KPI Definition sheet before entering any numbers — this ensures the Dashboard and Trend sheets display correctly from day one
- Update actual numbers weekly or at minimum monthly to maintain accurate trend analysis
- Set targets based on industry benchmarks and your company’s historical performance rather than arbitrary round numbers
- Use the KPI Trend sheet during monthly finance reviews to identify 3+ month deterioration patterns early
- Share the Google Sheet with view-only access for stakeholders who need visibility without edit permissions
- Back up your data using Google Drive version history before making structural changes to the template
- Review the PY vs Actual comparison quarterly to separate genuine improvement from seasonal patterns
Explore Relevant Templates
If you find the Accounts Receivable KPI Dashboard in Google Sheets useful, explore these related templates from NextGenTemplates:
- Tax Compliance KPI Dashboard in Google Sheets — Track tax filing deadlines, compliance rates, and penalty metrics with MTD/YTD trend analysis
- Church Finance Dashboard in Google Sheets — Monitor donations, expenses, fund balances, and budget variance for religious organizations
- Professional Invoice Template in Google Sheets — Create, manage, and track invoices with auto-fill client details and payment tracking
- Balance Sheet Template in Google Sheets — Organize assets, liabilities, and equity with automated calculations
- Accounting Firms KPI Dashboard in Excel — Similar AR and financial KPI tracking built for Microsoft Excel users
Browse all Google Sheets Dashboard Templates
Frequently Asked Questions
Click here to Purchase Accounts Receivable KPI Dashboard in Google Sheets
What KPIs does the Accounts Receivable KPI Dashboard in Google Sheets track?
The dashboard tracks 15+ accounts receivable KPIs including Days Sales Outstanding (DSO), Collection Effectiveness Index (CEI), Aging Bucket Percentages (0-30, 31-60, 61-90, 90+ days), Bad Debt Ratio, and Average Days Delinquent. Each KPI shows MTD and YTD Actual, Target, and Previous Year with conditional formatting arrows.
How long does it take to set up this accounts receivable dashboard?
Setup takes under 10 minutes. Define your KPIs on the KPI Definition sheet, enter your actual, target, and previous year numbers on the three input sheets, and the Dashboard and KPI Trend sheets calculate and display everything automatically.
Can I add or remove KPIs in this Google Sheets AR dashboard?
Yes. The KPI Definition sheet lets you add, edit, or remove any KPI freely. Define the Name, Group, Unit, Formula, Definition, and Type (LTB or UTB) for each metric. The Dashboard and KPI Trend sheets update dynamically based on whatever KPIs you define.
How does this template compare to QuickBooks Advanced for AR tracking?
QuickBooks Advanced costs $200/month and requires multi-week onboarding. The Accounts Receivable KPI Dashboard in Google Sheets costs $8.99 one-time with instant access and no subscription. For teams that need KPI-level AR monitoring without full ERP functionality, this template delivers equivalent receivable visibility at a fraction of the cost.
Can multiple team members use this dashboard simultaneously?
Yes. Since it runs in Google Sheets, you can share it with unlimited team members via Google Drive. Multiple users can view or edit the dashboard simultaneously with real-time collaboration. No additional licenses or per-user fees required.
Does this template support different fiscal year configurations?
Yes. Set your fiscal year start month on cell E1 of the Actual Numbers Input sheet and all subsequent month columns align automatically. This works with any fiscal year start — January, April, July, October, or any other month.
Is this dashboard suitable for tracking AR across multiple business units?
Yes. You can duplicate the template for each business unit or track all units in a single file by adding business unit identifiers to your KPI names. The flexible KPI Definition sheet accommodates any organizational structure.
About the Author
Built by PK — Microsoft Certified Professional with 15+ years of Excel, Google Sheets, and Power BI experience. Founder of NextGenTemplates, reaching 300K+ subscribers across YouTube channels. Every template is hand-built and tested before release.
Conclusion
The Accounts Receivable KPI Dashboard in Google Sheets gives finance teams a structured, cloud-based AR monitoring system that tracks 15+ receivable KPIs with MTD/YTD trend analysis, conditional formatting variance arrows, and year-over-year comparison — all in 6 organized worksheets. It replaces hours of manual report building with a $8.99 one-time template that sets up in under 10 minutes.
Whether you are an AR manager tracking aging buckets, a controller monitoring DSO trends, or a fractional CFO reporting to multiple clients, this dashboard delivers the receivable visibility you need without paying for enterprise accounting software.
Click here to Purchase Accounts Receivable KPI Dashboard in Google Sheets
✅ Instant download · One-time payment · No subscription · Lifetime access
Visit our YouTube channel for step-by-step tutorials: Youtube.com/@NeoTechNavigators