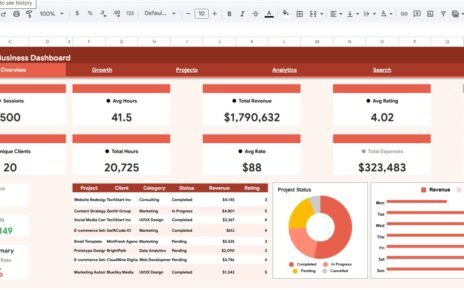
Airbnb Host Dashboard in Google Sheets is a professionally designed, ready-to-use analytics template built for Airbnb hosts, property managers, and vacation rental operators who want to track their hosting business performance using interactive Google Sheets charts, KPI cards, and dynamic slicers. Whether you manage a single listing or a portfolio of short-term rental properties across multiple locations, this dashboard transforms your raw booking data into clear, actionable visual insights that help you make smarter hosting decisions.
This dashboard includes 4 interactive analysis pages covering Overview, Revenue, Guest Analytics, and Occupancy, along with a dedicated Booking Search page and a structured Data Sheet. It tracks 5 key performance metrics including Total Bookings, Total Revenue, Avg Nightly Rate, Avg Nights Stayed, and Avg Guest Rating across multiple properties, channels, and booking statuses. In this article, we cover the dashboard structure, key features, advantages, best practices, and frequently asked questions.
Click here to Purchase Airbnb Host Dashboard in Google Sheets
Key Features of Airbnb Host Dashboard in Google Sheets
Click here to Purchase Airbnb Host Dashboard in Google Sheets
The Airbnb Host Dashboard in Google Sheets is packed with features that make it a powerful analytics tool for any short-term rental business. It includes 4 interactive dashboard pages (Overview, Revenue, Guest Analytics, Occupancy), a Booking Lookup search page, and a structured Data Sheet — 6 sheet tabs in total. The Overview page displays 5 KPI cards tracking Total Bookings, Total Revenue, Avg Nightly Rate, Avg Nights Stayed, and Avg Guest Rating.
Interactive slicers on every page allow hosts to filter data instantly by property type, location, booking channel, and booking status. The Revenue page analyzes income by location, property type, channel, and monthly trends. The Guest Analytics page evaluates guest satisfaction through rating distributions and correlation analysis. The Occupancy page tracks booking volume and stay duration patterns with quarterly breakdowns. A dedicated Search page lets users look up any booking by ID to view complete details instantly.
All charts and KPIs update automatically when data is entered in the Data Sheet. Because this template runs in Google Sheets, it offers cloud-based access, real-time team collaboration, and zero software installation. It works seamlessly across desktops, tablets, and mobile devices.
Dashboard Pages Explanation
Overview Page — Main Airbnb Analytics Dashboard
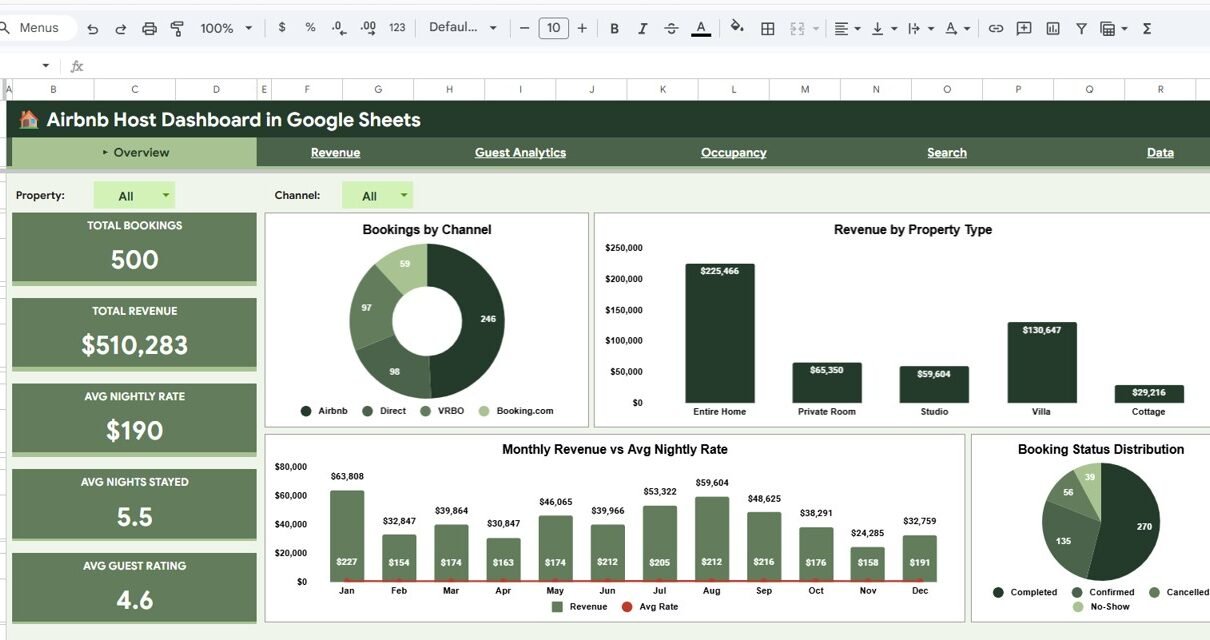
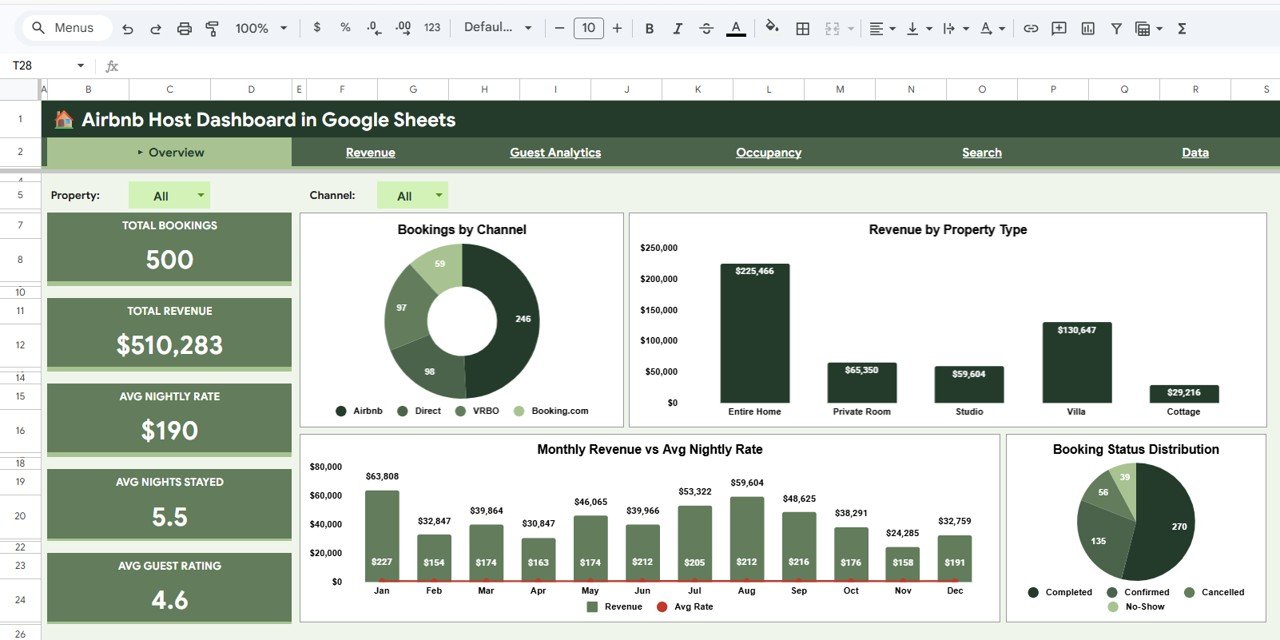
Airbnb Host Dashboard in Google Sheets
The Overview Page serves as the central command center of your Airbnb hosting analytics. At the top, it displays 5 KPI cards: Total Bookings, Total Revenue, Avg Nightly Rate, Avg Nights Stayed, and Avg Guest Rating. Below the cards, four interactive charts provide high-level insights: Bookings by Channel shows which booking platforms generate the most reservations, Revenue by Property Type highlights which property categories earn the most income, Monthly Revenue vs Avg Nightly Rate tracks pricing and revenue trends over time, and Booking Status Distribution reveals the proportion of confirmed, cancelled, and completed bookings. Multiple slicers on the right side allow instant filtering across all visualizations.
Revenue Page
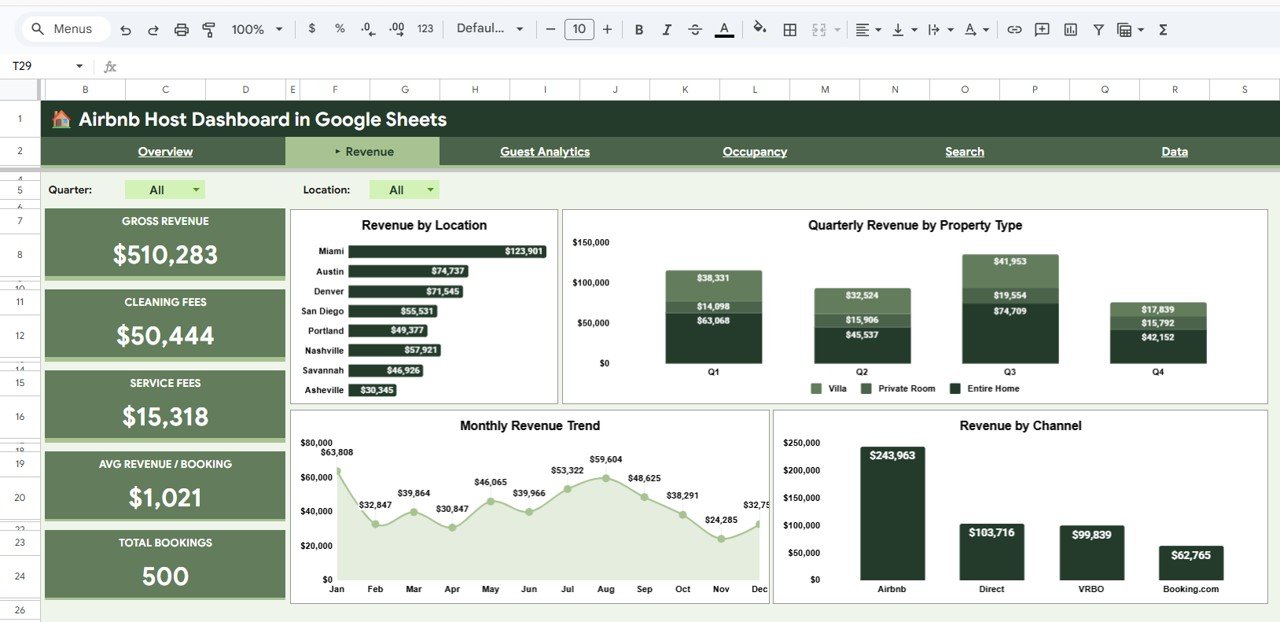
Revenue Page
The Revenue page delivers a deep dive into your hosting income. It includes Revenue by Location to identify top-earning cities and areas, Quarterly Revenue by Property Type for seasonal performance comparisons, Monthly Revenue Trend to spot growth patterns and dips, and Revenue by Channel to evaluate which booking platforms drive the most revenue. This page is essential for hosts who want to optimize their pricing strategies and focus marketing efforts on the most profitable channels and locations.
Guest Analytics Page
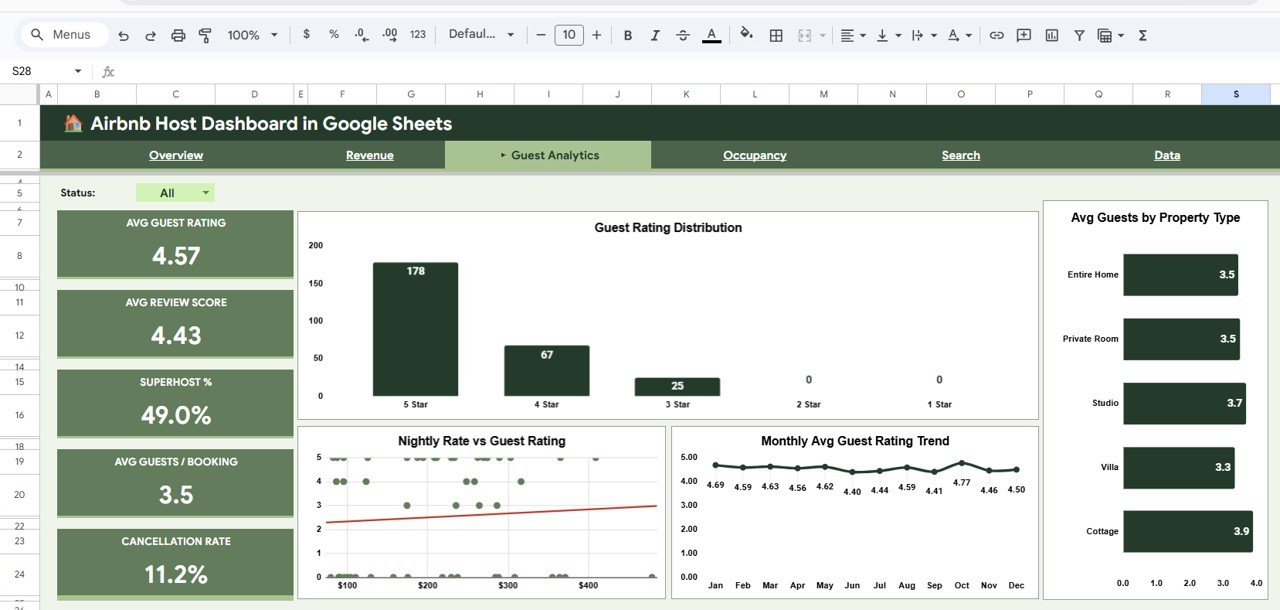
Guest Analytics Page
The Guest Analytics page focuses on guest satisfaction and behavior. Guest Rating Distribution shows how ratings are spread across your portfolio, Avg Guests by Property Type reveals which properties attract larger groups, Nightly Rate vs Guest Rating provides a scatter analysis to understand if higher-priced properties receive better or worse reviews, and Monthly Avg Guest Rating Trend tracks satisfaction changes over time. Property managers can use these insights to identify which property types consistently deliver the best guest experience and adjust their service accordingly.
Occupancy Page
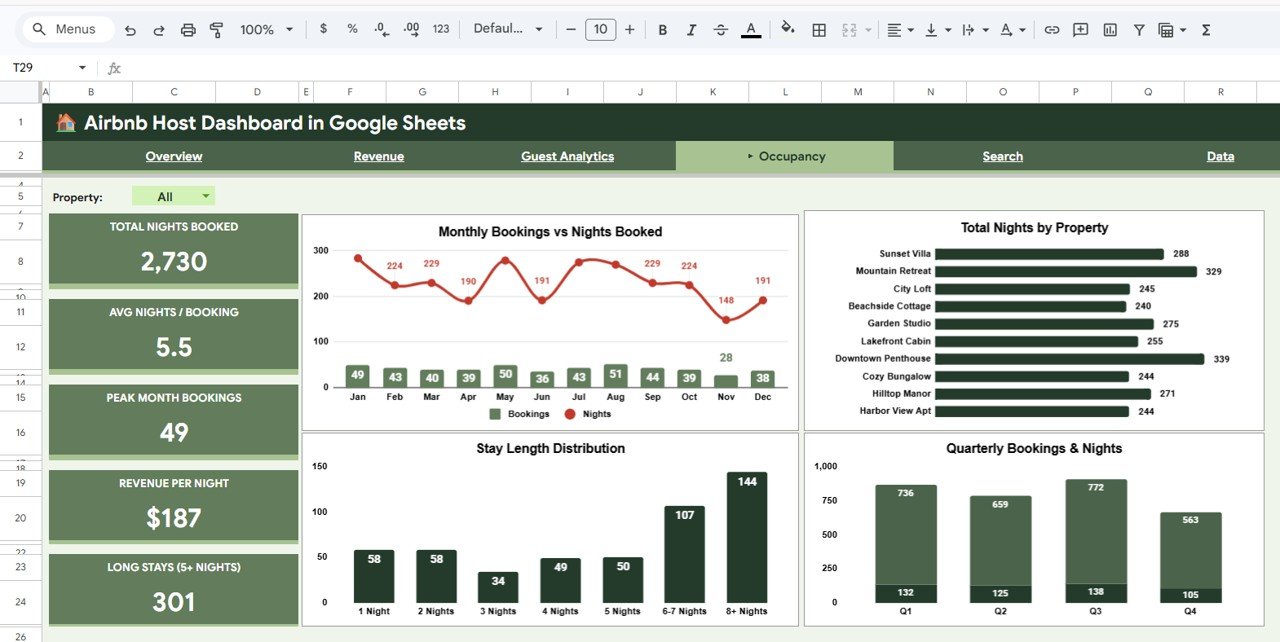
Occupancy Page
The Occupancy page analyzes booking volume and stay duration patterns. Monthly Bookings vs Nights Booked compares reservation counts against actual nights utilized, Total Nights by Property identifies which properties generate the most occupied nights, Stay Length Distribution shows whether guests prefer short weekend stays or extended bookings, and Quarterly Bookings & Nights provides seasonal occupancy trends. This analysis is crucial for hosts who want to optimize their minimum night requirements, adjust pricing for different stay lengths, and plan for peak demand periods.
Search Page — Booking Lookup
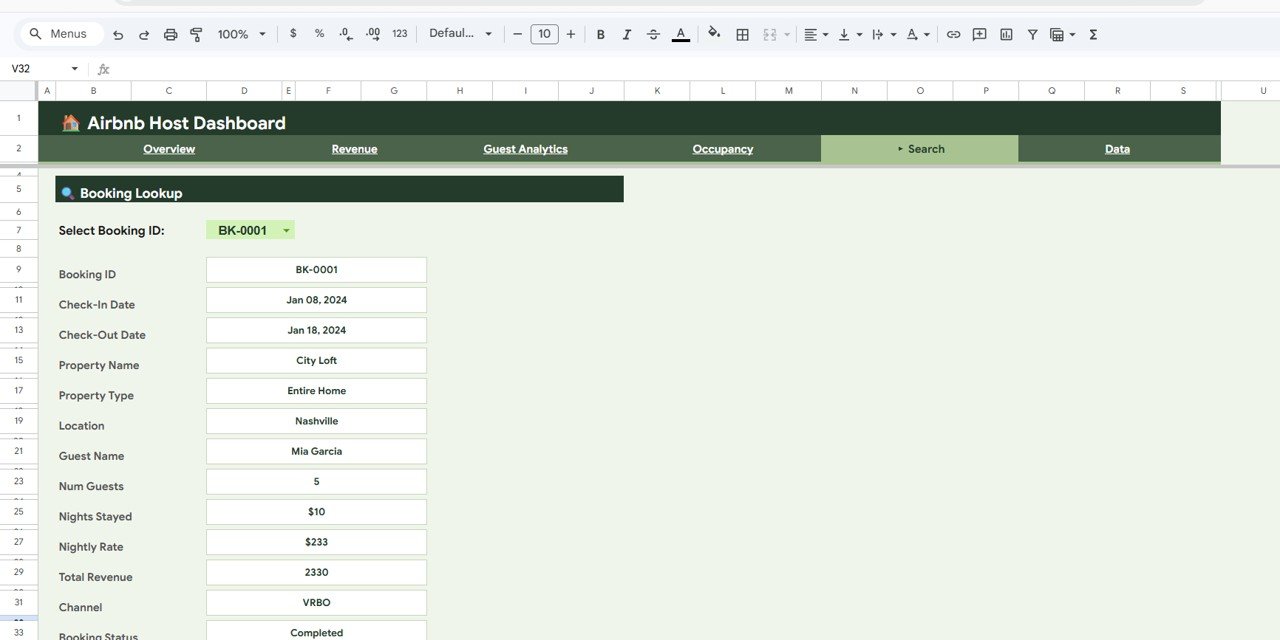
Search Sheet Tab
The Search page features a powerful Booking Lookup tool. Users can select any Booking ID from a dropdown and instantly view the complete details for that reservation including Booking ID, Check-In Date, Check-Out Date, Property Name, Property Type, Location, Guest Name, Num Guests, Nights Stayed, Nightly Rate, Total Revenue, Channel, and Booking Status. This eliminates the need to scroll through hundreds of data rows to find a specific booking.
Data Sheet
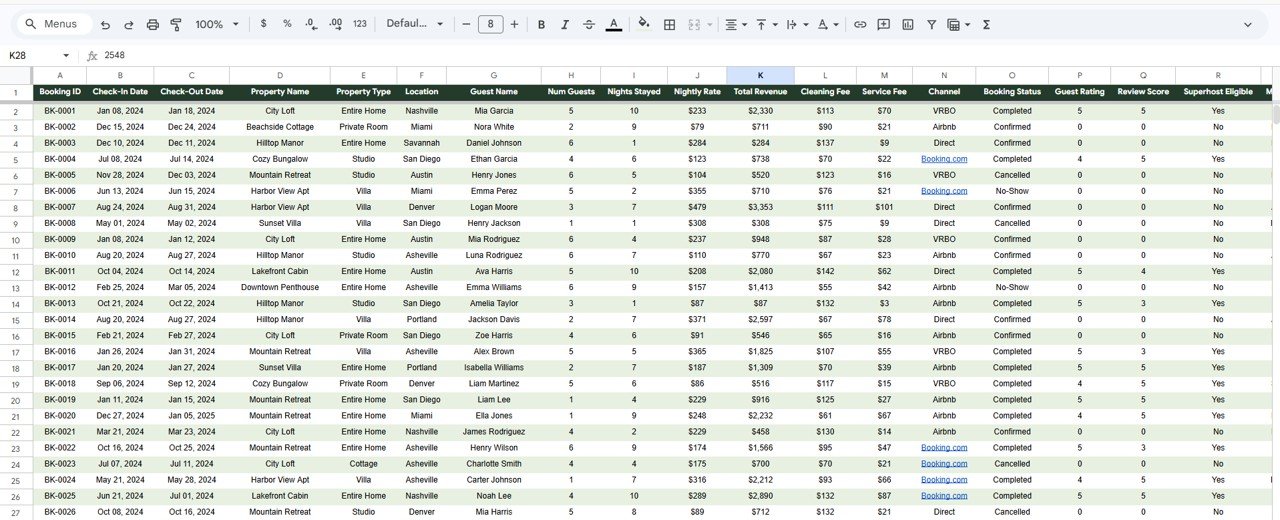
Data Sheet Tab
The Data Sheet is the input layer where all Airbnb booking records are stored. Users enter data in a structured format with columns for booking details, property information, guest data, and financial metrics. All dashboard pages pull data from this sheet automatically, so once you replace the sample data with your own records, every chart and KPI updates without any manual formula work.
Click here to Purchase Airbnb Host Dashboard in Google Sheets
Advantages of Airbnb Host Dashboard in Google Sheets
This dashboard offers several compelling advantages for Airbnb hosts and rental operators. It centralizes all booking analytics into one cloud-based template accessible from anywhere. The interactive slicers and filters allow instant segmentation by property, location, channel, or booking status. Because it runs in Google Sheets, teams can collaborate in real time without emailing files back and forth. All charts and KPIs update automatically when data changes, eliminating manual calculation errors. The template requires no advanced technical skills — basic Google Sheets knowledge is sufficient. It also works with any short-term rental platform data, not just Airbnb.
Opportunities for Improvement
While the dashboard covers essential Airbnb hosting analytics, users can enhance it further by adding property-wise profitability calculations that factor in cleaning fees and service charges. Integrating channel-specific commission tracking would provide net revenue per platform. Adding a calendar view for booking occupancy visualization would help with availability planning. Users who manage larger portfolios might also benefit from adding location-based maps or heat charts for geographic performance analysis.
Best Practices
To get the most out of this dashboard, update your booking data weekly to maintain accurate analytics. Use consistent naming conventions for properties and locations to ensure clean slicer filtering. Review the Overview page at the start of each week for a quick performance snapshot. Dive into the Revenue page monthly to evaluate pricing strategy effectiveness. Monitor the Guest Analytics page to identify properties needing service improvements. Use the Occupancy page quarterly to plan seasonal pricing adjustments and minimum stay requirements. Share the dashboard with your property management team via Google Sheets sharing permissions for collaborative decision-making.
Explore Relevant Templates
If you like this template, you might also find these related dashboards useful for your rental business:
- Airbnb Host Dashboard in Excel — The Excel version with pivot-based interactive charts and slicers for offline analysis.
- Airbnb Host Dashboard in Power BI — Advanced Power BI version with DAX-powered calculations and dynamic visuals.
- Airbnb-style Rentals Dashboard in Power BI — Comprehensive rental analytics with booking and host evaluation.
- Vacation Rental KPI Dashboard in Google Sheets — KPI-focused tracking with MTD, YTD, target vs actual comparisons.
Browse the full collection of Google Sheets Dashboard Templates and Hospitality & Tourism Templates on NextGenTemplates.com.
Frequently Asked Questions
Click here to Purchase Airbnb Host Dashboard in Google Sheets
What KPIs does the Airbnb Host Dashboard in Google Sheets track?
The Airbnb Host Dashboard in Google Sheets tracks 5 key performance indicators on the Overview page: Total Bookings, Total Revenue, Avg Nightly Rate, Avg Nights Stayed, and Avg Guest Rating. Additional analysis across dedicated pages covers revenue by location, guest rating distribution, occupancy patterns, and booking channel performance.
Do I need advanced Google Sheets skills to use this dashboard?
No. Simply create a copy of the template in your Google Drive, replace the sample data in the Data Sheet with your own Airbnb booking records, and all charts and KPI cards update automatically. No formulas or coding required.
Can I track multiple Airbnb properties with this dashboard?
Yes. The dashboard is designed to handle multiple properties across different locations. Use the built-in slicers to filter by property name, property type, or location to compare performance across your entire portfolio.
How is this different from the Airbnb Host Dashboard in Excel?
The Google Sheets version offers cloud-based access, real-time team collaboration, and no software installation requirement. The Excel version is ideal for users who prefer offline work with pivot tables and VBA support.
Can I use this dashboard for Vrbo or other short-term rental platforms?
Absolutely. While designed with Airbnb hosting terminology, the data structure works for any short-term rental platform including Vrbo, Booking.com, VRBO, and similar services. Simply enter your booking data in the required format.
What is the best Google Sheets dashboard for Airbnb hosts?
The Airbnb Host Dashboard in Google Sheets from NextGenTemplates is one of the best options available. It includes 4 interactive dashboard pages, a booking search feature, and a structured data sheet — providing a complete analytics solution for any Airbnb hosting business.
Conclusion
The Airbnb Host Dashboard in Google Sheets is a powerful cloud-based analytics solution for Airbnb hosts, property managers, and vacation rental businesses. With 4 interactive dashboard pages, a booking lookup feature, and a structured data sheet, it delivers complete visibility into booking performance, revenue trends, guest satisfaction, and occupancy patterns. Whether you manage a single property or a multi-location portfolio, this template helps you make data-driven decisions that improve profitability and guest experience.
Click here to Purchase Airbnb Host Dashboard in Google Sheets
Visit our YouTube channel to learn step-by-step video tutorials
Youtube.com/@NeoTechNavigators
Click here to Purchase Airbnb Host Dashboard in Google Sheets