Organizations collecting customer surveys often struggle to turn raw feedback data into actionable insights. According to industry benchmarks, companies that track Net Promoter Score alongside product-level feedback resolve 35% more cases within SLA and retain 20% more at-risk accounts. The Product Feedback and NPS Dashboard in Google Sheets consolidates 5 KPIs, 4 slicer-driven charts, and 5 dedicated analysis pages into a single browser-based file that any team member can access and edit simultaneously.Product Feedback and NPS Dashboard in Google Sheets
If your feedback data sits scattered across survey tools, spreadsheets, and email threads, this dashboard brings it together. It tracks NPS Rating, Response Time, Cases Resolved, Follow-up Required, and Number of Surveys — broken down by product, region, channel, and month — so product managers, CX leads, and support teams can spot detractors, slow response areas, and resolution bottlenecks in under 10 minutes.
Key Features of the Product Feedback and NPS Dashboard in Google Sheets
Click here to Purchase the Product Feedback and NPS Dashboard in Google Sheets
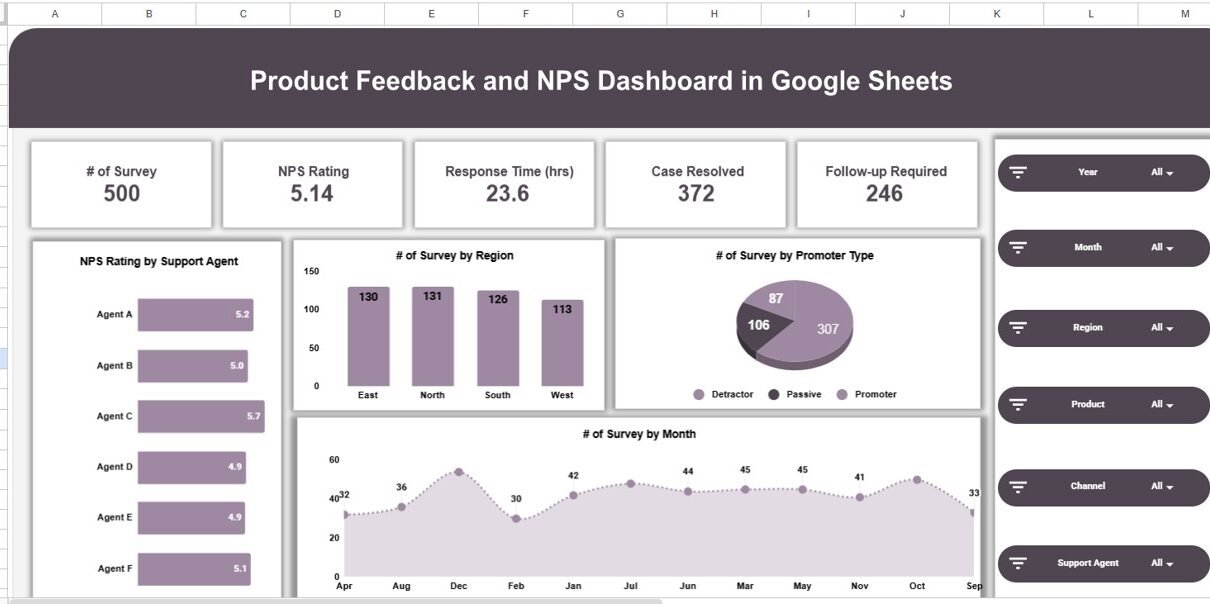
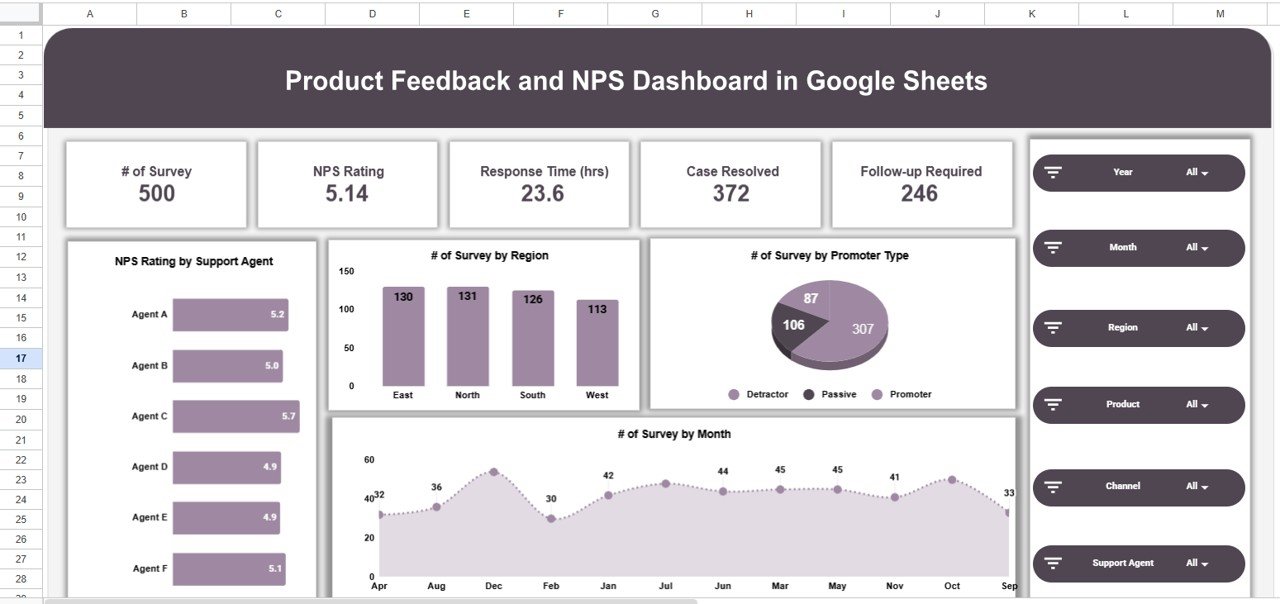
The Product Feedback and NPS Dashboard in Google Sheets tracks 5 KPIs across 7 interactive pages. The Overview page displays Number of Surveys, NPS Rating, Response Time (hrs), Cases Resolved, and Follow-up Required as summary cards, with 4 slicer-driven charts that filter the entire page instantly.
The 4 overview charts — NPS Rating by Support Agent, Number of Surveys by Region, Number of Surveys by Promoter Type, and Number of Surveys by Month — give managers an at-a-glance view of agent performance, geographic distribution, promoter-vs-detractor mix, and survey volume trends. Slicers let you filter all charts simultaneously without editing any formula.
A built-in Search Sheet with column-selector dropdown and keyword field lets you find any survey record in seconds. Select a column, type a keyword, and the sheet instantly filters all matching entries with a Total Record count. This eliminates the need to scroll through hundreds of rows manually.
The dashboard is built entirely in Google Sheets — no add-ons, no macros, no software to install. Multiple team members can view and edit simultaneously from desktop, tablet, or mobile via the Google Sheets app. Every chart and KPI card updates automatically when new rows are added to the Data Sheet.
Dashboard Pages Explanation
Click here to Purchase the Product Feedback and NPS Dashboard in Google Sheets
1. Overview Page
The Overview page is the main command center. It displays 5 KPI cards at the top — Number of Surveys, NPS Rating, Response Time (hrs), Cases Resolved, and Follow-up Required — followed by 4 charts. NPS Rating by Support Agent shows which agents consistently score high or low. Number of Surveys by Region reveals geographic engagement patterns. Number of Surveys by Promoter Type breaks responses into Promoters, Passives, and Detractors. Number of Surveys by Month tracks volume trends across the year. Multiple slicers at the top let you filter all charts at once.Product Feedback and NPS Dashboard in Google Sheets
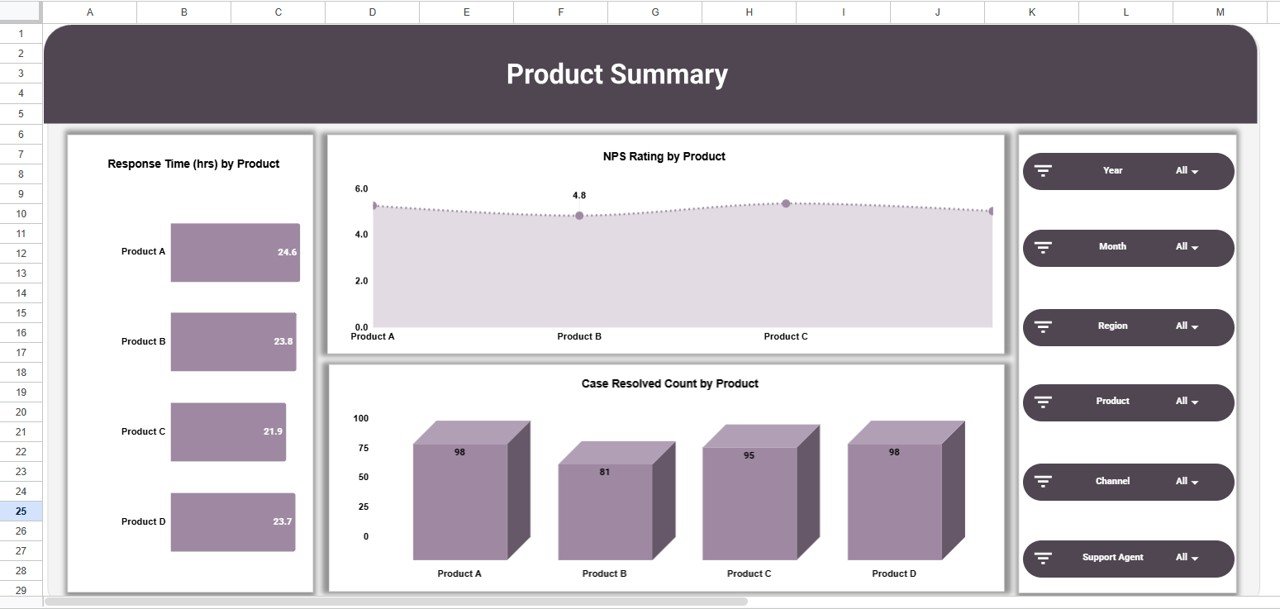
2. Product Summary
This page contains 3 analysis charts — Response Time (hrs) by Product, NPS Rating by Product, and Case Resolved Count by Product. Product managers use this to identify which products generate the most detractors, which have the slowest response cycles, and which resolve the most cases. If a specific product line consistently shows low NPS, it signals a product-level issue rather than a service-level one.Product Feedback and NPS Dashboard in Google Sheets
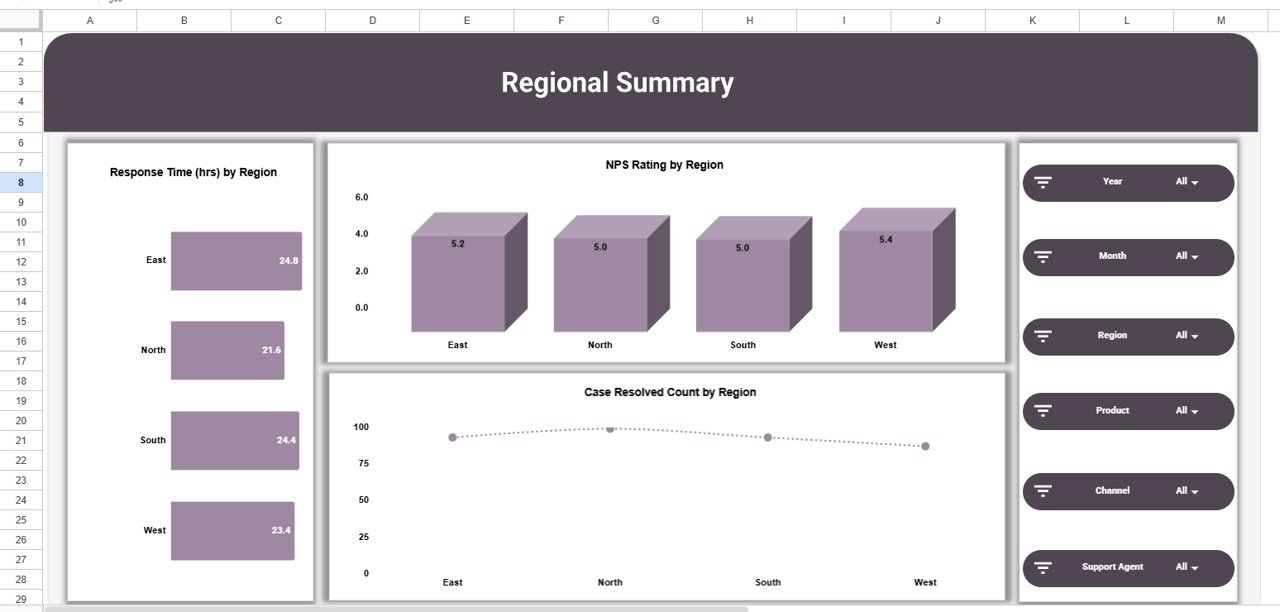
3. Regional Summary
Click here to Purchase the Product Feedback and NPS Dashboard in Google Sheets
Three charts break down Response Time by Region, NPS Rating by Region, and Case Resolved Count by Region. Multi-location businesses use this to compare service quality across geographies. If one region shows significantly higher response times, it may indicate staffing gaps or process differences that need attention.
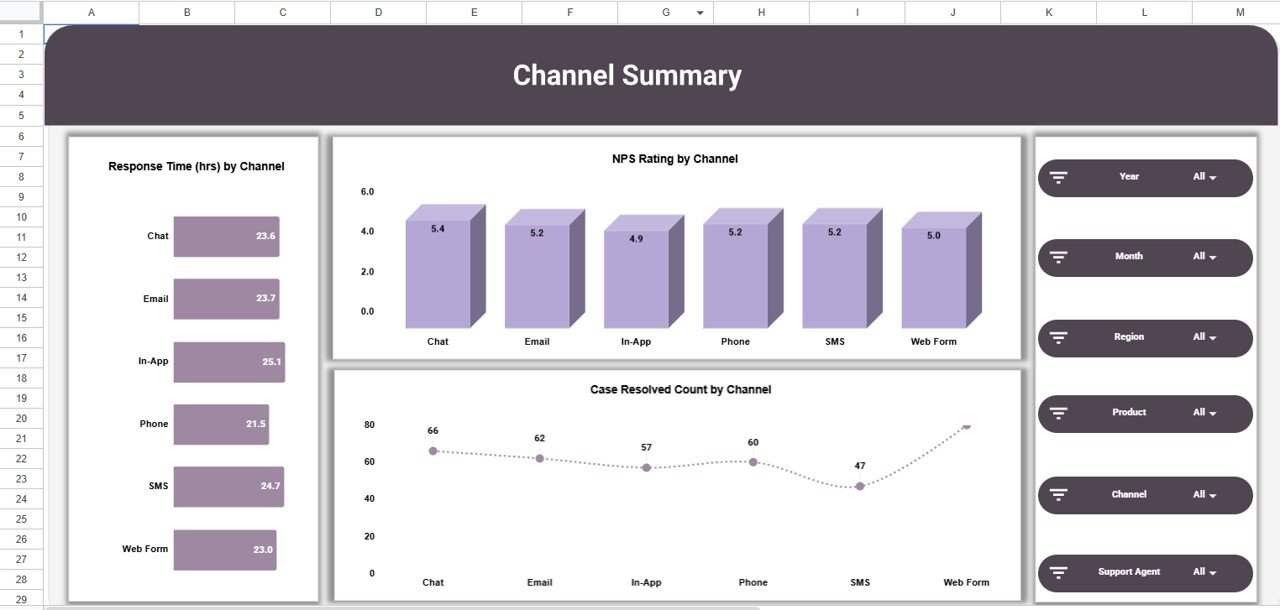
4. Channel Summary
Response Time by Channel, NPS Rating by Channel, and Case Resolved Count by Channel help evaluate whether email, phone, chat, or social media delivers the fastest resolutions and highest satisfaction. Teams often discover that one channel outperforms others significantly, guiding resource allocation decisions.
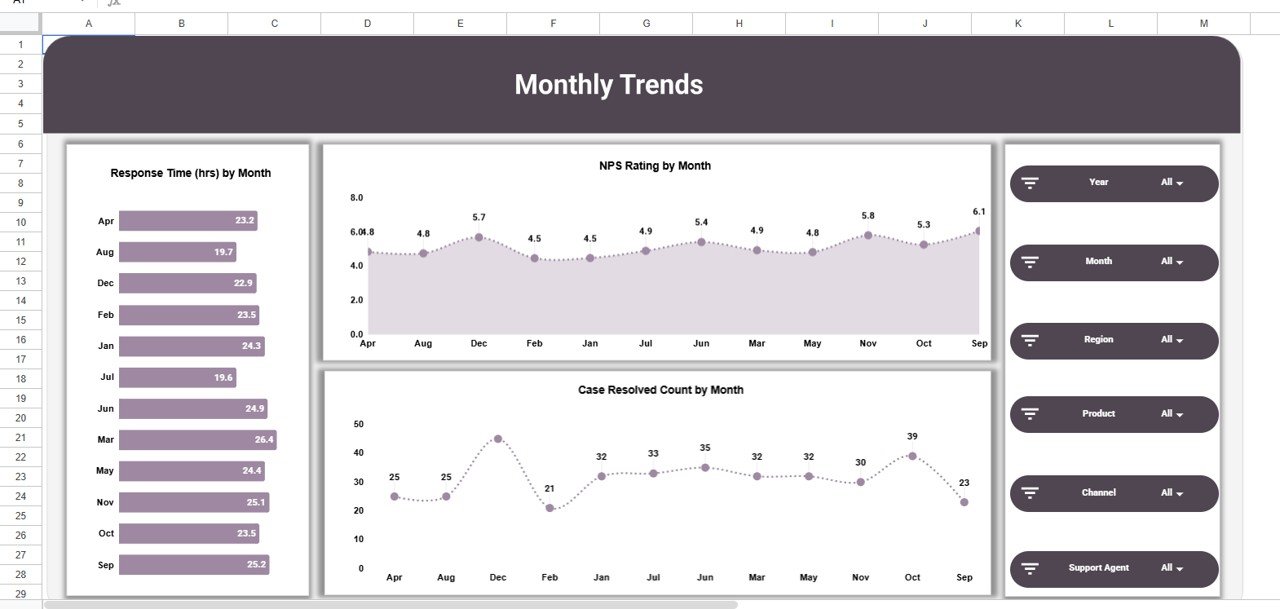
5. Monthly Trends
Click here to Purchase the Product Feedback and NPS Dashboard in Google Sheets
Three trend charts — Response Time by Month, NPS Rating by Month, and Case Resolved Count by Month — track performance over time. This page is essential for measuring the impact of process improvements, new training programs, or seasonal variations in feedback volume.Product Feedback and NPS Dashboard in Google Sheets
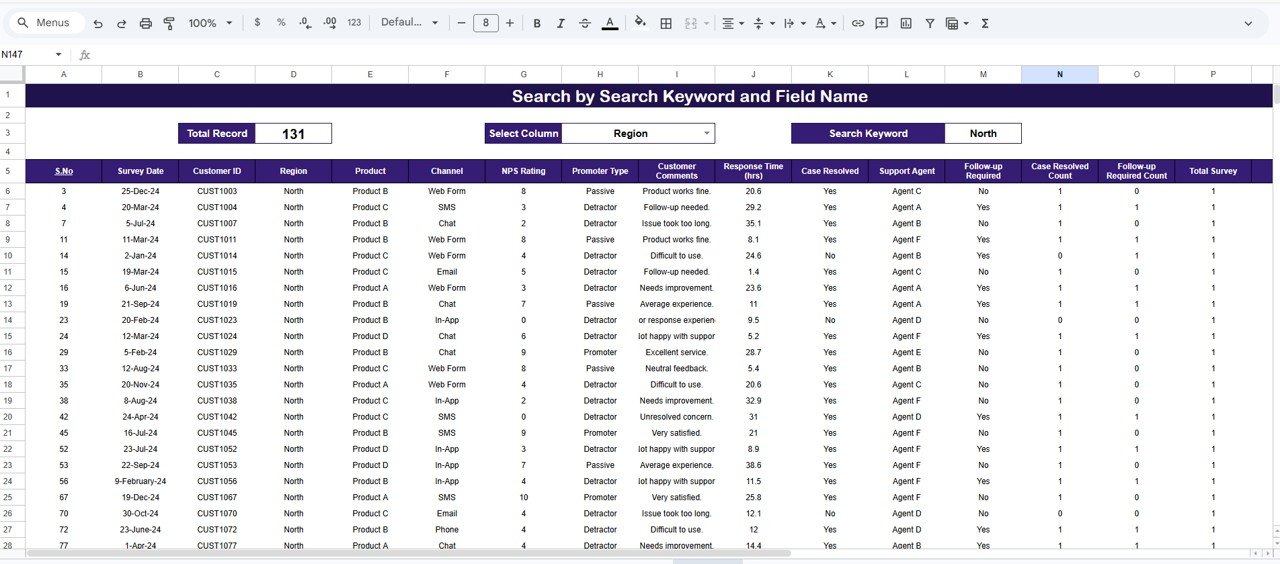
6. Search Sheet
Select any column from the dropdown, type a keyword in the Search Keyword field, and the sheet instantly filters all matching survey records. A Total Record count displays at the top so you know exactly how many entries match. This is useful for pulling all feedback mentioning a specific product, agent, or issue type.
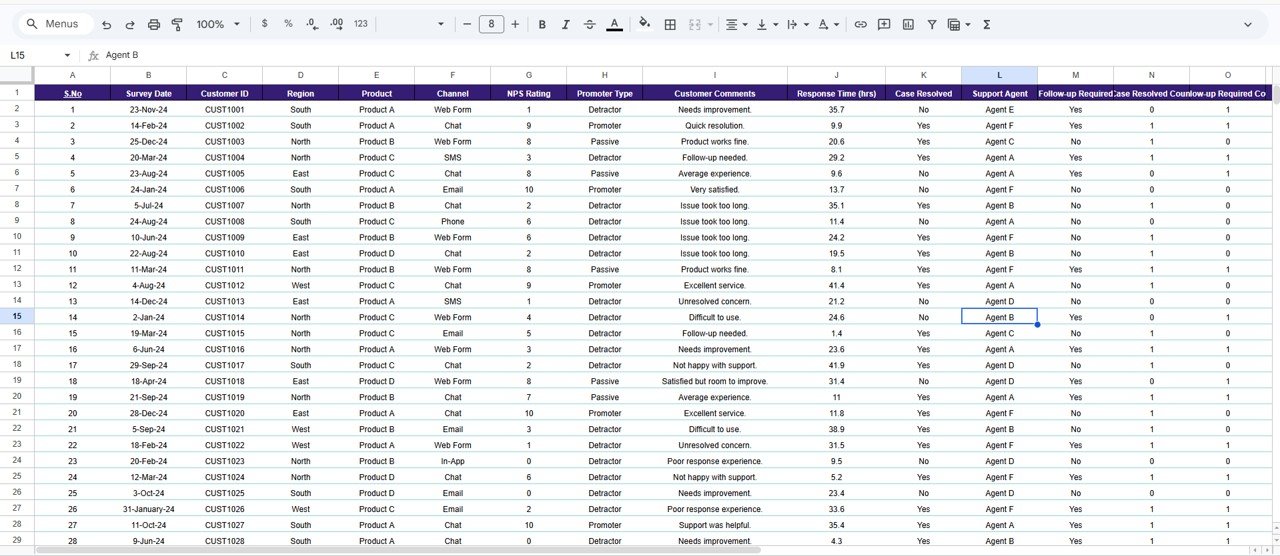
7. Data Sheet
Click here to Purchase the Product Feedback and NPS Dashboard in Google Sheets
The master data table where all survey records are stored. Add new rows in the same column format and every dashboard page updates automatically. No formulas to edit, no pivot tables to refresh — just enter data and analyze.
Product Feedback and NPS Dashboard vs. Microsoft Excel Dashboard vs. Paid Feedback SaaS — Feature Comparison
| Feature | Product Feedback and NPS Dashboard in Google Sheets | Microsoft Excel Dashboard | Paid SaaS (Medallia / Qualtrics / SurveyMonkey) |
|---|---|---|---|
| Cost | $9.99 one-time ✅ | $9.99–$12.99 one-time | $25–$300 per user/month |
| Platform | Google Sheets (any device) ✅ | Excel (desktop-first) | Cloud SaaS — vendor lock-in |
| Setup time | Under 10 minutes ✅ | Under 10 minutes | 2–8 weeks |
| Real-time collaboration | Yes — multi-user live edits ✅ | Limited | Yes |
| Mobile access | Yes (app + browser) ✅ | Limited | Yes |
| Slicer-driven filtering | 4 slicers on Overview ✅ | Excel slicers | Pre-built filters |
| Built-in keyword search | Yes — Search Sheet ✅ | Ctrl+F only | Advanced search |
| Customizable fields | Fully editable ✅ | Fully editable | Vendor-controlled |
| Year-1 cost at 5 users | $9.99 ✅ | $9.99–$12.99 | $1,500–$18,000 |
For teams that want slicer-driven NPS and product feedback analysis without a per-seat subscription, this dashboard sits in the sweet spot — real-time collaboration, 7 analysis pages, and built-in search for the price of a single SaaS day pass.
Who Should Use This Template
Click here to Purchase the Product Feedback and NPS Dashboard in Google Sheets
Perfect for:
- Product managers tracking NPS and case resolution across multiple products at 10–500 person companies
- Customer success and CX leads consolidating feedback from surveys, tickets, and NPS campaigns
- Founders and SaaS makers who want a $9.99 alternative to $1,500+/year survey analytics tools
- Support managers comparing agent, regional, and channel performance
- Operations teams presenting monthly trend data at leadership reviews
Not a fit if:
- You need SOC 2 compliance, SSO, or direct API integrations with Salesforce/Zendesk
- You need in-app survey collection (this dashboard analyzes existing data, it does not collect responses)
- You need AI-powered sentiment analysis on open-text feedback fields
Real-World Use Cases
Ananya is a product manager at a 120-person edtech startup in Bangalore. She uses the Product Feedback and NPS Dashboard in Google Sheets to consolidate NPS results from 4 product lines. The Product Summary page lets her present a “lowest-NPS products” breakdown at monthly reviews — replacing a $4,800/year Qualtrics subscription with a one-time $9.99 template.
Carlos runs CX at a 50-person B2B SaaS company in Mexico City. He uses the Regional Summary to compare NPS between LATAM and US clients, and the Channel Summary to evaluate email vs. live chat resolution speed. The Monthly Trends page proved to his leadership that NPS improved 12 points since Q1.
Priya leads customer support at a D2C brand in Mumbai. She uses the Search Sheet to pull all survey records mentioning “shipping delay” and the Overview slicers to filter by Detractor — creating a targeted follow-up list for her team in under 2 minutes.
Advantages of the Product Feedback and NPS Dashboard
Click here to Purchase the Product Feedback and NPS Dashboard in Google Sheets
- 7 analysis pages covering overview, product, region, channel, monthly trends, search, and data entry — all linked and auto-updating
- Slicer-driven filtering on the Overview page lets you drill into any segment without editing formulas
- Built-in keyword search across all survey records — faster than scrolling or using Ctrl+F
- Real-time collaboration in Google Sheets — share with your team and edit simultaneously from any device
- $9.99 one-time vs. $1,500–$18,000/year for equivalent SaaS tools — no recurring fees, no vendor lock-in
- Under 10 minutes to set up — replace sample data and start analyzing immediately
Opportunities for Improvement
- The dashboard does not collect survey responses directly — you need to export data from your survey tool (Google Forms, Typeform, etc.) and paste it into the Data Sheet
- No AI-powered sentiment analysis on open-text comments — analysis focuses on numeric NPS and structured fields
- Slicer-driven filtering works on the Overview page; individual summary pages (Product, Regional, Channel, Monthly) show all data without page-level filters
- For teams with 10,000+ survey records, Google Sheets may experience slower performance compared to a dedicated BI tool like Power BI or Tableau
Best Practices
- Update the Data Sheet weekly or monthly for trend accuracy — stale data reduces dashboard value
- Use consistent naming for products, regions, and channels — variations like “Email” vs. “email” create separate chart entries
- Review the Monthly Trends page quarterly to measure the impact of CX improvement initiatives
- Share the dashboard with read-only access for stakeholders who need visibility but should not edit raw data
- Pair this dashboard with the NPS Dashboard in Google Sheets for a deeper NPS-only analysis or the Product Feedback Tracker in Excel for VBA-powered data entry with login protection
Explore Relevant Templates
- NPS Dashboard in Google Sheets — focused NPS-only analysis with slicer-driven charts
- Product Feedback Tracker in Excel — VBA-powered tracker with login, data entry form, and slicer dashboard
- Customer Experience & Service Quality Dashboard in Google Sheets — broader CX analytics covering satisfaction, communication, and NPS
- Customer Satisfaction Survey Tracker in Google Sheets — survey tracker with timeliness and communication scoring
- Customer Experience KPI Dashboard in Google Sheets — MTD/YTD KPI scorecard for NPS, CSAT, churn, and 10 CX metrics
- Browse all Google Sheets Dashboard Templates
Frequently Asked Questions
Click here to Purchase the Product Feedback and NPS Dashboard in Google Sheets
What pages are included in the Product Feedback and NPS Dashboard?
The Product Feedback and NPS Dashboard in Google Sheets includes 7 pages — Overview with 5 KPI cards and 4 slicer-driven charts, Product Summary, Regional Summary, Channel Summary, Monthly Trends, Search Sheet, and Data Sheet — all connected so adding a record updates every page automatically.
What KPIs does the Overview page display?
The Overview page shows 5 KPI cards: Number of Surveys, NPS Rating, Response Time (hrs), Cases Resolved, and Follow-up Required. Four charts visualize NPS by Support Agent, Surveys by Region, Surveys by Promoter Type, and Surveys by Month.
How long does setup take?
Setup takes under 10 minutes — open the PDF guide, click the copy link, replace sample data in the Data Sheet, and all 7 pages update automatically. No formulas or coding needed.
How does this compare to paid NPS tools like Medallia or Qualtrics?
Paid NPS platforms typically cost $25–$300 per user per month — about $1,500 to $18,000 per year for five users. The Product Feedback and NPS Dashboard in Google Sheets is $9.99 one-time with no recurring fees, no per-user pricing, and full data ownership.
Can multiple people use this dashboard at the same time?
Yes. The dashboard runs in Google Sheets, which supports real-time multi-user collaboration. Multiple team members can view, filter, and edit simultaneously from any device — desktop, tablet, or mobile.
Does the dashboard include a search feature?
Yes. The built-in Search Sheet lets you select any column from a dropdown, type a keyword, and instantly filter all matching records. A Total Record count displays how many entries match your search criteria.
Is this a one-time purchase?
Yes. The Product Feedback and NPS Dashboard is $9.99 one-time, instant download, no subscription, no per-user fees, and lifetime access with free updates whenever the template is revised.
About the Author
Built by PK — Microsoft Certified Professional with 15+ years of Excel, Google Sheets, and Power BI experience. Founder of NextGenTemplates, reaching 300K+ subscribers across YouTube channels. Every template is hand-built and tested before release.
Conclusion
The Product Feedback and NPS Dashboard in Google Sheets gives product managers, CX leads, and support teams a clear, slicer-driven view of NPS, response times, and case resolution across products, regions, channels, and months — all in one $9.99 file that runs in any browser.
Click here to Purchase the Product Feedback and NPS Dashboard in Google Sheets
✅ Instant download · One-time payment · No subscription
👉 Youtube.com/@NeoTechNavigators