In today’s knowledge-driven world, organizations rely heavily on internal knowledge bases to support employees, customers, and operations. However, many teams struggle to measure how effective their knowledge base actually is. Without proper tracking, it becomes difficult to identify gaps, improve content quality, and enhance user experience.Knowledge Base KPI Dashboard in Google Sheets
So, how can you track knowledge base performance, monitor KPIs, and improve efficiency—all in one place?Knowledge Base KPI Dashboard in Google Sheets
Knowledge Base KPI Dashboard in Google Sheets.
This powerful and ready-to-use dashboard helps you track key performance indicators (KPIs), analyze trends, and make data-driven decisions. Moreover, it includes KPI definitions, formulas, and performance indicators like Lower the Better or Upper the Better, making it a complete solution.Knowledge Base KPI Dashboard in Google Sheets
Get the Knowledge Base KPI Dashboard in Google Sheets
What is a Knowledge Base KPI Dashboard?
A Knowledge Base KPI Dashboard in Google Sheets is an interactive tool that helps organizations monitor and analyze the performance of their knowledge base using structured KPIs.
Instead of manual reporting, this dashboard allows you to:
- 📚 Track knowledge base performance metrics
- 📊 Monitor MTD (Month-to-Date) and YTD (Year-to-Date) data
- 🎯 Compare Actual vs Target vs Previous Year
- 📈 Analyze trends and performance gaps
- 🧠 Understand KPI definitions and formulas
Why Do You Need a Knowledge Base KPI Dashboard?
Many organizations maintain knowledge bases, but they often fail to measure their effectiveness.
However, with this dashboard:
- You identify content gaps quickly
- You improve support efficiency
- You enhance user satisfaction
- You track performance continuouslyKnowledge Base KPI Dashboard in Google Sheets
Key Features of Knowledge Base KPI Dashboard
This dashboard includes 6 well-structured worksheets, each designed for a specific purpose.Knowledge Base KPI Dashboard in Google Sheets
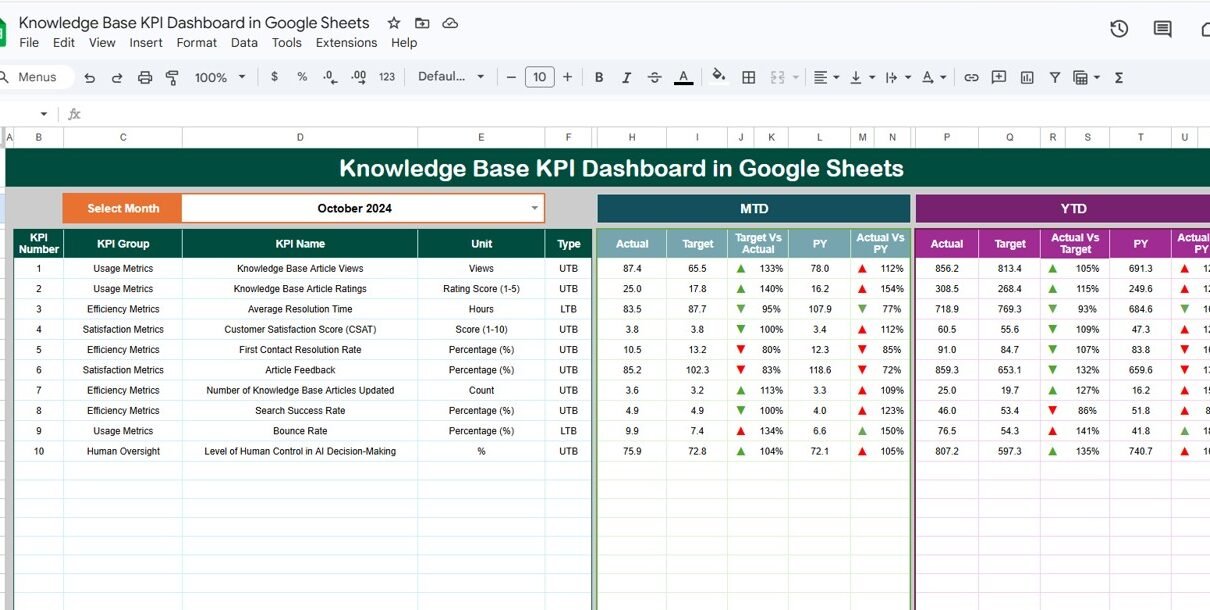
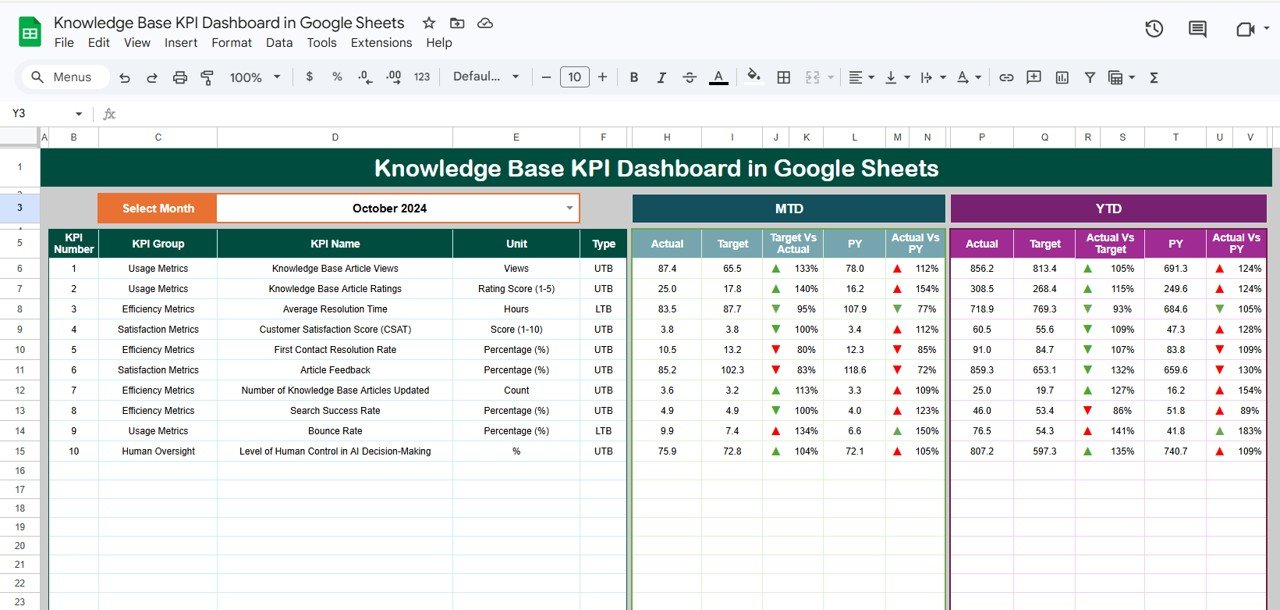
1. Dashboard Sheet – Central KPI Overview
This is the main dashboard page, where all KPI insights are displayed.
Key Highlights:
- 📅 Month Selector (Cell D3)
- 📊 Displays MTD & YTD metrics
- 🎯 Shows Actual vs Target vs Previous Year
- 🔺 Conditional formatting (Up/Down arrows)
2. KPI Trend Sheet – Deep KPI Insights
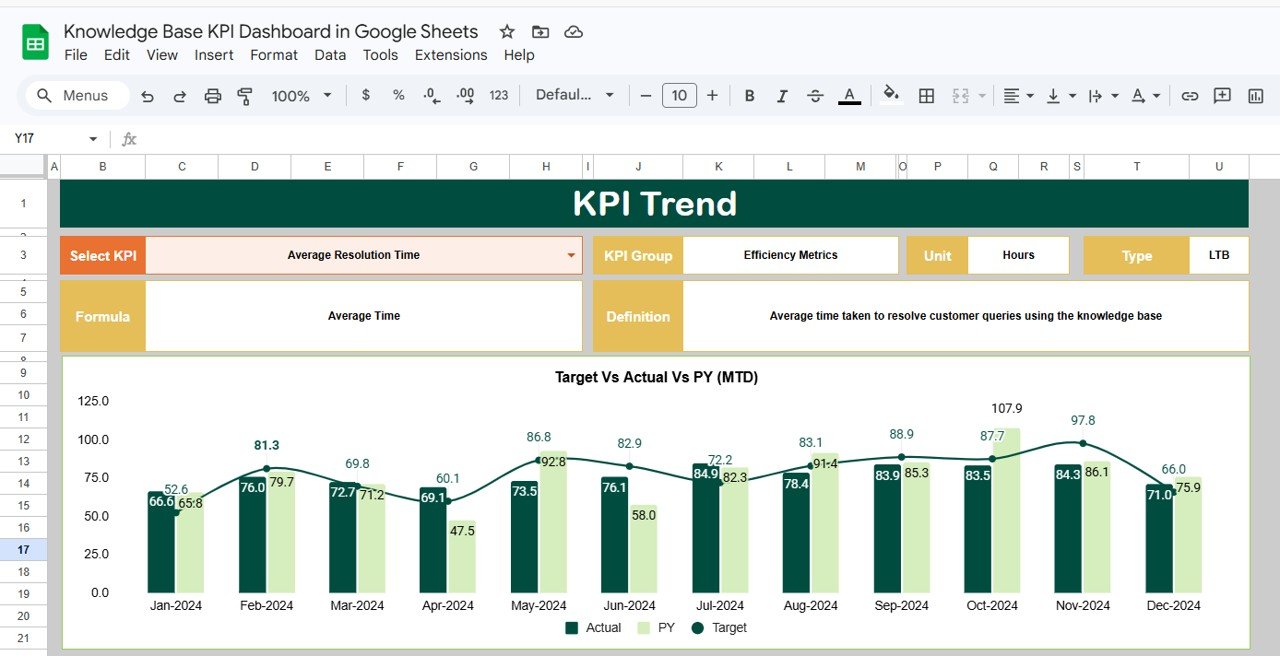
This sheet helps you analyze individual KPIs in detail.
Features:
- Dropdown selection for KPI (Cell C3)
- Displays:
- KPI Group
- KPI Unit
- KPI Type (Lower/Upper the Better)
- KPI Formula
- KPI Definition
3. Actual Number Sheet – Enter Current Data
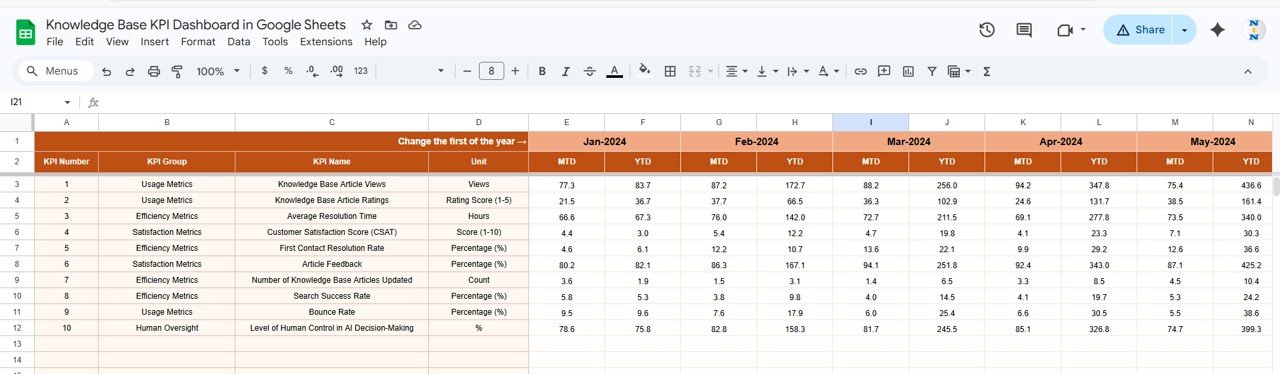
This sheet is used for entering actual performance data.
Key Points:
- Enter MTD and YTD values
- Select month from Cell E1
- Input first month of the year
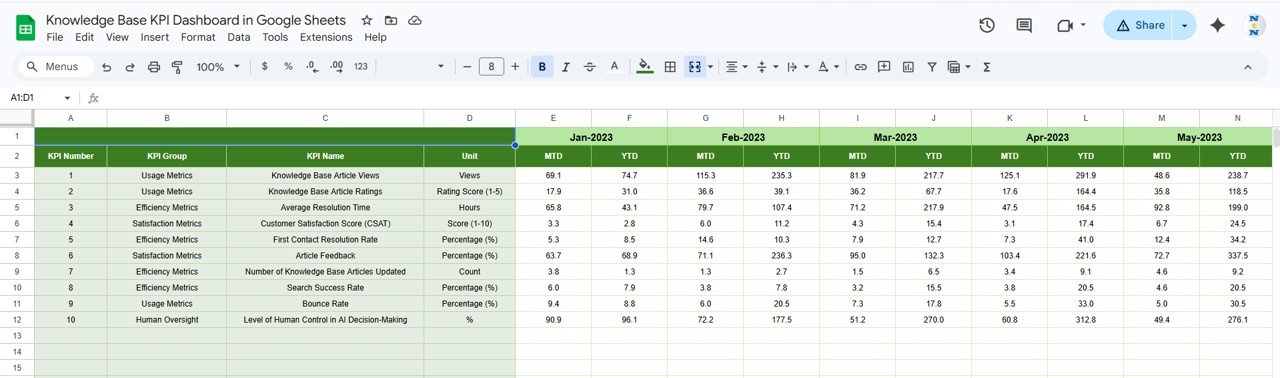
4. Target Sheet – Define Performance Goals
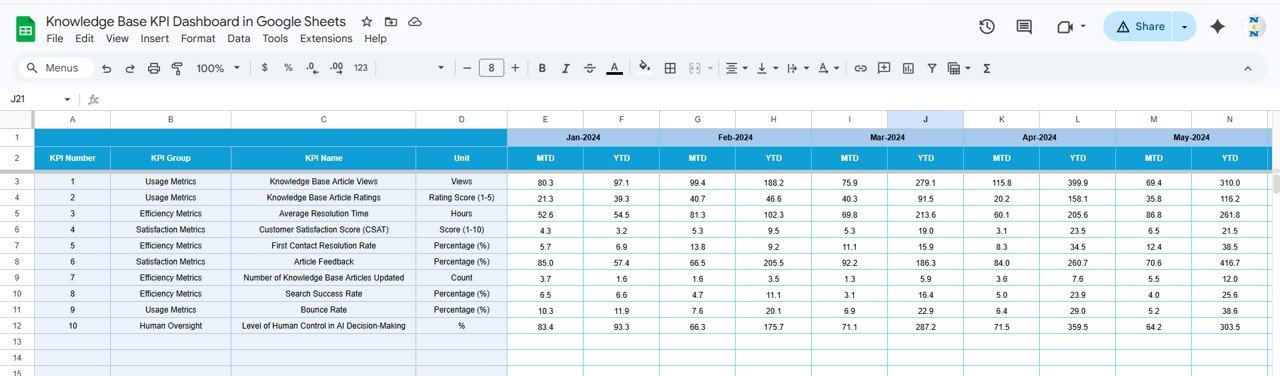
This sheet allows you to set KPI targets.
Includes:
- Monthly targets (MTD & YTD)
- KPI-wise target entry
5. Previous Year Sheet – Historical Comparison
This sheet stores last year’s data.
Purpose:
- Compare current vs previous year performance
- Identify growth trends
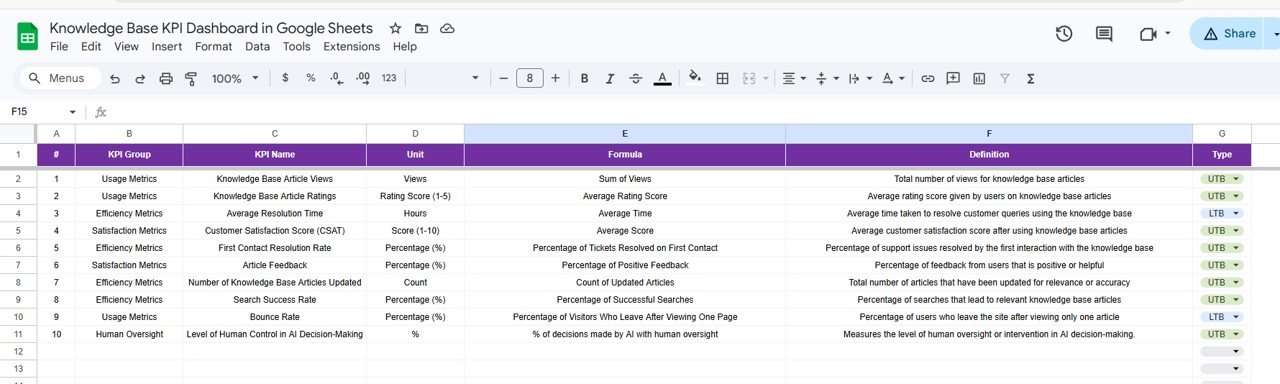
6. KPI Definition Sheet – Complete KPI Documentation
This sheet acts as a KPI repository.
Includes:
- KPI Name
- KPI Group
- Unit of Measurement
- Formula
- KPI Definition
How Does This Dashboard Help Your Business?
This dashboard transforms raw data into actionable insights.
Because:
- You track performance in real time
- You identify improvement areas
- You standardize KPI definitions
- You improve decision-making
Advantages of Knowledge Base KPI Dashboard
Using this dashboard offers several benefits:
🎯 Better KPI Tracking
- You monitor all KPIs in one place
- You improve performance visibility
📊 Data-Driven Decisions
- You use real data for decisions
- You reduce guesswork
📈 Performance Improvement
- You identify weak areas
- You optimize processes
🧠 Knowledge Standardization
- You define KPIs clearly
- You maintain consistency
💼 Improved Productivity
- You reduce manual reporting
- You save time
Best Practices for the Knowledge Base KPI Dashboard
To get the best results, follow these best practices:
📌 Maintain Data Accuracy
- Enter correct data
- Avoid missing values
📊 Focus on Important KPIs
- Track only relevant metrics
- Avoid unnecessary complexity
🔄 Update Data Regularly
- Refresh data monthly
- Monitor performance continuously
🎯 Use KPI Types Effectively
- Understand “Lower the Better” vs “Upper the Better”
- Evaluate performance correctly
📈 Analyze Trends
- Track monthly and yearly changes
- Identify patterns
If you want to go further with KPI reporting, the Excel Pivot Tables & Dashboards course on NextGenTemplates Academy covers the fundamentals with practice files.
Get the Knowledge Base KPI Dashboard in Google Sheets
Conclusion
The Knowledge Base KPI Dashboard in Google Sheets is a powerful and structured tool for tracking and improving knowledge management performance.
Moreover, it simplifies complex KPI tracking into clear and actionable insights. As a result, you can improve efficiency, enhance decision-making, and drive better outcomes.
So, if you want to optimize your knowledge base and track KPIs effectively, this dashboard is a must-have solution.