If you keep stock in more than one warehouse, a single stock list quickly stops being enough. This guide explains a multi-location inventory management system in Google Sheets that tracks stock IN, stock OUT and transfers between warehouses, and shows the closing stock and stock value of every product in every location for any date you pick.
It is aimed at small distributors, retailers with a back store, e-commerce sellers with more than one storage point, and anyone who moves goods between sites. The template has four tabs: Summary, Input Data, Product Master and List. Below you will find how each one works, a worked example with the template’s own numbers, and the formula logic behind transfers.
🎥 Watch the Video Tutorial
Get the Multi-Location Inventory Template
What Problem This Template Solves
With one warehouse, “stock = received − issued” is easy. With several, you also need to know where each unit sits, and a transfer has to reduce stock in one place and increase it in another without changing the company total. Doing that by hand in separate sheets leads to double counting. This template keeps every movement in one log and calculates each warehouse’s position from it.
Multi-Location Inventory Management: The Four Tabs
1. Summary: every product in every warehouse
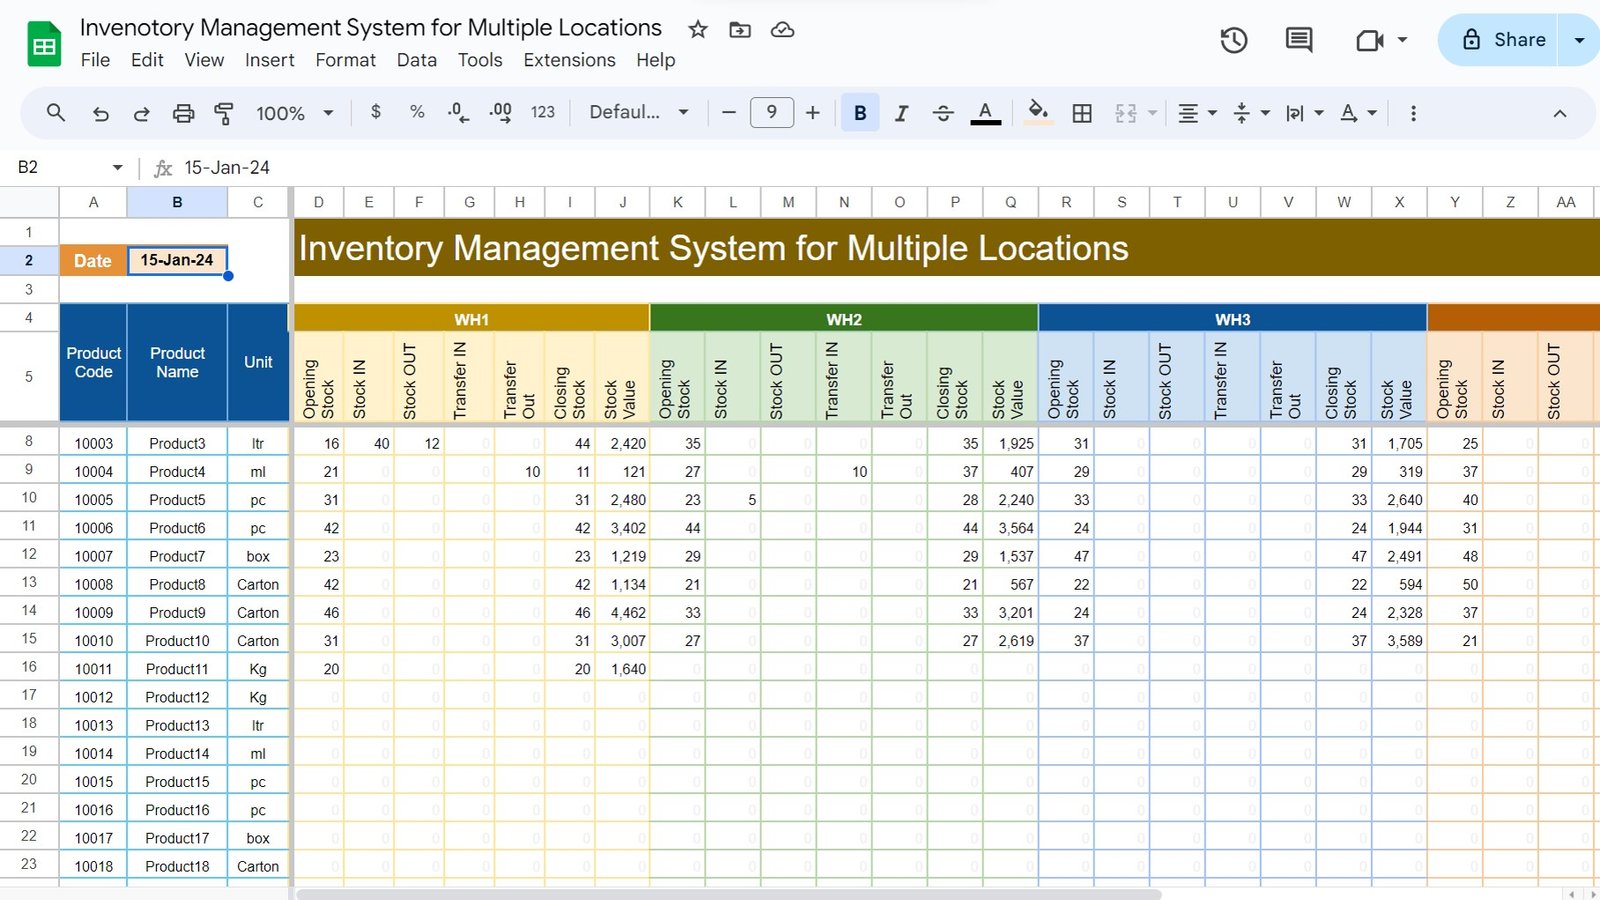
Enter a date in cell B2 (double-click to open the date picker). Columns A to C list Product Code, Product Name and Unit. From column D onwards each warehouse (WH1, WH2, WH3, WH4) gets its own colour-coded block with seven columns:
- Opening Stock – balance before the selected date
- Stock IN and Stock OUT – receipts and issues on that date
- Transfer IN and Transfer Out – units moved in from, or out to, another warehouse
- Closing Stock – balance at the end of the date
- Stock Value – closing stock multiplied by the cost per unit
2. Input Data: the single transaction log
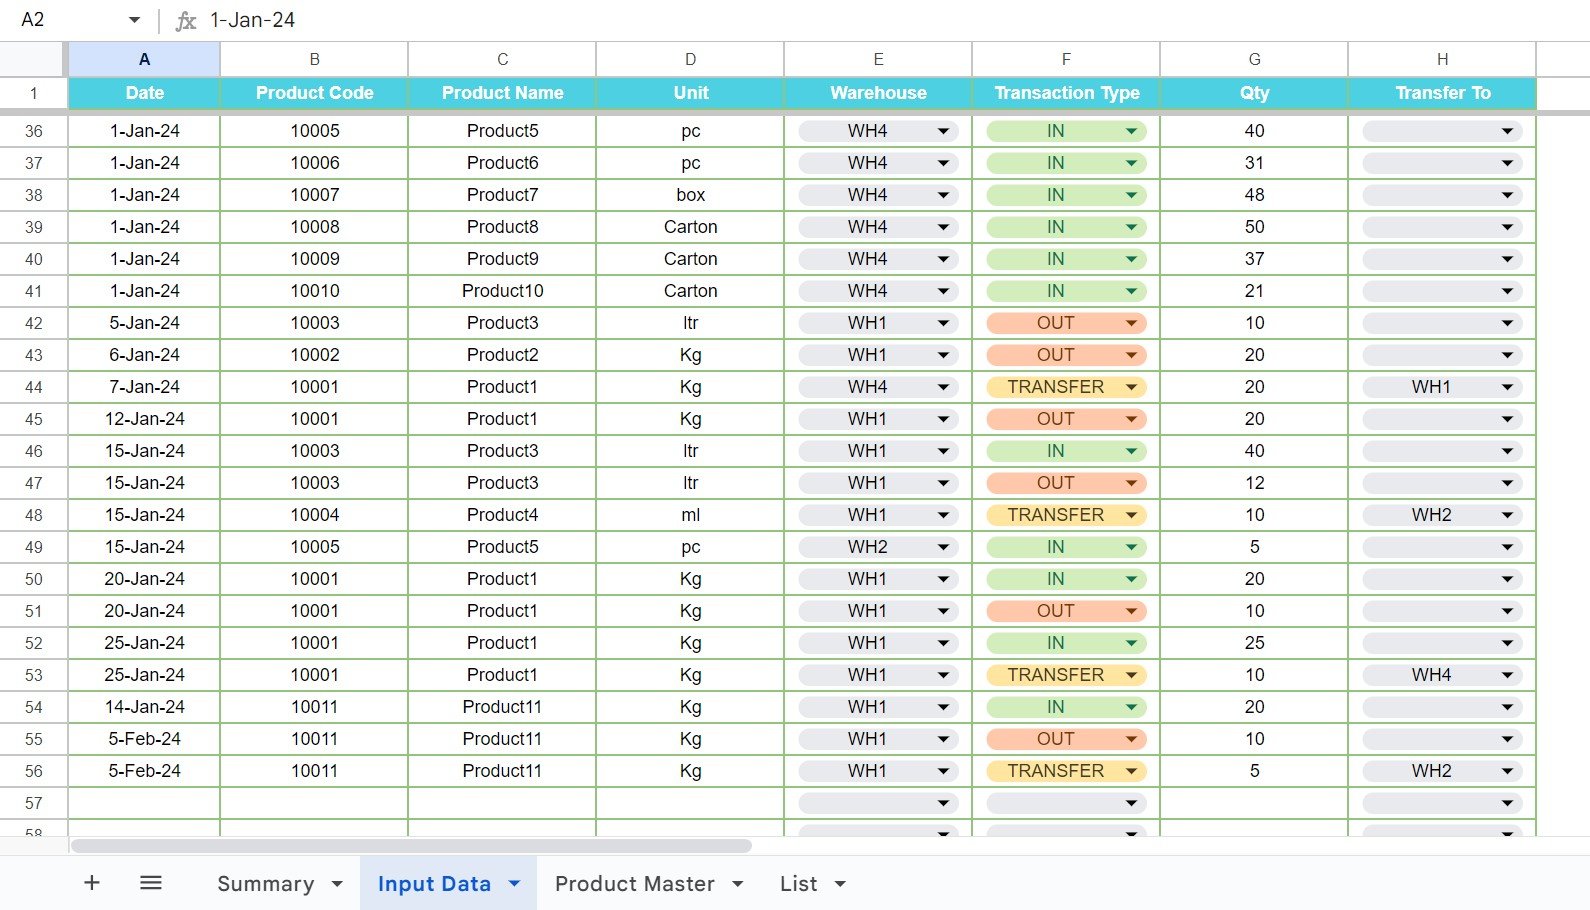
Every movement is one row with these columns: Date, Product Code, Product Name, Unit, Warehouse, Transaction Type, Qty and Transfer To. Product Name and Unit fill in automatically from the Product Code. Warehouse and Transaction Type are dropdowns; Transaction Type has three values: IN, OUT and TRANSFER. For a TRANSFER row, the Warehouse column is the source and Transfer To (also a dropdown) is the destination.
3. Product Master: codes, units and cost
The master list holds Product Code, Product Name, Unit (dropdown) and Cost Per Unit. The sample has 20 products, 10001 to 10020. Cost Per Unit is what turns closing quantity into Stock Value on the Summary.

4. List: warehouses and units
The List tab feeds the dropdowns. Column A (WH Name) holds WH1 to WH4, and the Unit column holds Kg, g, ltr, ml, pc, box and Carton. Add a name here and it appears in the dropdowns, which keeps spelling consistent across the log.

Worked Example: 15-Jan-24
On 15-Jan-24 the Input Data tab contains these entries, among others: Product3 in WH1 has an IN of 40 and an OUT of 12; Product4 is moved from WH1 with a TRANSFER of 10 to WH2; Product5 has an IN of 5 in WH2. Here is how the Summary shows them:
| Product / Warehouse | Opening | Movement on 15-Jan-24 | Closing Stock | Cost Per Unit | Stock Value |
|---|---|---|---|---|---|
| Product3 / WH1 | 16 | +40 IN, −12 OUT | 44 | 55 | 2,420 |
| Product4 / WH1 | 21 | −10 Transfer Out | 11 | 11 | 121 |
| Product4 / WH2 | 27 | +10 Transfer IN | 37 | 11 | 407 |
| Product5 / WH2 | 23 | +5 IN | 28 | 80 | 2,240 |
Notice the transfer: one TRANSFER row reduced WH1 by 10 and increased WH2 by 10. The total quantity of Product4 across both warehouses is the same before and after (21 + 27 = 48, and 11 + 37 = 48), which is exactly how a transfer should behave.
The Formula Logic Behind the Summary
Each warehouse block follows the same rule:
Closing Stock = Opening Stock + Stock IN − Stock OUT + Transfer IN − Transfer Out
Stock Value   = Closing Stock × Cost Per Unit
If you want to build a similar sheet yourself, SUMIFS on the Input Data log does the work. Assuming the log columns are A = Date, B = Product Code, E = Warehouse, F = Transaction Type, G = Qty and H = Transfer To, and the selected date is in $B$2, the WH1 cells for a product in row 8 could be:
Stock IN:     =SUMIFS('Input Data'!G:G,'Input Data'!B:B,$A8,'Input Data'!E:E,"WH1",'Input Data'!F:F,"IN",'Input Data'!A:A,$B$2)
Stock OUT:    =SUMIFS('Input Data'!G:G,'Input Data'!B:B,$A8,'Input Data'!E:E,"WH1",'Input Data'!F:F,"OUT",'Input Data'!A:A,$B$2)
Transfer IN:  =SUMIFS('Input Data'!G:G,'Input Data'!B:B,$A8,'Input Data'!H:H,"WH1",'Input Data'!F:F,"TRANSFER",'Input Data'!A:A,$B$2)
Transfer Out: =SUMIFS('Input Data'!G:G,'Input Data'!B:B,$A8,'Input Data'!E:E,"WH1",'Input Data'!F:F,"TRANSFER",'Input Data'!A:A,$B$2)
For Opening Stock, use the same four SUMIFS with the date condition "<"&$B$2 and combine them with the closing-stock rule. The purchased template already contains working formulas, so you only need this if you want to customise it.
How to Use It with Your Own Data
- Open the List tab and rename WH1 to WH4 to your real locations (for example “Main Store”, “Godown 2”).
- Replace the sample products in Product Master with your codes, names, units and cost per unit.
- Clear the sample rows in Input Data and post an IN for each product’s opening stock in each warehouse, dated the day before you start.
- From then on, log every receipt (IN), issue or sale (OUT) and movement between sites (TRANSFER with Transfer To).
- On the Summary tab, change the date in B2 to see the position for that day.
Real-World Use Cases
- Distributor with a central warehouse and branch godowns: see which branch is running low before customers notice.
- Retail shop with front counter and back store: treat each as a warehouse and log transfers when shelves are refilled.
- Online seller using two fulfilment points: compare stock value tied up in each location.
Best Practices
- Never type a warehouse or unit by hand; always use the dropdowns so SUMIFS matches exactly.
- Record transfers as one TRANSFER row, not as an OUT in one warehouse and an IN in another, or the movement columns will be misleading.
- Update Cost Per Unit when purchase prices change and note the date you changed it.
- Do a physical count per warehouse each month and post differences as IN or OUT adjustments.
Limitations to Know
- Stock value uses a single cost per unit, not FIFO or weighted-average costing.
- The sample layout has four warehouse blocks; adding a fifth means copying a block and adjusting its formulas.
- It is a spreadsheet, not barcode software. If you scan hundreds of items an hour, a dedicated inventory app will suit you better.
For a single-location version with a product search card, read our inventory management system in Google Sheets. You may also find calculating stock levels with simple formulas, the warehouse management KPI dashboard and the inventory management dashboard in Google Sheets useful.
If you want to go further with SUMIFS and lookup formulas like the ones above, the Excel AI Mastery: 100 Formulas course on NextGenTemplates Academy teaches them with practice files.
Related templates: Inventory Tracker in Google Sheets · Inventory Management Dashboard in Google Sheets
Frequently Asked Questions
How do I track inventory across multiple locations in Google Sheets?
Keep one transaction log with a Warehouse column, and calculate each location’s balance with SUMIFS filtered by warehouse. This template does that for four warehouses and shows them side by side.
How are transfers between warehouses recorded?
Choose TRANSFER as the Transaction Type, select the source warehouse in the Warehouse column and the destination in Transfer To. The Summary shows it as Transfer Out for the source and Transfer IN for the destination.
How is Stock Value calculated?
Closing Stock multiplied by the Cost Per Unit from Product Master. For example, 44 units of Product3 at 55 each give 2,420.
Can I add more warehouses or units?
Units and warehouse names can be added in the List tab. The Summary shows four warehouse blocks, so a fifth location needs one more block with the same formulas.
Can I check stock for an earlier date?
Yes. Change the date in B2 on the Summary tab; opening stock, movements and closing stock all recalculate for that date.
Can my team update it at the same time?
Yes. It is a Google Sheets file, so you can share it and several people can log transactions together. Protect the Summary tab if others should only enter data.
Wrapping Up
One log, one product list and clear transfer rules are what make multi-location inventory management work in a spreadsheet. Set up your warehouses in the List tab, enter opening stock, and you will know what sits where on any date.
Get the Multi-Location Inventory Template
📅 Last updated: October 2026