A sales commission template with bonus amount in Google Sheets takes the arguing out of payday. You log each sale once, and the sheet works out the commission rate, the commission amount, whether the agent hit the daily target, the bonus earned and the total payout for any date range you choose.
This guide is for sales managers, small business owners and finance teams who pay agents on a tiered commission plus a target bonus. Below you will see each of the four tabs (Summary, Input Data, Commission Rates and Sales Agents), how the tiers turn sales into money, a worked example you can check by hand, and the lookup formulas you can use to build the same logic yourself.
🎥 Watch the Video Tutorial
Get the Sales Commission Template
What the Sales Commission Template Includes
| Tab | What you do there | What it contains |
|---|---|---|
| Summary | Pick a Start Date and End Date, then read the results | Total Commission, Total Bonus and Total Earning cards plus a row-by-row payout table |
| Input Data | Log every sale | Date, Agent Name (drop-down) and Total Sales |
| Commission Rates | Set your plan once | Sales tiers with their commission rate, and target-achievement tiers with their bonus |
| Sales Agents | Maintain the team list | Sales Agent Name and Daily Sales Target |
1. Summary Tab
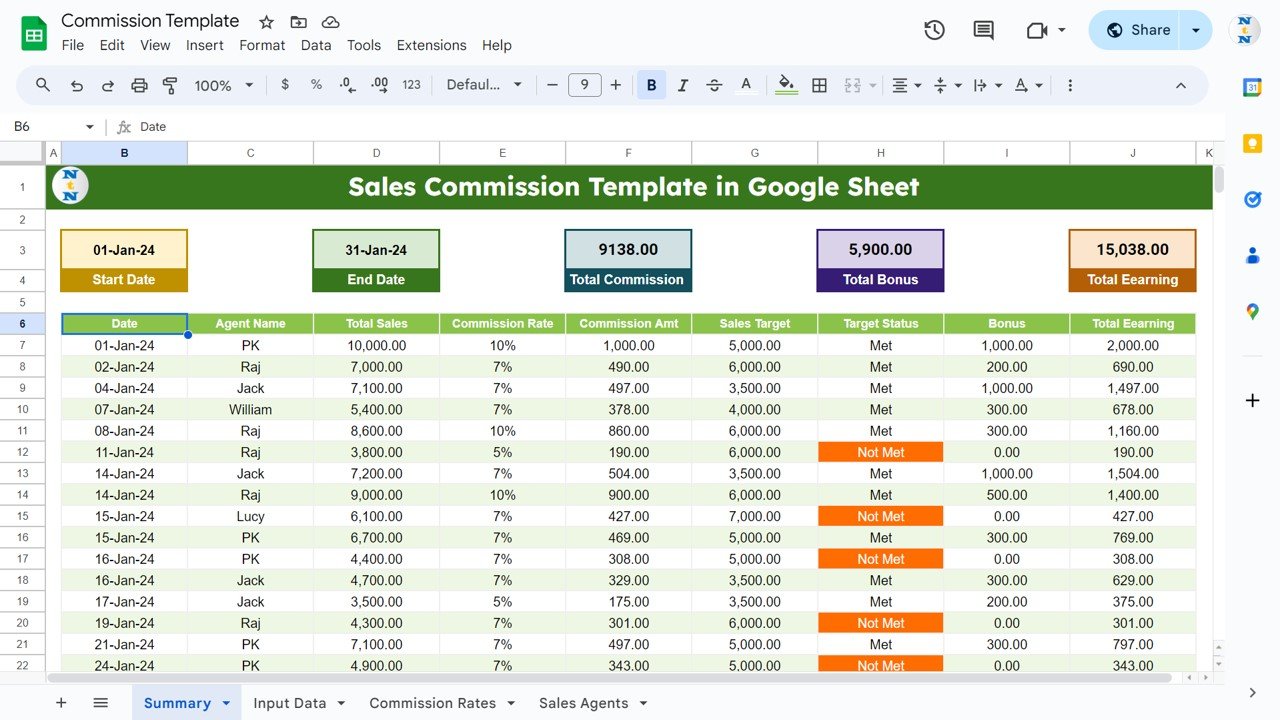
The top row holds two date inputs and three result cards. With the range set to 01-Jan-24 to 31-Jan-24, the sample data shows:
- Total Commission: 9,138.00
- Total Bonus: 5,900.00
- Total Earning: 15,038.00 (commission plus bonus)
Below the cards, the table lists every sale in the chosen period with these columns: Date, Agent Name, Total Sales, Commission Rate, Commission Amt, Sales Target, Target Status, Bonus and Total Earning. Rows where the target was missed show Not Met in an orange cell, so they stand out straight away.
2. Input Data Tab
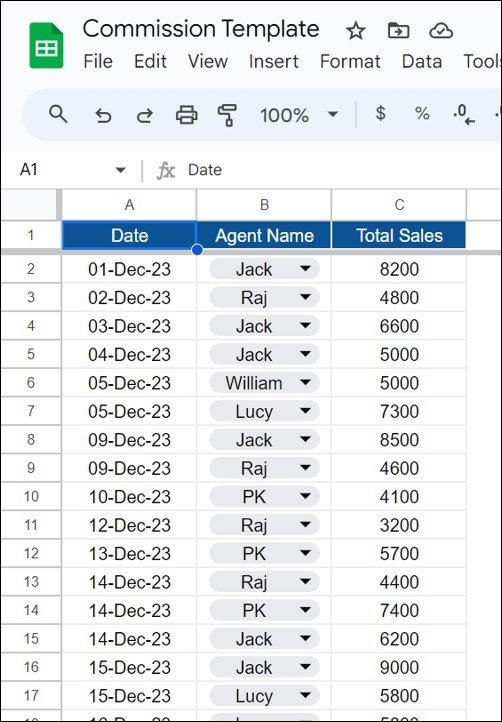
This is the only tab you touch day to day. Each row is one sale: the Date, the Agent Name chosen from a drop-down (so names are always spelled the same) and the Total Sales amount. Everything else is calculated.
3. Commission Rates Tab
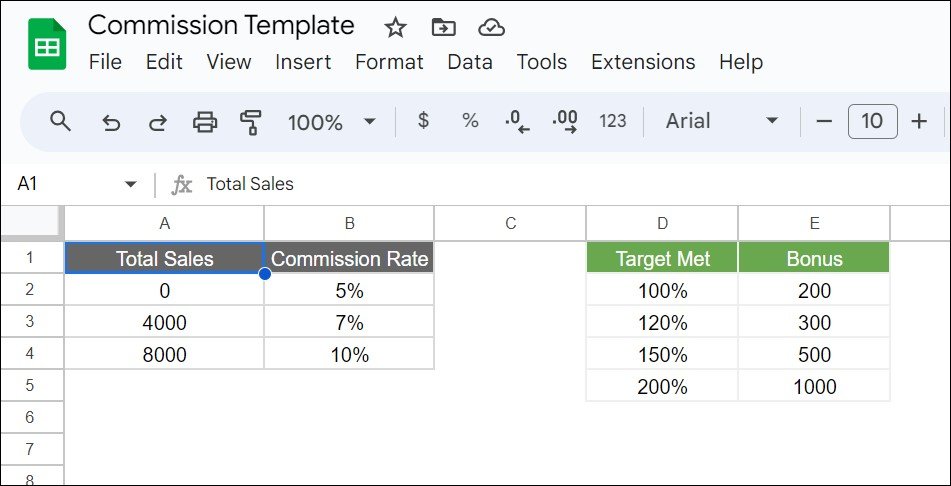
The left table maps Total Sales to a Commission Rate; the right table maps Target Met (sales as a percentage of the daily target) to a flat Bonus.
| Total Sales from | Commission Rate | Target Met from | Bonus | |
|---|---|---|---|---|
| 0 | 5% | 100% | 200 | |
| 4,000 | 7% | 120% | 300 | |
| 8,000 | 10% | 150% | 500 | |
| 200% | 1,000 |
Each value is a lower threshold. A sale of 7,000 sits in the 4,000 tier (7%); an agent at 135% of target sits in the 120% tier (300 bonus). Below 100% of target there is no bonus.
4. Sales Agents Tab
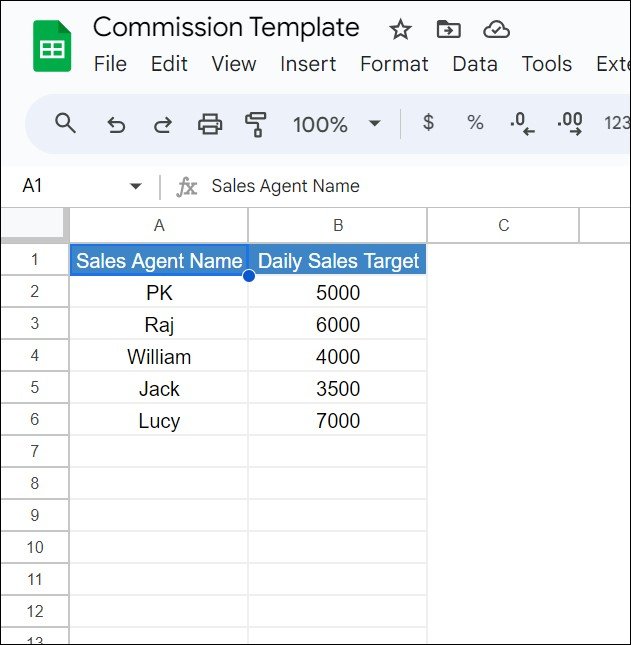
The sample team is PK (5,000), Raj (6,000), William (4,000), Jack (3,500) and Lucy (7,000). The Daily Sales Target is what each sale is compared against to decide Target Status and the bonus tier, so a newer agent can have a lower bar than a senior one.
Worked Example: Checking the Numbers by Hand
Here are four rows from the January 2024 Summary, recalculated step by step:
| Row | Sales | Rate | Commission | Target | Achieved | Bonus | Total Earning |
|---|---|---|---|---|---|---|---|
| 01-Jan-24, PK | 10,000 | 10% | 1,000 | 5,000 | 200% | 1,000 | 2,000 |
| 02-Jan-24, Raj | 7,000 | 7% | 490 | 6,000 | 116.7% | 200 | 690 |
| 07-Jan-24, William | 5,400 | 7% | 378 | 4,000 | 135% | 300 | 678 |
| 11-Jan-24, Raj | 3,800 | 5% | 190 | 6,000 | 63.3% | 0 (Not Met) | 190 |
Every figure matches the Summary screenshot, which is a good way to confirm you understand the plan before changing any tiers.
Formulas to Build the Same Logic
The template does the work for you, but if you want to understand or rebuild it, these lookups reproduce the results above. They follow the Summary layout in the screenshot: Agent Name in column C, Total Sales in D, Commission Rate in E, Commission Amt in F, Sales Target in G, Target Status in H, Bonus in I and Total Earning in J, with the first data row in row 7.
Commission Rate (approximate-match lookup on the sales tiers):
=VLOOKUP(D7,'Commission Rates'!$A$2:$B$4,2,TRUE)Commission Amt:
=D7*E7Sales Target (exact-match lookup on the agent):
=VLOOKUP(C7,'Sales Agents'!$A$2:$B,2,FALSE)Target Status:
=IF(D7>=G7,"Met","Not Met")Bonus (approximate-match lookup on achievement, zero when the target is missed):
=IF(D7>=G7,VLOOKUP(D7/G7,'Commission Rates'!$D$2:$E$5,2,TRUE),0)Total Earning:
=F7+I7The TRUE at the end of the tier lookups is what makes them work: VLOOKUP returns the row for the largest threshold that is less than or equal to the value, so the tier tables must stay sorted from smallest to largest. For a refresher on lookups, see how to use VLOOKUP in Google Sheets, and for the Met / Not Met check on its own, checking sales targets with the IF function.
How to Use It With Your Own Data
- Open Sales Agents and replace the sample names and daily targets with your team.
- Open Commission Rates and type your own sales tiers and rates, plus your target-achievement tiers and bonus amounts. Keep both tables sorted from lowest to highest.
- Clear the sample rows on Input Data and start logging each sale with its date, agent and amount.
- On Summary, set the Start Date and End Date to the pay period, for example one month.
- Read the three cards for the period totals and use the table to review each agent’s rows before you pay out.
Real-World Uses
- Retail or showroom staff paid a percentage of daily takings plus a reward for beating their daily target.
- Inside sales or telesales teams where each rep has a different target based on experience.
- Small distributors who want a transparent sheet that agents can view to check their own earnings.
Best Practices
- Share the sheet as view-only with agents and keep edit access for the person who logs sales.
- Protect the Commission Rates and Sales Agents tabs (Data > Protect sheets and ranges) so tiers cannot be changed by accident.
- Review a few rows by hand each pay period, as in the worked example above.
- When you change the plan, save a copy of the file first so earlier periods keep their original rates.
To look at one agent’s sales without changing the view for everyone else, use a filter view in Google Sheets. For a visual picture of how the team is tracking, see the sales target dashboard in Google Sheets.
Who This Template Is Not For
- Plans with commission on margin or profit rather than sales value. The template works from Total Sales only.
- Monthly or quarterly targets. Targets here are daily, and each sale is compared against that daily figure.
- Split commissions between two agents, clawbacks or accelerators that apply retroactively to all earlier sales.
- Large teams that need payroll integration. It is a spreadsheet, not payroll software.
If you want to go further with lookups, IF logic and other formulas through structured lessons, the Excel AI Mastery: 100 Formulas course on NextGenTemplates Academy covers them step by step, and the same ideas apply in Google Sheets.
Frequently Asked Questions
How is the commission rate decided?
By the size of each sale. In the sample plan, sales from 0 earn 5%, from 4,000 earn 7% and from 8,000 earn 10%. You can change the thresholds and rates on the Commission Rates tab.
How is the bonus calculated?
Sales are divided by the agent’s daily target. At 100% or more the agent earns 200, at 120% 300, at 150% 500 and at 200% 1,000. Below 100% the status is Not Met and the bonus is 0.
Can I see totals for just one week or month?
Yes. Change the Start Date and End Date on the Summary tab and the cards and table show only the sales inside that range.
Can each agent have a different target?
Yes. Targets are set per agent on the Sales Agents tab. In the sample they range from 3,500 (Jack) to 7,000 (Lucy).
How do I add a new sales agent?
Add the name and daily target on the Sales Agents tab. The agent then appears in the Agent Name drop-down on Input Data.
Can several people use the sheet at once?
Yes. It is a Google Sheet, so you can share it. Give edit access only to those who enter sales and view access to agents.
Wrapping Up
With four tabs and two small tier tables, this sales commission template with bonus amount in Google Sheets turns raw daily sales into a clear payout for every agent. Set your tiers and targets once, log sales as they happen, and pick a date range when it is time to pay.
Get the Sales Commission Template
📅 Last updated: October 2026