A Project Management Issue Tracker in Google Sheets gives your team one shared list of every project issue: what went wrong, how urgent it is, who owns it and when it should be fixed. This guide walks through a ready-to-use tracker with three tabs: a Summary page with charts and alert tables, the Project Issue Tracker input table, and an Assigned To list.
It is built for project managers, team leads, QA and IT teams, and anyone running a project in Google Sheets who needs more structure than a plain to-do list. You will see every field, how the summary visuals read the data, the kind of formulas (COUNTIF and FILTER) that power views like these, and how to set it up for your own project.
🎥 Watch the Video Tutorial
Get the Project Management Issue Tracker
What the Project Management Issue Tracker in Google Sheets Includes
| Tab | Purpose | What you see |
|---|---|---|
| Summary | Read-only overview | Issue by Status, Issues by Priority, Resolved% gauge, Overdue Issue table, Critical Open Issue table, Issues by Assigned To |
| Project Issue Tracker | Where you log and update issues | Input table with 9 fields and 3 slicers (Priority, Status, Assigned To) |
| Assigned To | Drop-down source list | Names of team members who resolve issues |
Tab 1: Summary
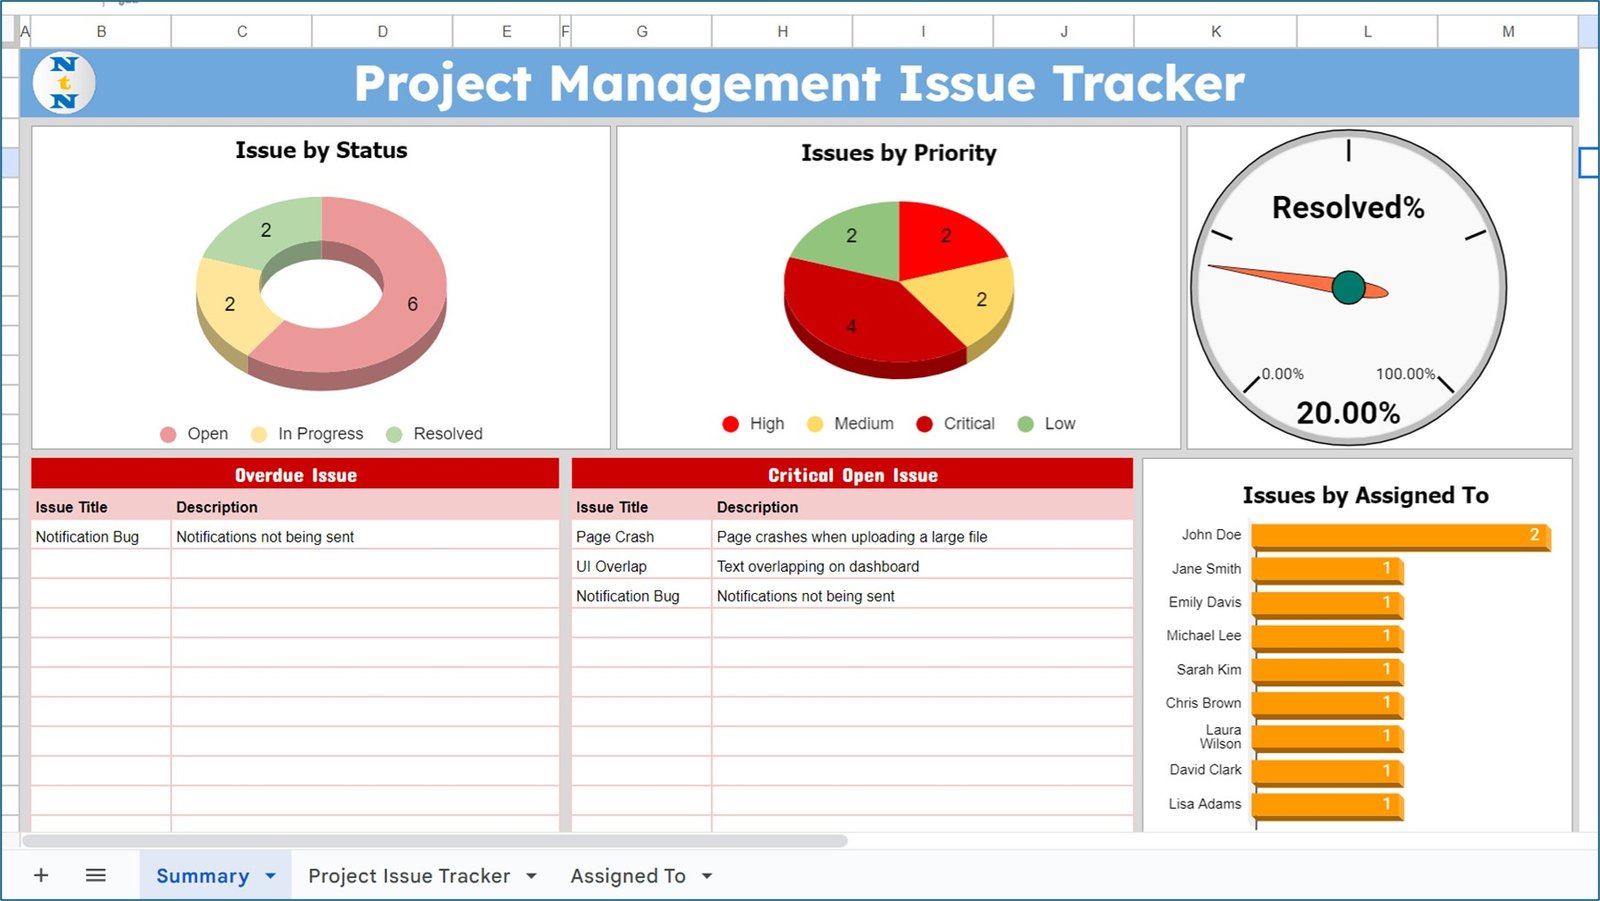
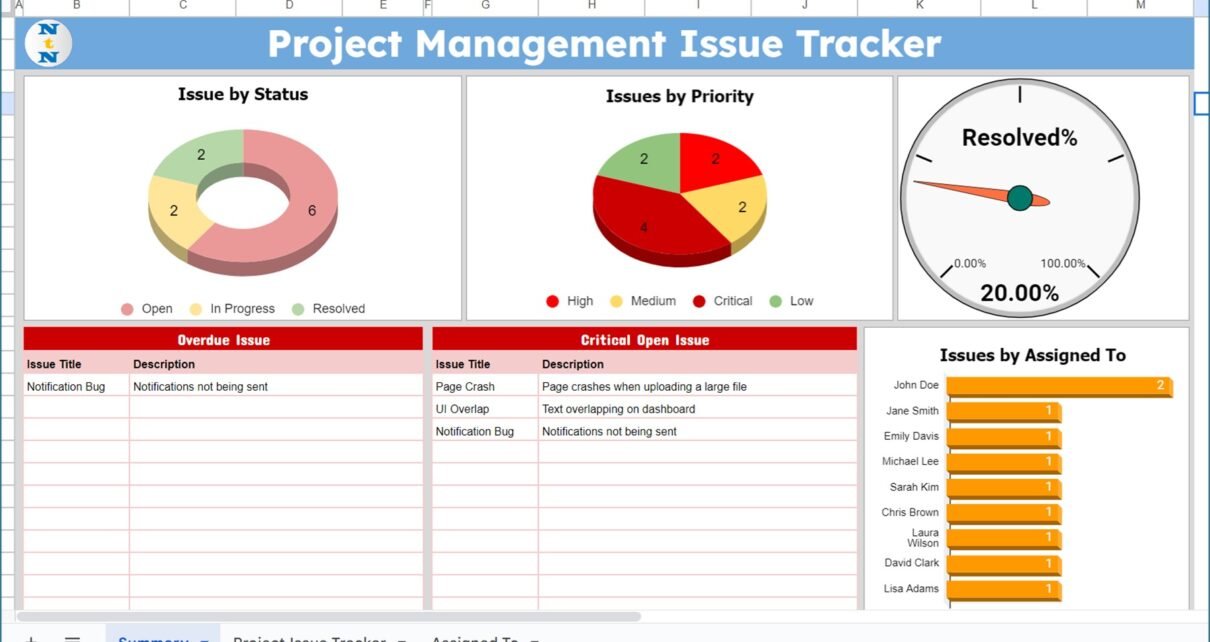
- Issue by Status – a doughnut chart counting issues that are Open, In Progress or Resolved. The screenshot shows Open 6, In Progress 2 and Resolved 2.
- Issues by Priority – a pie chart of High, Medium, Critical and Low issues. In the sample: Critical 4, and High, Medium and Low 2 each.
- Resolved% – a gauge showing the share of issues that are resolved. With 2 of 10 issues resolved, it reads 20.00%.
- Overdue Issue – a table listing the Issue Title and Description of issues that are still open or in progress after their Target Resolution Date. The sample shows “Notification Bug – Notifications not being sent”.
- Critical Open Issue – a table of issues with Critical priority that are open or in progress: Page Crash, UI Overlap and Notification Bug in the sample.
- Issues by Assigned To – a bar chart of issue count per person. John Doe has 2; Jane Smith, Emily Davis, Michael Lee, Sarah Kim, Chris Brown, Laura Wilson, David Clark and Lisa Adams have 1 each.
Tab 2: Project Issue Tracker
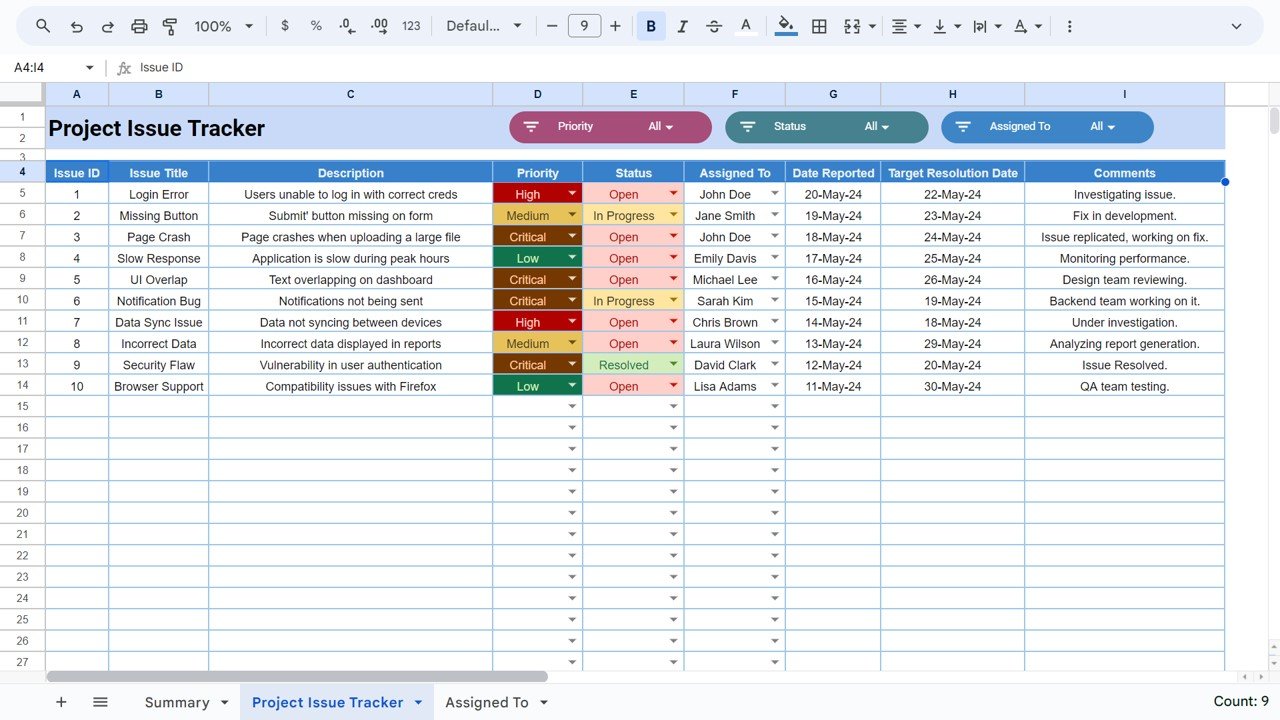
This is the only tab you edit day to day. Add a new issue on the next empty row, and update Status and Comments as work moves forward.
| Field | How it is filled | Sample |
|---|---|---|
| Issue ID | Auto-generated serial number | 1 |
| Issue Title | Type a short name | Login Error |
| Description | Type the details | Users unable to log in with correct creds |
| Priority | Drop-down: Low, Medium, High, Critical | High |
| Status | Drop-down: Open, In Progress, Resolved | Open |
| Assigned To | Drop-down from the Assigned To tab | John Doe |
| Date Reported | Double-click to pick a date | 20-May-24 |
| Target Resolution Date | Double-click to pick a date | 22-May-24 |
| Comments | Free text | Investigating issue. |
Priority and Status cells are colour-coded, so Critical items and open issues stand out as you scroll. The three slicers at the top filter the table: for example, choose Status = Open and Assigned To = John Doe to see only John’s open items.
Tab 3: Assigned To
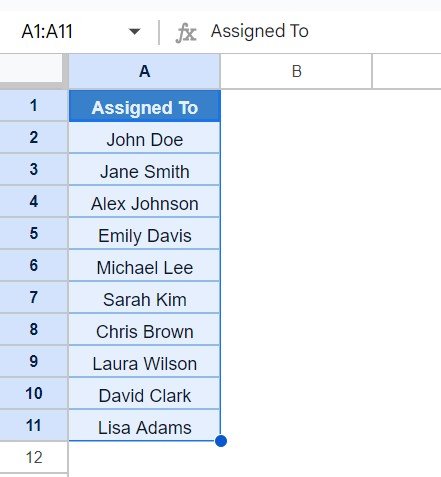
This tab holds the names that appear in the Assigned To drop-down. The sample lists ten people, from John Doe to Lisa Adams. Add or remove names here and the drop-down follows.
How the Summary Numbers Are Calculated
The template does the work for you, but knowing the logic helps you trust and extend it. With Status in column E, Priority in D and the Target Resolution Date in H (data from row 5), formulas like these give the same kind of results:
Resolved%
=COUNTIF(E5:E, "Resolved") / COUNTA(A5:A)

Overdue issues (still not resolved, target date passed)
=FILTER(B5:C, E5:E<>"Resolved", H5:H<>"", H5:H<TODAY())

Critical open issues
=FILTER(B5:C, D5:D="Critical", E5:E<>"Resolved")
Worked example: the Summary screenshot counts 10 issues, 2 of them Resolved, so Resolved% = 2 ÷ 10 = 20%, the value on the gauge. (The tracker screenshot was taken at a different moment and shows only issue 9 as Resolved; with that data the gauge would read 1 ÷ 10 = 10%.) The priority split in the tracker (issues 3, 5, 6 and 9 are Critical; 1 and 7 High; 2 and 8 Medium; 4 and 10 Low) gives the 4-2-2-2 pie on the Summary.
Because overdue status depends on today’s date, the Overdue Issue table changes on its own as days pass, even if nobody edits the sheet. Our guide on tracking project deadlines with NETWORKDAYS shows how to count working days left, and the gauge chart guide explains how a Resolved% dial is built.
How to Use It for Your Own Project
- Make a copy of the file in your Google Drive.
- Open Assigned To and replace the sample names with your team.
- On Project Issue Tracker, clear the sample rows (keep the headers).
- Log each issue: title, description, priority, status, owner, date reported and target date.
- Update Status and Comments as work progresses; set Status to Resolved when it is fixed.
- Open Summary in your weekly review to check Resolved%, overdue items and critical open issues.
- Share the file so each owner can update their own rows.
Real-World Use Cases
- Software release: a QA lead logs bugs such as “Login Error” or “Page Crash” and reviews the Critical Open Issue table before go-live.
- IT support project: an IT manager tracks rollout issues by owner and uses the Assigned To chart to balance workload.
- Client project: an agency shares the Summary tab in status meetings so the client sees progress without reading every row.
Best Practices
- Write titles a stranger would understand, for example “Export fails on large files” rather than “Bug 2”.
- Always set a Target Resolution Date, otherwise the issue can never show as overdue.
- Keep Critical for issues that block work or users. If everything is Critical, nothing is.
- Add a date and initials to Comments (“21-May PK: fix deployed to test”) so the history is clear.
- Review the Overdue Issue table at least once a week.
Who Should Not Use It
This tracker is designed for one project with a manageable number of issues. It does not send email notifications, track time spent, or link issues to code commits. Large software teams with hundreds of open tickets will be better served by a dedicated issue-tracking tool. For broader project planning, pair it with a project plan or Gantt chart in Google Sheets or a project status tracker.
Related templates: the Project Issue Tracker in Google Sheets (a different layout, explained in our Project Issue Tracker guide) and the Project Management KPI Dashboard in Google Sheets.
If you want to go further with structured lessons on building summary charts and reports, the Excel Pivot Tables and Dashboards course on NextGenTemplates Academy covers the same reporting ideas step by step.
Frequently Asked Questions
What is a project management issue tracker?
It is a log of problems that come up during a project, with each issue’s priority, status, owner and target date, so nothing is forgotten and the team can see what needs attention.
Which status values does this tracker use?
Open, In Progress and Resolved. Priority values are Low, Medium, High and Critical.
How is an issue marked overdue?
An issue appears in the Overdue Issue table when it is still Open or In Progress and its Target Resolution Date has passed.
How do I add or change team members?
Edit the names on the Assigned To tab. The Assigned To drop-down in the tracker uses that list.
Can I filter issues by person or priority?
Yes. The tracker tab has slicers for Priority, Status and Assigned To at the top of the table.
Can several team members update it at the same time?
Yes. It is a Google Sheets file, so you can share it and everyone sees changes as they happen.
Wrapping Up
A Project Management Issue Tracker in Google Sheets works when it stays simple: one table to log issues, a short list of owners, and a Summary page that points at what is overdue or critical. Watch the video above, set up your team list and log your first issue today.
Get the Project Management Issue Tracker
📅 Last updated: October 2026