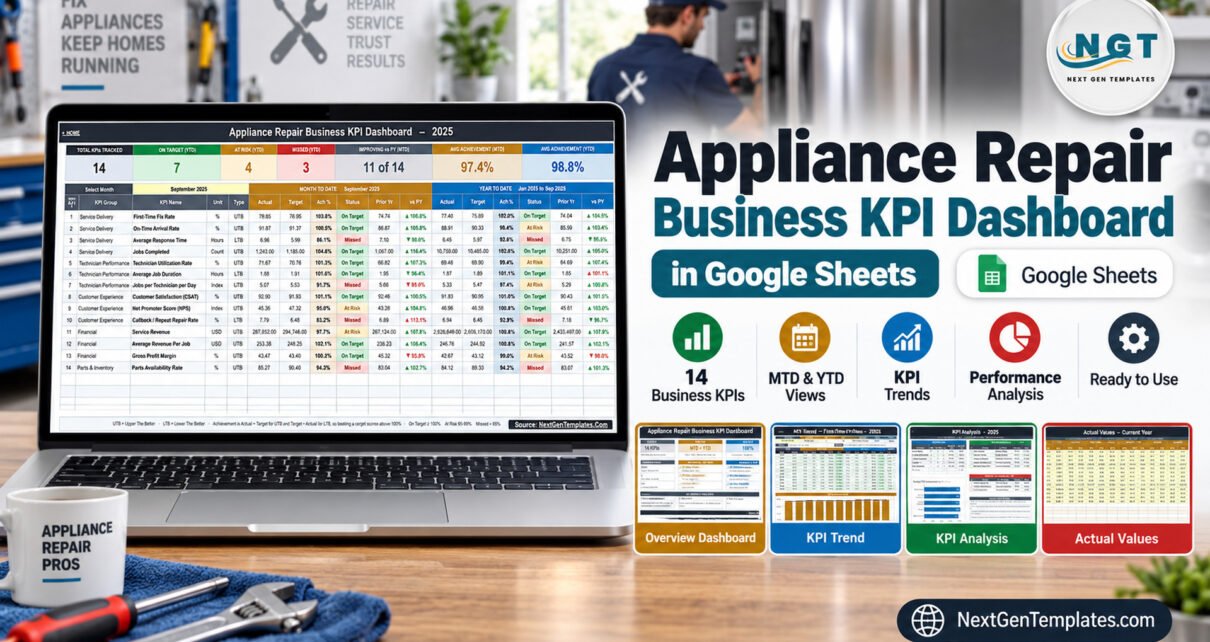
A 14-KPI Google Sheets scorecard for appliance repair businesses with a month picker, MTD and YTD traffic lights, prior-year comparison, KPI Trend charts and KPI Analysis.
Online Tutorial for Data Analysis and Automation
A 14-KPI Google Sheets scorecard for appliance repair businesses with a month picker, MTD and YTD traffic lights, prior-year comparison, KPI Trend charts and KPI Analysis.
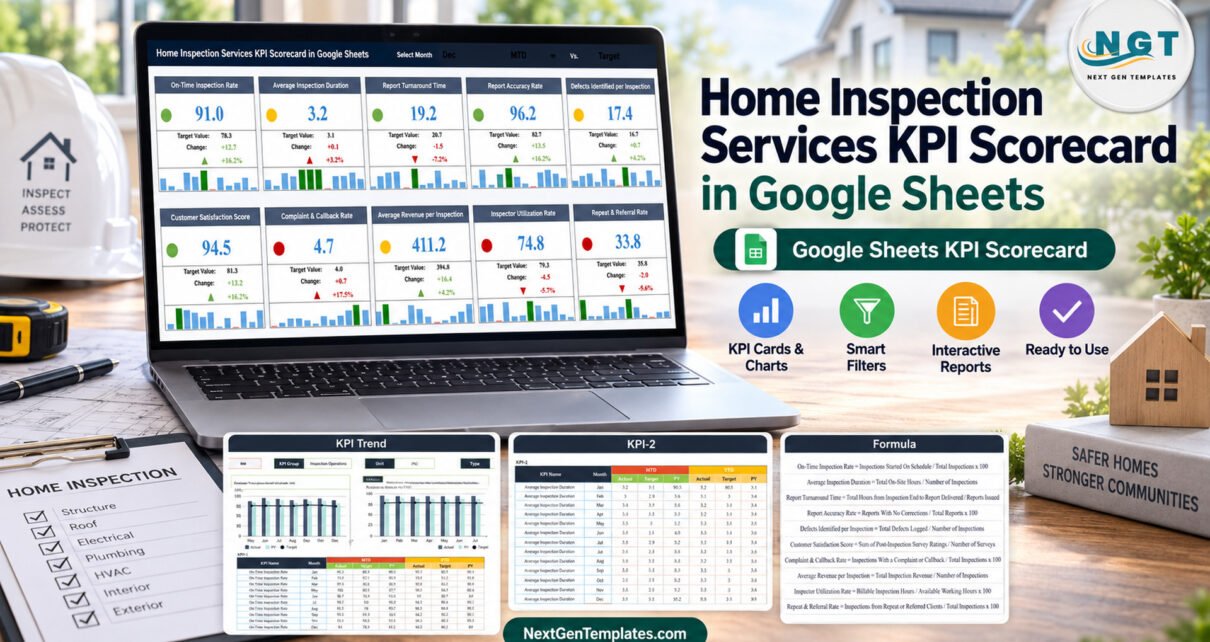
A 10-KPI Google Sheets scorecard for home inspection businesses with month, MTD/YTD and Target/PY selectors, traffic lights, mini charts and a KPI Trend page.
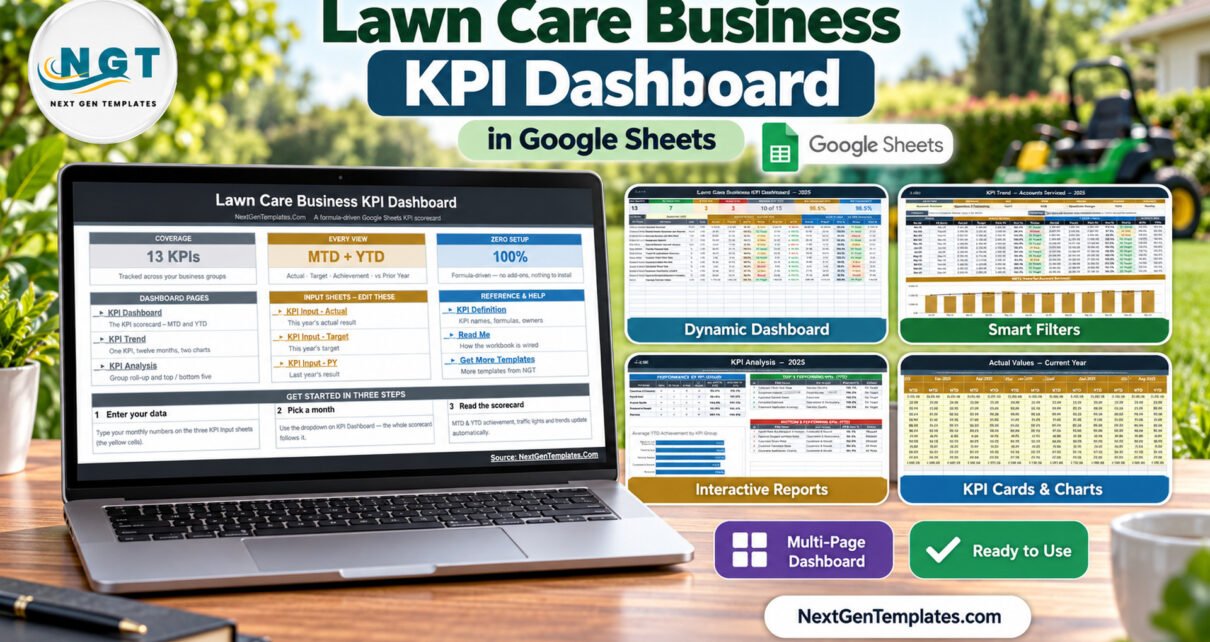
A 13-KPI Google Sheets scorecard for lawn care businesses with a month picker, MTD and YTD traffic lights, prior-year comparison, KPI Trend charts and KPI Analysis.
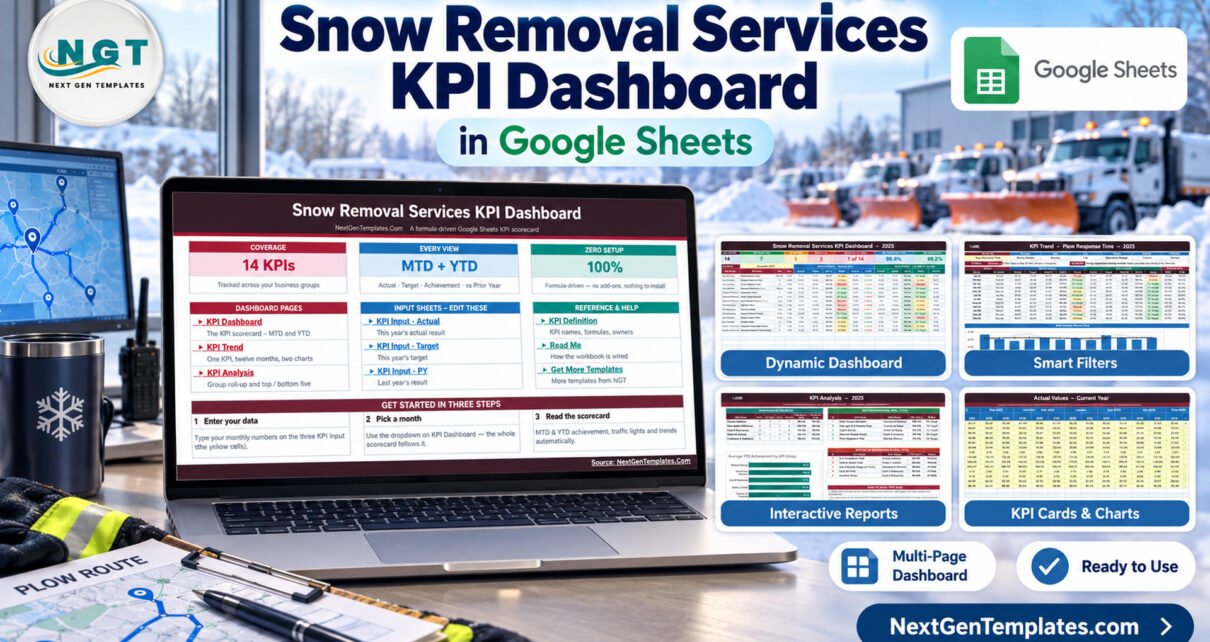
A month-picker KPI dashboard for snow plowing and ice management companies in Google Sheets: 14 KPIs in 5 groups, MTD and YTD traffic lights, a KPI Trend page and a KPI Analysis page.
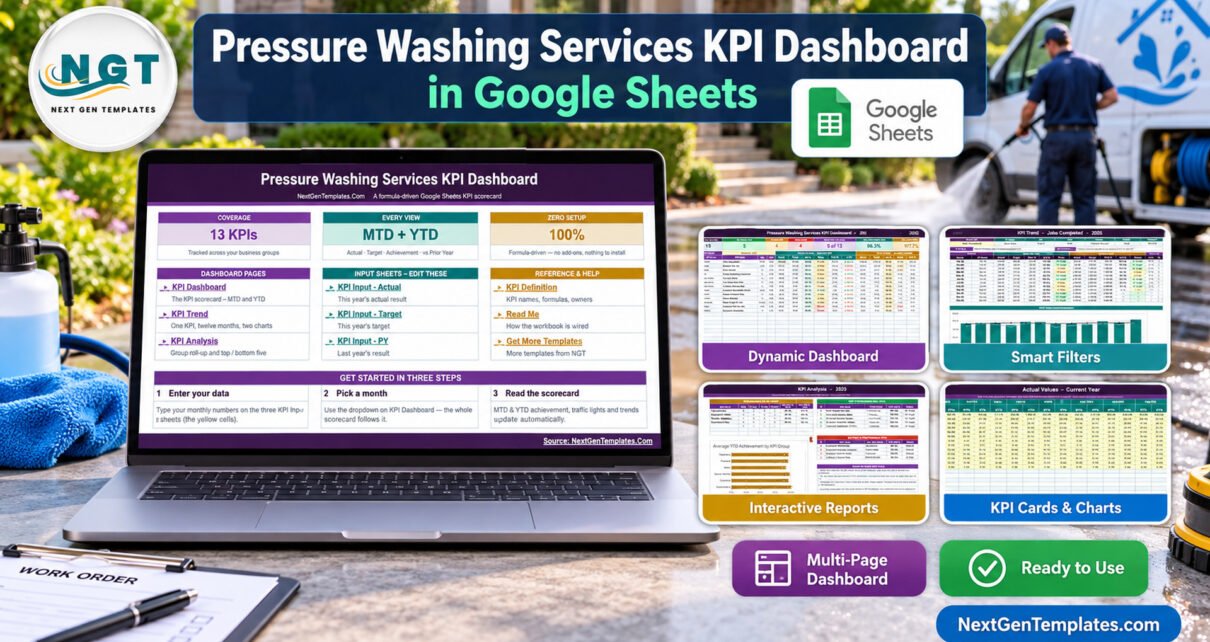
A month-picker KPI dashboard for pressure washing companies in Google Sheets: 13 KPIs in 6 groups, MTD and YTD traffic lights, a KPI Trend page and a KPI Analysis page.
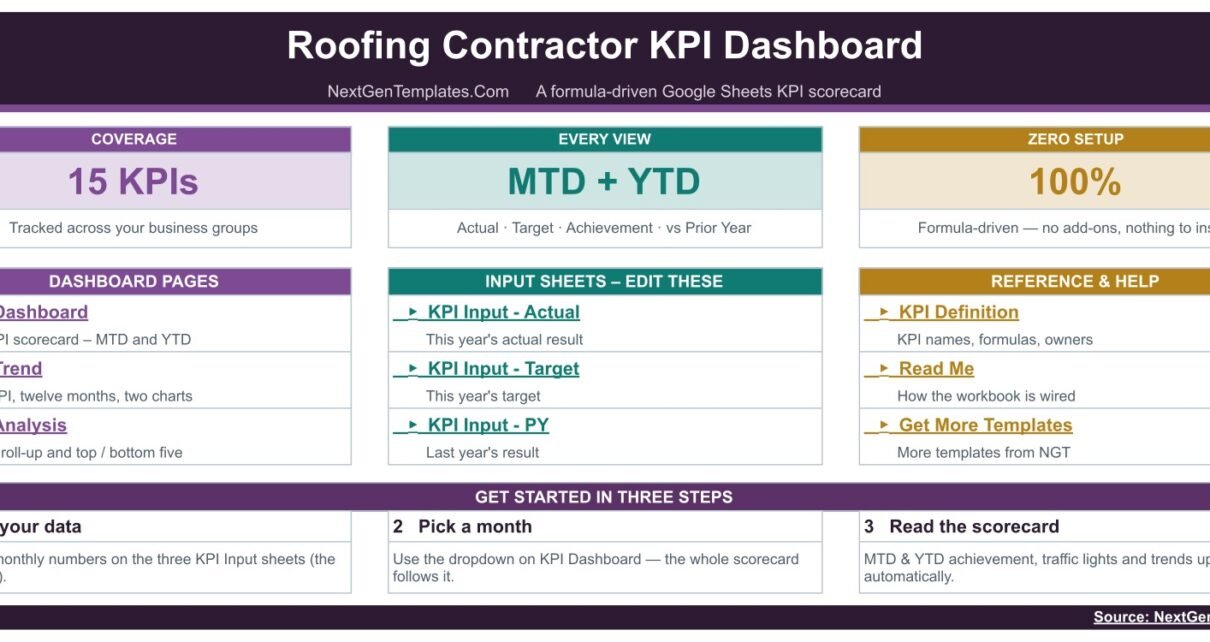
Track 15 roofing contractor KPIs in Google Sheets with MTD and YTD achievement, prior-year comparison and traffic-light status. One month dropdown drives the scorecard, the KPI Trend page and the group analysis – formula-driven, nothing to install.
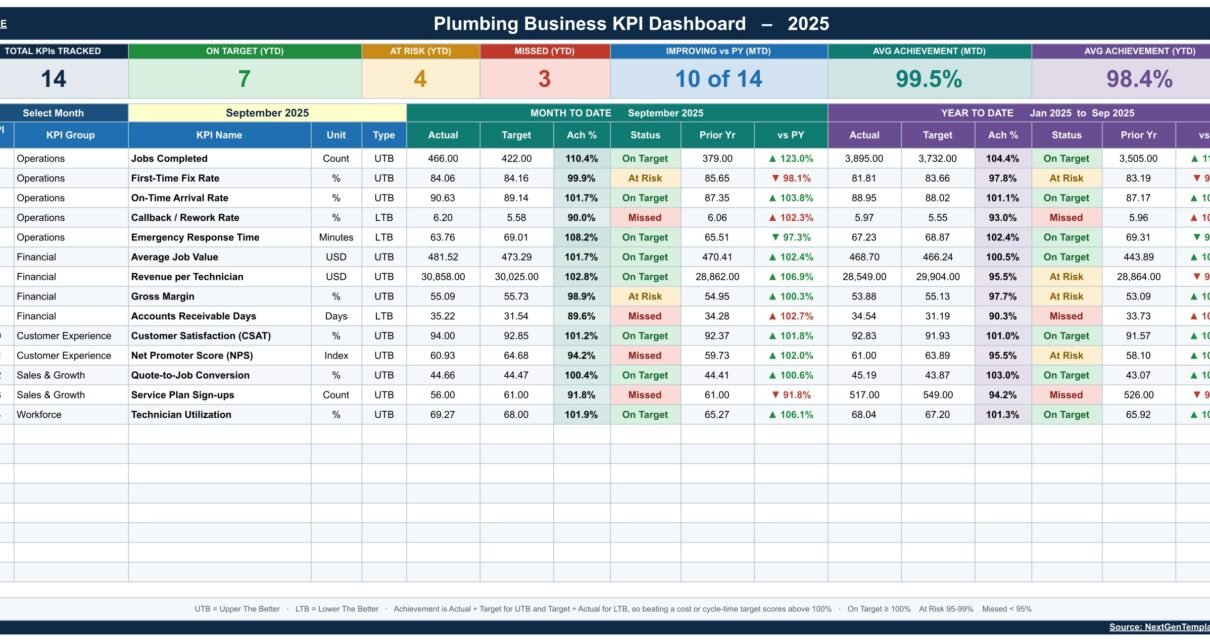
Track 14 plumbing KPIs across 5 groups in Google Sheets. One month picker drives MTD and YTD achievement, traffic lights, a per-KPI trend page and a group analysis page. No add-ons, no scripts.
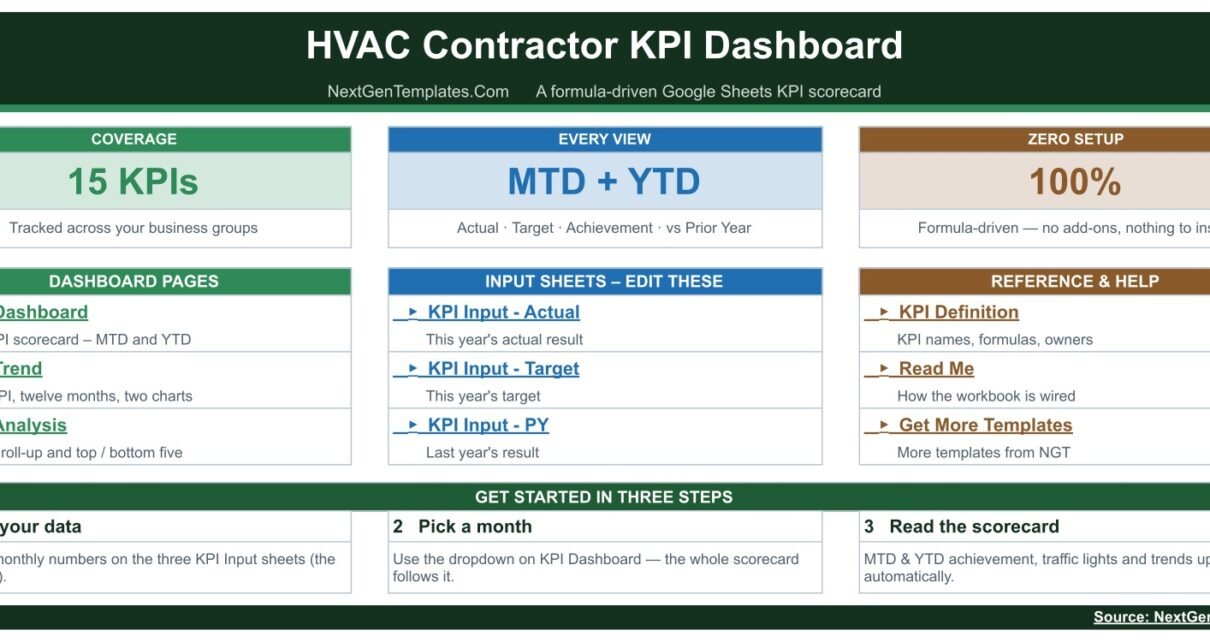
Track 15 HVAC contractor KPIs in Google Sheets with MTD and YTD achievement, prior-year comparison and traffic-light status. One month dropdown drives the scorecard, the KPI Trend page and the group analysis – formula-driven, nothing to install.
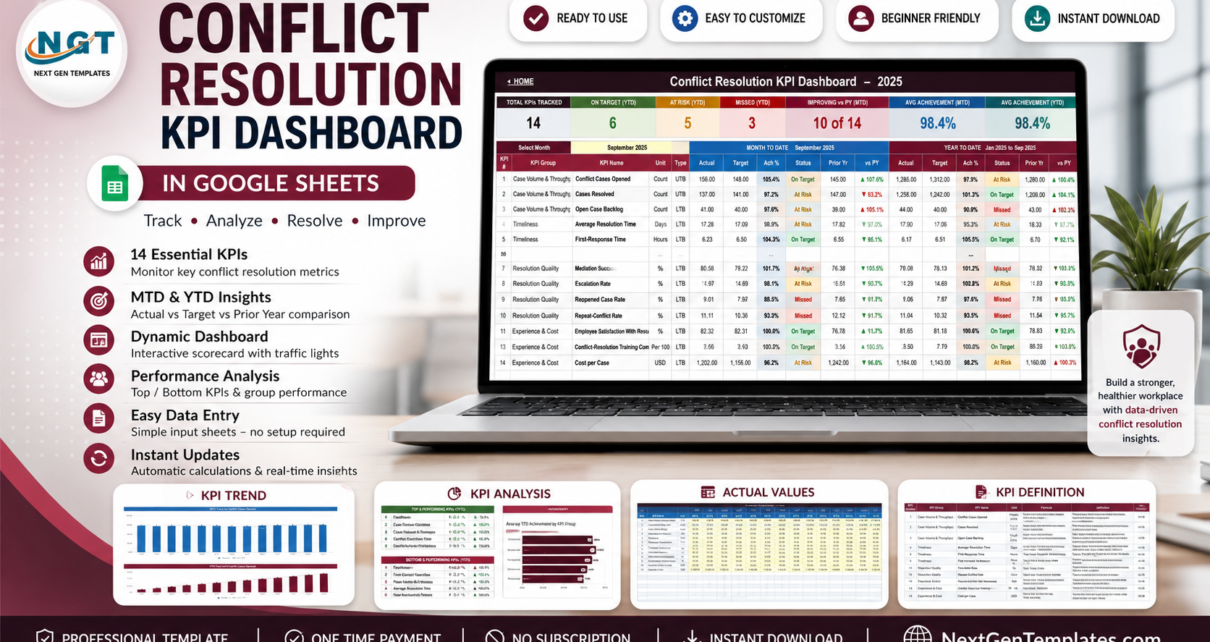
A formula-driven Google Sheets KPI scorecard that tracks 14 conflict resolution and employee-relations KPIs across four groups, with MTD and YTD achievement, traffic lights, a trend page and an analysis page. You type the monthly numbers; the sheet does the rest.
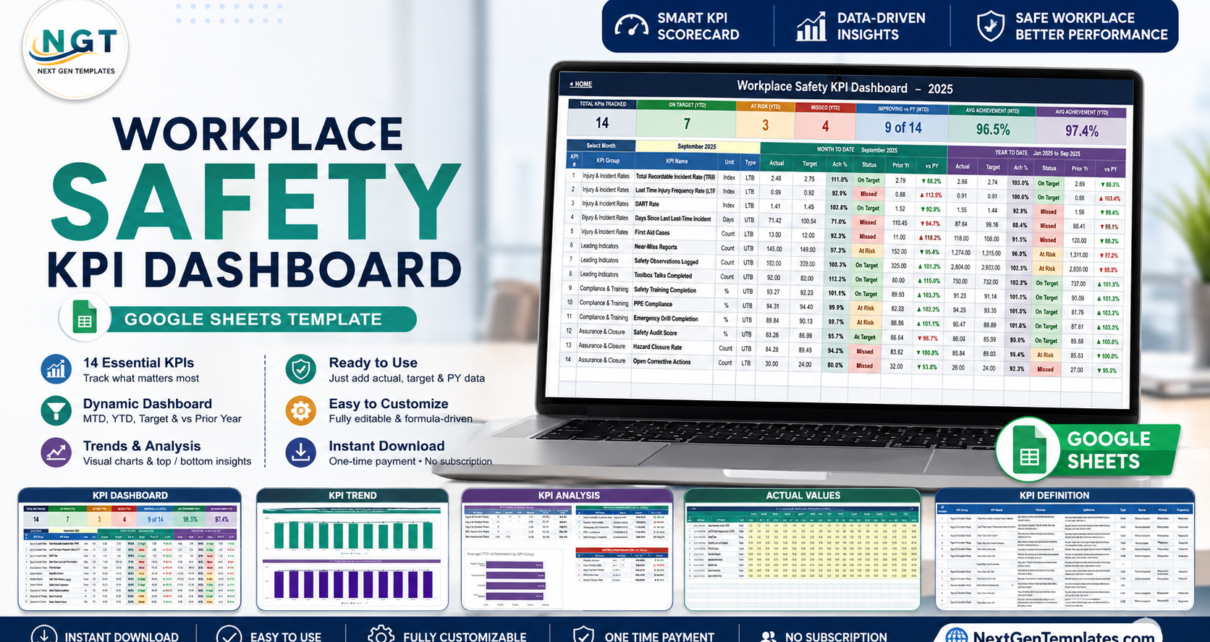
A formula-driven Google Sheets KPI scorecard that tracks 14 workplace safety KPIs – TRIR, LTIFR, DART Rate, near-misses, PPE compliance and more – with a month picker, MTD and YTD traffic lights, a 12-month trend page and a group analysis page. No add-ons, no scripts.