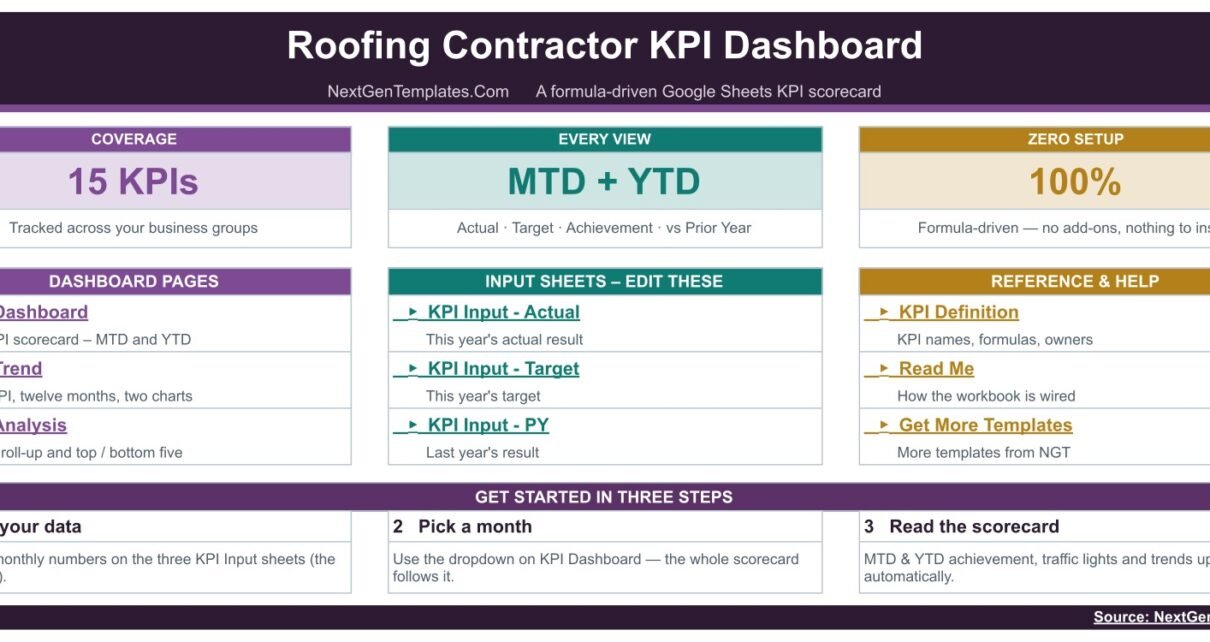
Most roofing companies measure two things well – revenue and how busy the crews look – and everything else once a year, in a meeting nobody enjoys. The Roofing Contractor KPI Dashboard in Google Sheets replaces that with a single scored page: 15 roofing KPIs across 5 groups, each one measured twice – month to date and year to date – against target and against last year, with a traffic light on every row. It runs on 9 tabs, wants nothing but your monthly numbers, and re-reads the whole workbook from one month dropdown. No add-on, no Apps Script, no query to refresh.
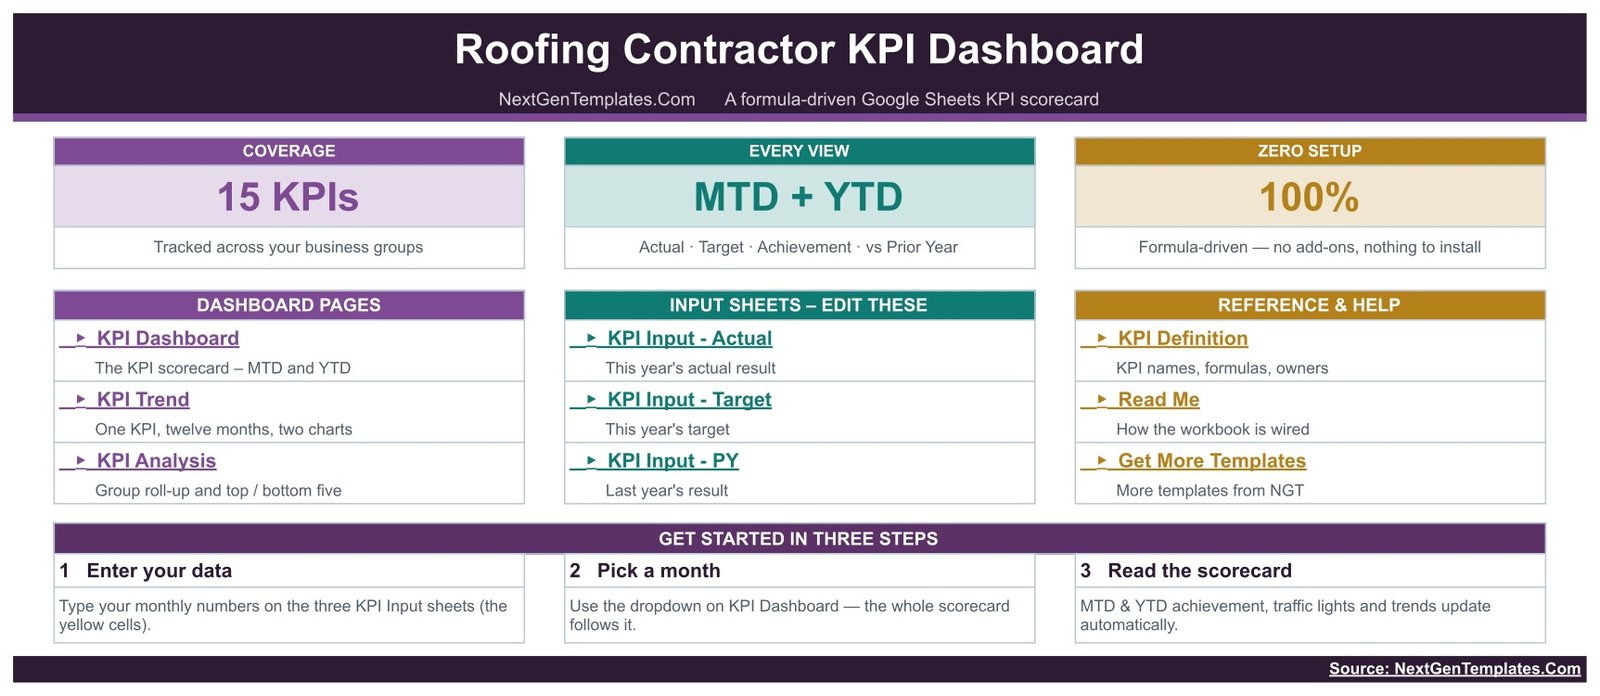
Home sheet – 15 KPIs, MTD and YTD, and a three-step start
Get the Roofing Contractor KPI Dashboard in Google Sheets
Key Features of the Roofing Contractor KPI Dashboard in Google Sheets
- 15 roofing KPIs written for the trade – Estimates Issued, Estimate-to-Close Rate, Average Job Value, Jobs Completed, Roof Squares Installed, Crew Productivity (Squares per Crew Day), Days from Sold to Install, Leak Callbacks per 100 Jobs, Punch-List Closure Rate, Material Waste, Gross Margin, Tear-Off Disposal Cost per Square, Days Sales Outstanding, Safety Incident Rate (TRIR) and Customer Satisfaction Score.
- Five KPI groups – Sales & Estimating (3 KPIs), Production (4), Quality & Warranty (3), Financial (3) and Safety & Service (2).
- MTD and YTD on one row – Actual, Target, Achievement %, Status, Prior Yr and vs PY, twice, for every KPI.
- Direction-aware scoring – each KPI is typed UTB (upper the better) or LTB (lower the better). Achievement is Actual / Target for UTB and Target / Actual for LTB, so cutting disposal cost or callback rate scores above 100%.
- Editable traffic lights – On Target from 100%, At Risk 95% to 99%, Missed below 95%. The thresholds are ordinary formulas you can move.
- Seven summary cards at the top of the scorecard: KPIs tracked, On Target / At Risk / Missed counts, how many improved on last year, and average achievement for MTD and YTD.
- Capacity for 22 KPIs and 9 groups – 15 rows are filled, the rest are live and empty, so a new KPI needs no formula work.
- Owner, priority and frequency per KPI – Sales Manager, Production Manager, Field Superintendent, Scheduling Coordinator, Quality Manager, Purchasing Lead, Owner / Controller, Safety Officer and Customer Care Lead are already assigned.
Dashboard Pages Explanation
Nine tabs. You type into three of them and read the rest.
KPI Dashboard – the scorecard
This is the page you open every month. A dropdown at the top left picks the month; everything below follows. Fifteen rows carry the KPI number, group, name, unit and type, then a Month to Date block and a Year to Date block with the same six columns each. In the sample year, September 2025 reads 7 On Target, 5 At Risk and 3 Missed on YTD, with 9 of 15 KPIs improving on last year, 97.1% average MTD achievement and 97.9% average YTD achievement. A footer restates the rules: UTB, LTB, and the three status bands.
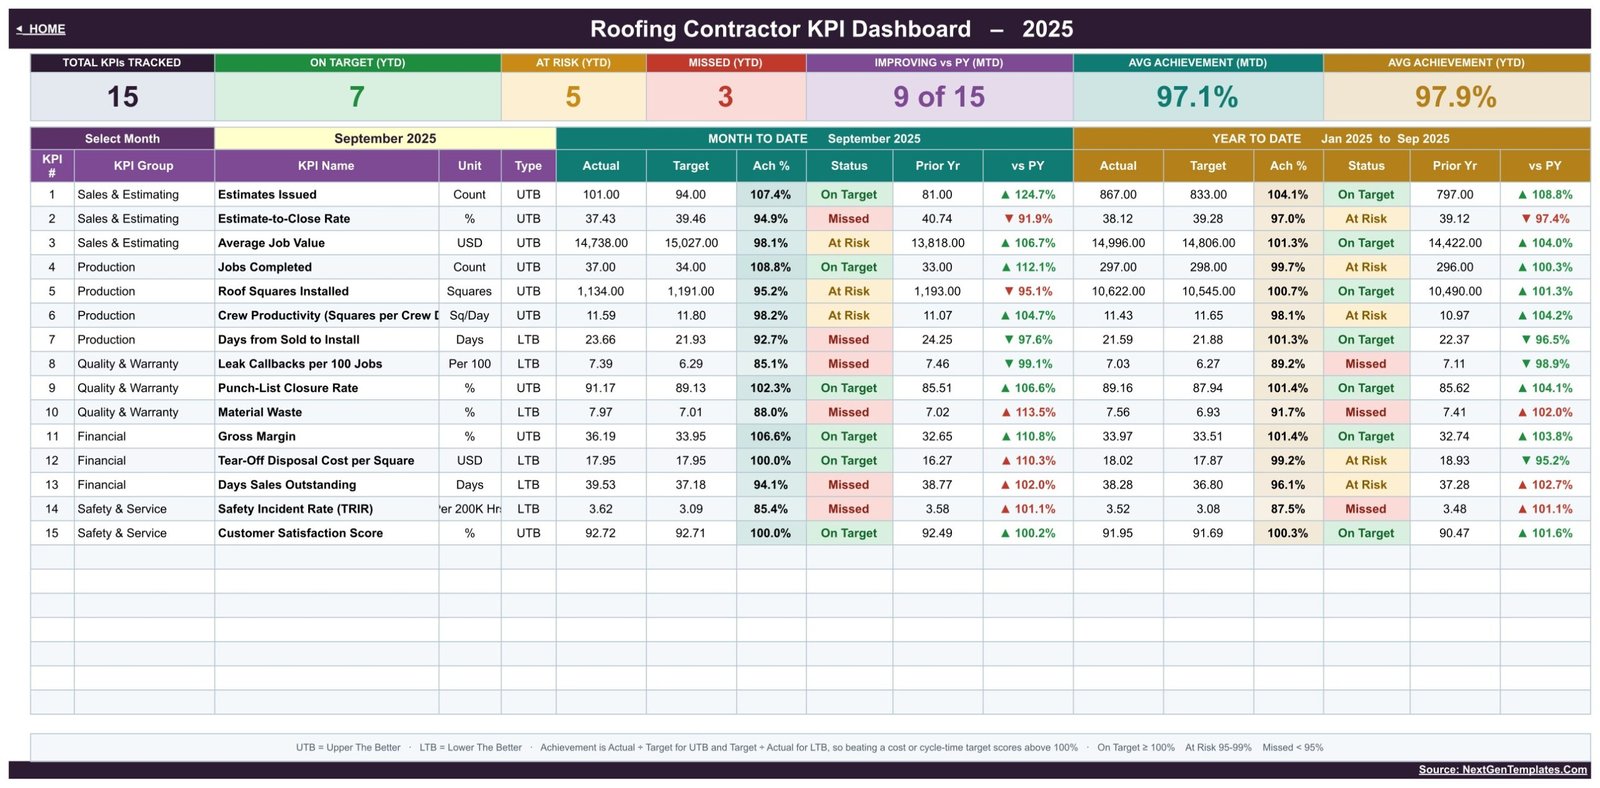
KPI Dashboard sheet – one month, 15 scored KPIs, MTD and YTD side by side
KPI Trend – one KPI over twelve months
Choose a KPI from the dropdown and the whole page rebuilds around it: group, unit, type, owner, priority, frequency, its formula and its plain-English definition, then a twelve-month table of MTD and YTD actual, target, prior year, achievement and status. Two combo charts follow – an MTD Trend chart and a YTD Trend chart, each plotting actual columns against a target line and a prior-year series. It answers the only question a single red month raises: is this a blip or a slide?
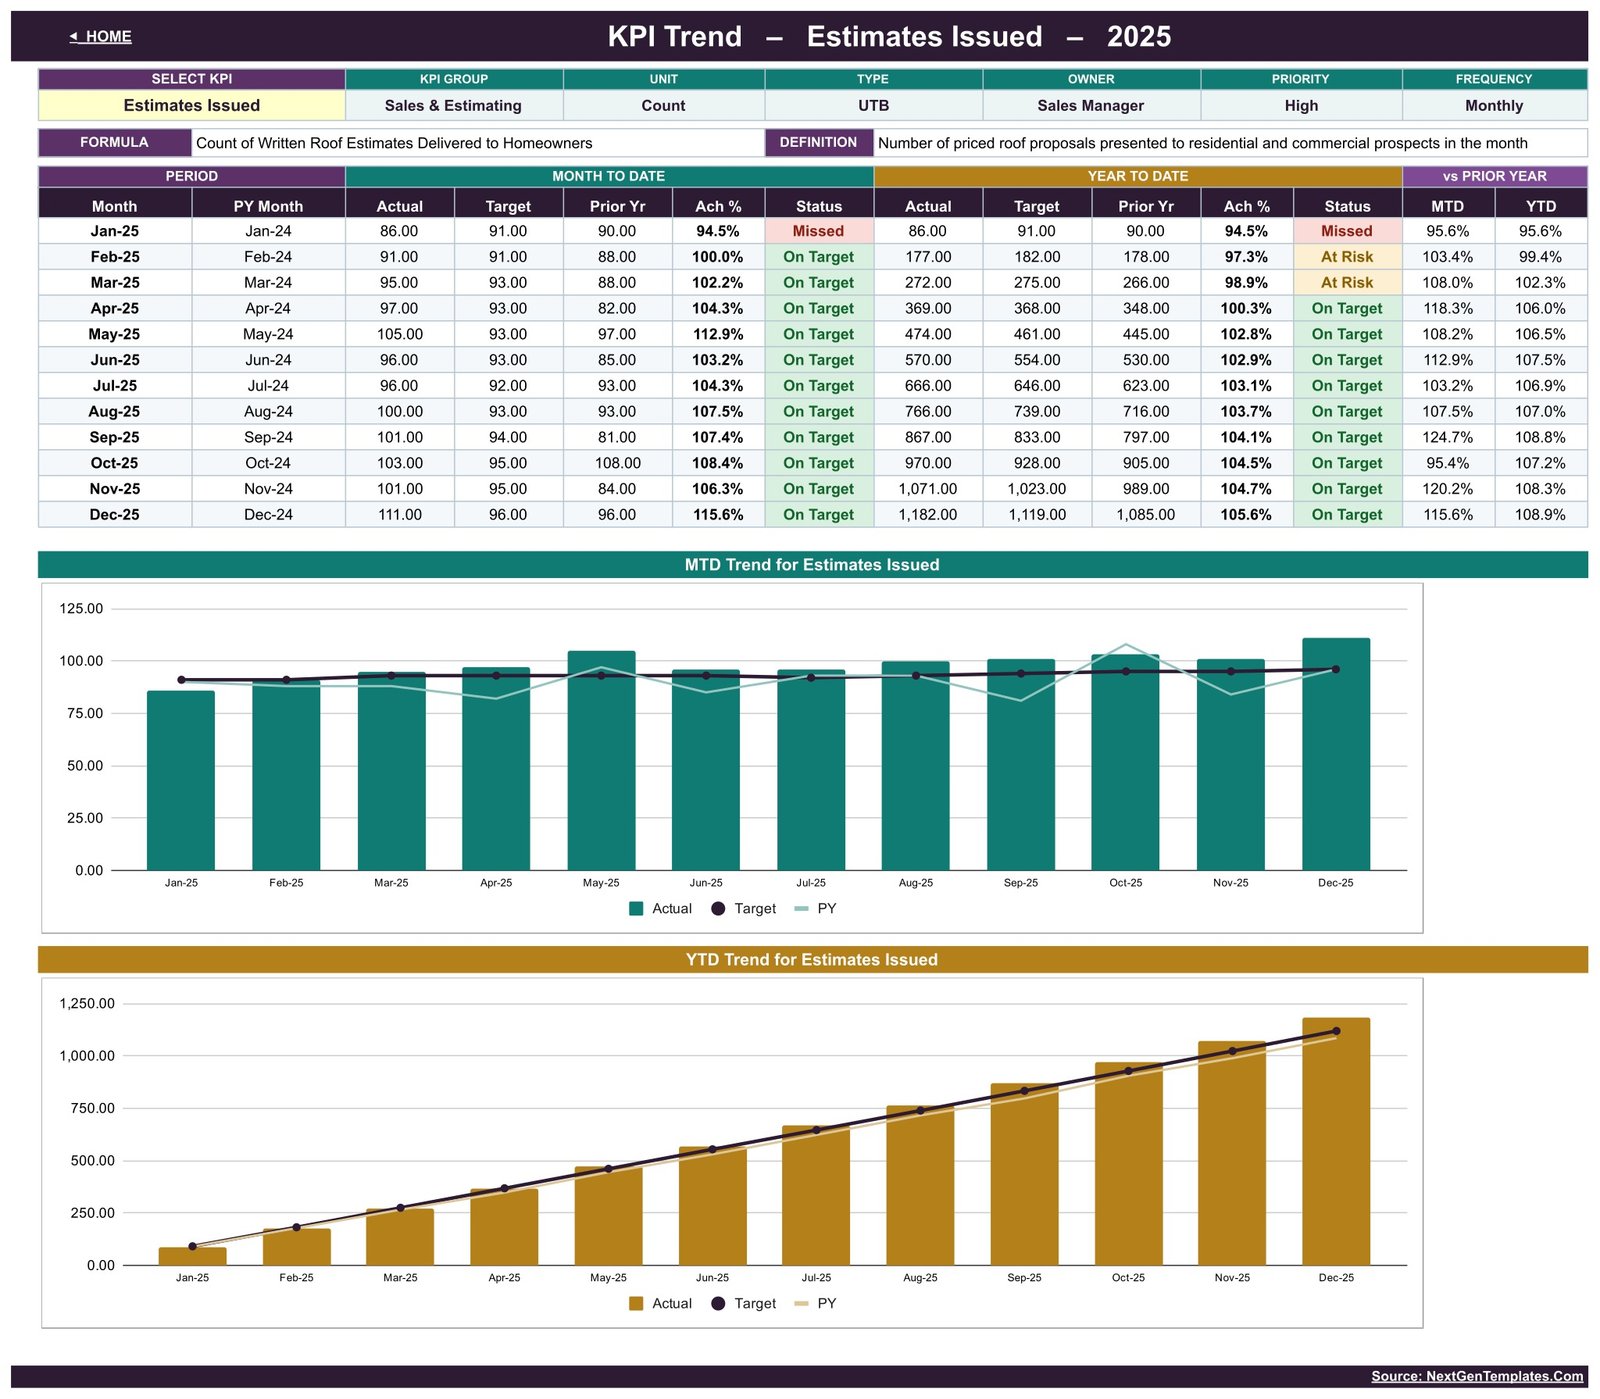
KPI Trend sheet – twelve months and two charts for the selected KPI
KPI Analysis – groups, leaders and laggards
Performance by KPI Group counts On Target, At Risk and Missed within each group and averages MTD and YTD achievement, with an Average YTD Achievement by KPI Group bar chart underneath. To the right, Top 5 and Bottom 5 Performing KPIs rank the year to date. In the sample, Estimates Issued tops the list at 104.1% and Safety Incident Rate (TRIR) sits at the bottom at 87.5% – which is exactly the pairing that should shape a production meeting. A How To Read This Page panel explains that lower-is-better KPIs beating target rank near the top, so nobody misreads the order.
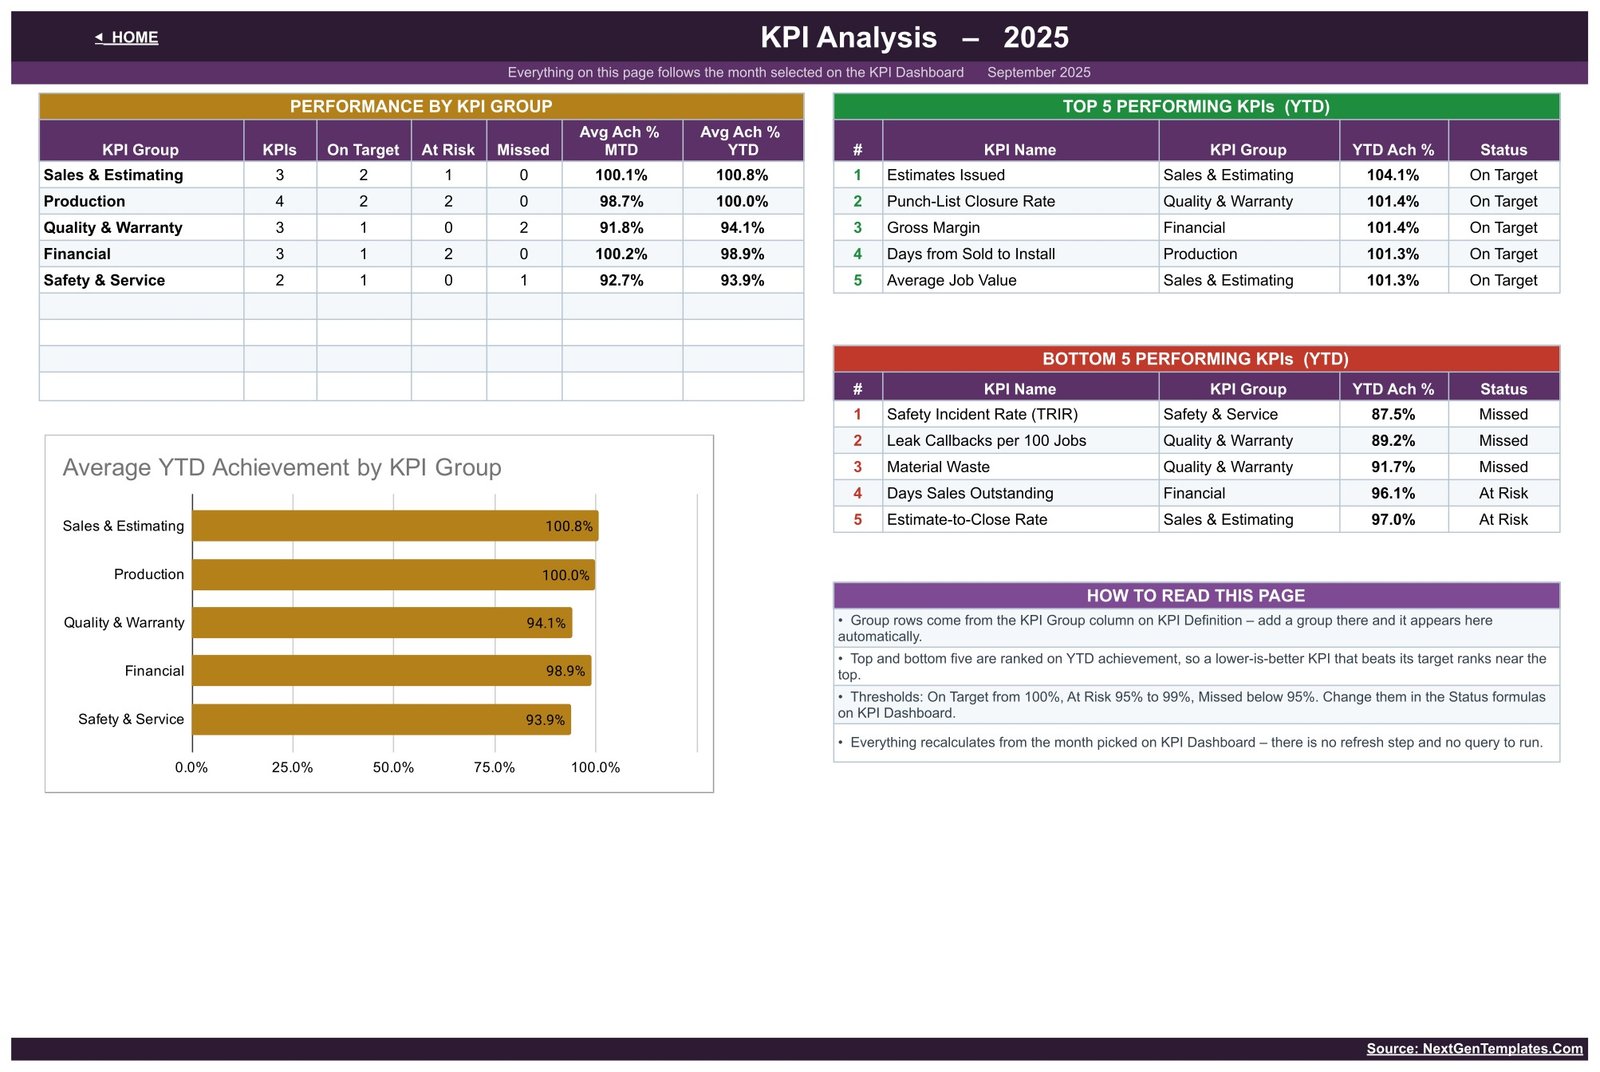
KPI Analysis sheet – group roll-up plus top and bottom five
KPI Input – Actual, Target and PY
Three identical yellow grids hold your data: this year’s actual, this year’s target and last year’s result. Each KPI gets an MTD and a YTD column for every month, so your year-to-date definition stays yours rather than being assumed. Cell E3 on KPI Input – Actual is the first month of the reporting year; change it and the target sheet, the prior-year sheet, the month dropdown and every sheet title re-base automatically.
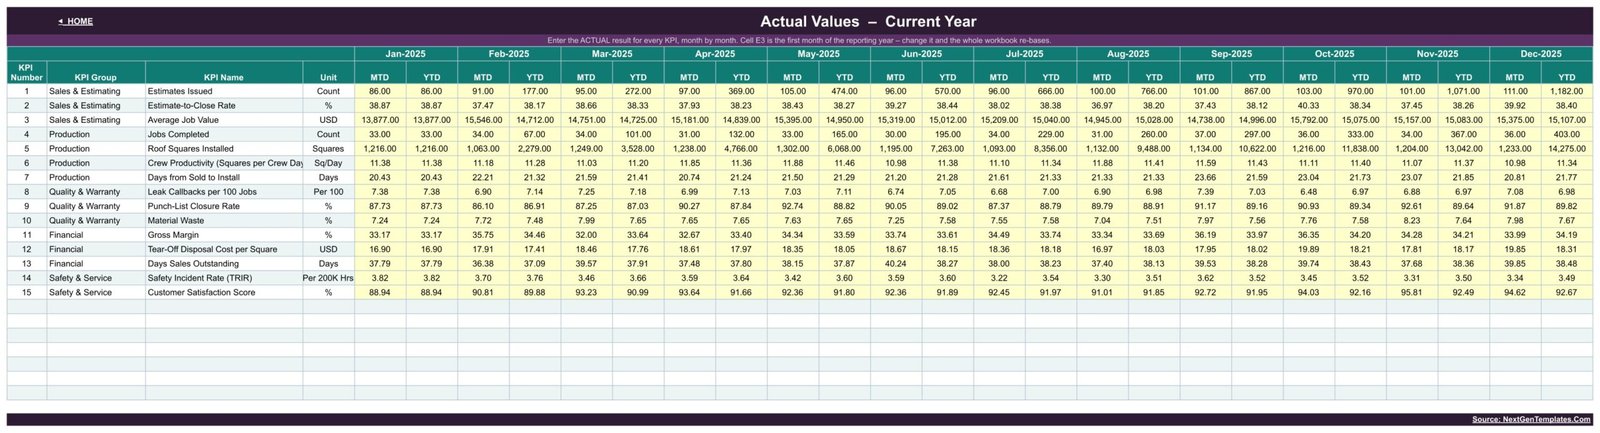
KPI Input – Actual sheet – the only cells you type in
KPI Definition, Read Me and the rest
KPI Definition is the master list – number, group, name, unit, formula, definition, type, owner, priority, frequency. Every other sheet reads it, so renaming a KPI here renames it everywhere and clearing a row removes it everywhere. Read Me explains the wiring in plain English, including why volumes accumulate through the year while rates and per-unit costs are running averages. A Support sheet holds helper calculations you never touch, and Get More Templates links back to the catalogue.
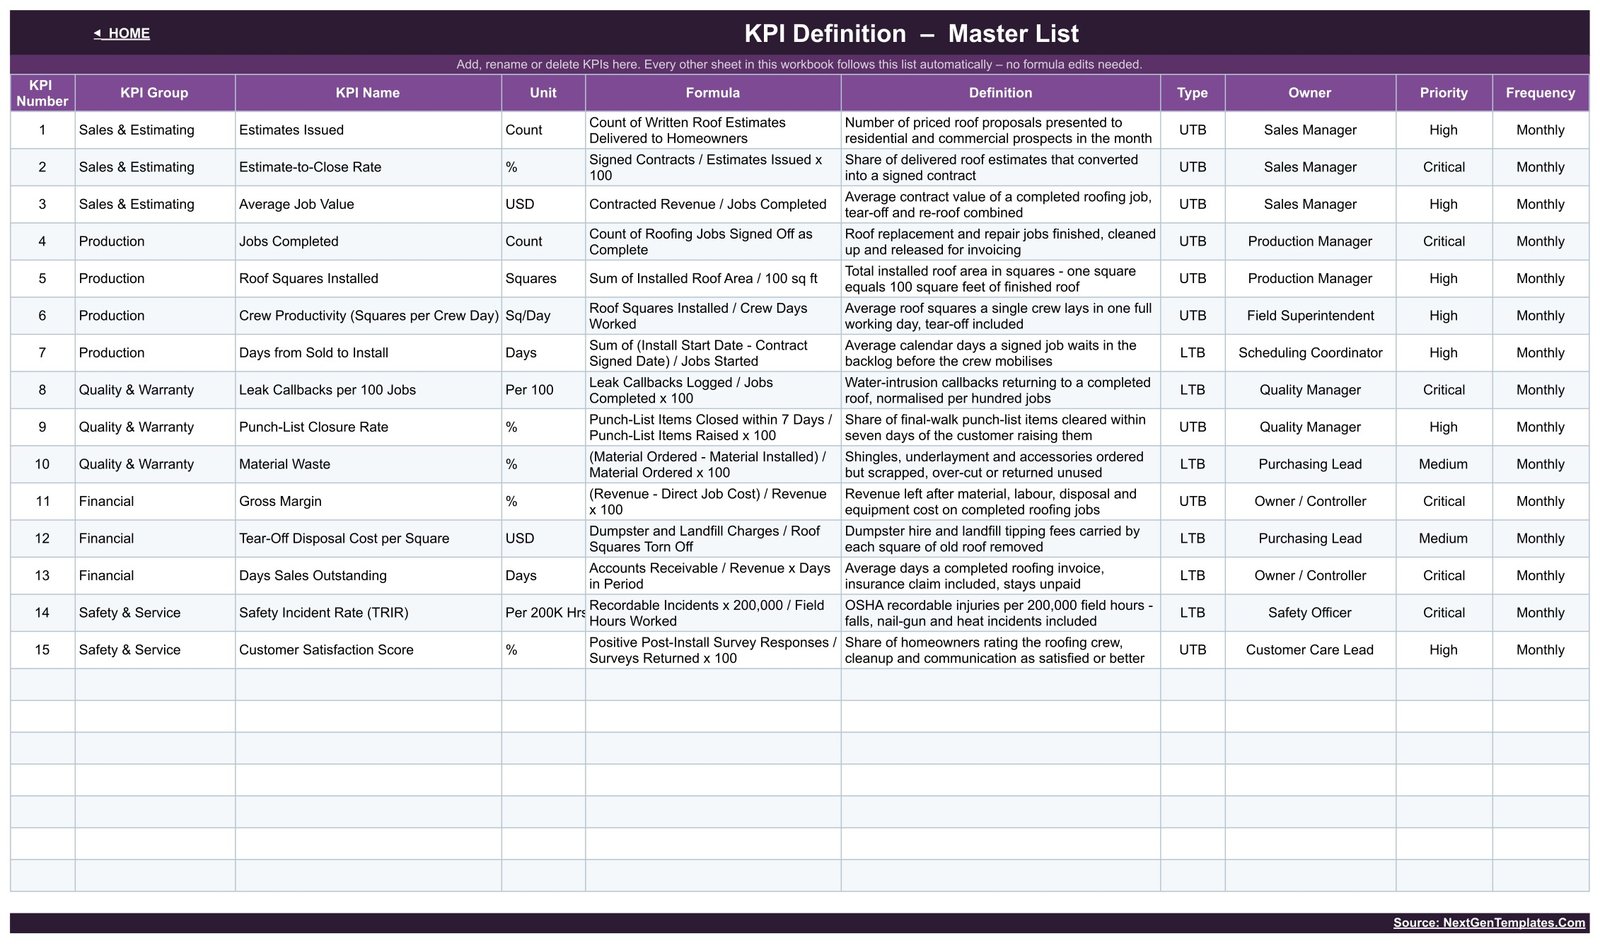
KPI Definition sheet – edit here and every page follows
Roofing Contractor KPI Dashboard vs. Excel vs. Paid Roofing SaaS – Feature Comparison
| This template (Google Sheets) | Excel KPI dashboard | Roofing SaaS (JobNimbus, AccuLynx) | |
|---|---|---|---|
| Cost | $8.99 one time | $12.99 one time | $99-$250 per user / month |
| Platform | Any browser, plus iOS and Android apps | Desktop Excel or Microsoft 365 | Web plus vendor mobile app |
| Setup time | Make a copy and type your numbers – under an hour | Download and open – under an hour | Onboarding and data migration, days to weeks |
| Real-time team collaboration | Yes, native multi-user editing | Only through OneDrive co-authoring | Yes |
| Mobile access | Yes, Google Sheets app | Limited | Yes |
| Customizable fields | Full – it is your spreadsheet | Full | Vendor-defined, some custom fields |
| Share with link | Yes, standard Google share link | File send or cloud link | Seat-based logins |
| Year-1 cost at 5 users | $8.99 | $12.99 | $5,940-$15,000 |
| Lower-is-better KPI scoring | Built in per KPI | Built in per KPI | Varies by report builder |
| Job costing, scheduling and CRM | No – this reports, it does not manage jobs | No | Yes |
Who Should Use This Template
It fits residential and commercial roofing contractors running roughly 20 to 80 jobs a month, owner-operators who report to a board, a franchisor or a lender, and production managers who want crew productivity and leak callbacks on the same page as gross margin. It also suits a roofing firm moving off a whiteboard or a monthly PDF and wanting a repeatable monthly cadence without buying seats for everyone.
It is not for you if you need job-level costing, scheduling or a CRM – it reports on totals you supply. It does not connect to JobNimbus, AccuLynx or QuickBooks; you type or paste roughly 15 numbers a month. And if your finance team lives in desktop Excel, the Excel edition or the Power BI edition of the same 15 KPIs is the better buy.
Real-World Use Cases
A three-crew residential roofer. The owner was closing about 38% of estimates and could not tell whether it was drifting. With Estimates Issued and Estimate-to-Close Rate scored side by side, month and year, he could see volume rising while conversion slipped – and moved his strongest estimator onto insurance work rather than hiring.
A commercial roofing production manager. Crew Productivity (Squares per Crew Day), Roof Squares Installed and Days from Sold to Install are her three lines. When the backlog wait pushed past 21 days she used the KPI Trend page to show it had been climbing for four straight months, which turned a scheduling argument into a hiring decision.
A franchise owner reporting upward. His franchisor wants a monthly scorecard. He shares the sheet view-only. Because Leak Callbacks per 100 Jobs and Safety Incident Rate (TRIR) are typed LTB, a reduction reads green rather than looking like a shortfall – a detail that matters when someone else is reading your numbers.
Advantages of the Roofing Contractor KPI Dashboard in Google Sheets
- Nothing to install or authorise. Every value is a worksheet formula, so it opens on a locked-down company Google account with no add-on approval.
- One dropdown, whole workbook. The scorecard and the analysis page both follow the selected month, so there is no refresh step and no stale page.
- Honest YTD maths. Volumes and counts accumulate through the year; rates, ratios and per-unit costs are running averages, so you never see a compliance percentage summing to 1,100% by December.
- Cheap to share. Google share links cost nothing per reader, so foremen and a bookkeeper can all see the same page.
- You own the file. No renewal, no seat count, and the copy sits in your Drive.
Opportunities for Improvement
- Manual entry. Fifteen KPIs a month is a ten-minute job, but it is still a job. If your CRM can export monthly totals to CSV, paste into the input sheets rather than retyping.
- Monthly cadence. This is a management scorecard, not a live crew board. Daily production tracking belongs in a separate tracker.
- No job-level drill-down. The dashboard shows the rate, not the specific job behind it – keep your job list where it already lives.
- One reporting year at a time. Comparisons run this year against last year. For a five-year view, keep an archive copy per year.
Best Practices
- Set targets before the year starts. A target typed after the fact is a description, not a target.
- Type the KPI as UTB or LTB before entering data. Get this wrong and the achievement, status and arrow colours all invert.
- Lock the input sheets. Use Google Sheets protected ranges so only the person who owns the numbers can change them, and give everyone else view access.
- Define TRIR the way your insurer does. Recordable incidents times 200,000 divided by field hours worked is the OSHA convention; keep it consistent year over year.
- Work the Bottom 5, not the whole grid. Take the two worst KPIs into the production meeting with their KPI Trend charts and leave the other thirteen alone.
- Re-read your KPI list each January. Delete anything nobody acted on all year and use the free rows for something you will.
Explore Relevant Templates
- Roofing Contractor KPI Scorecard in Google Sheets – the scorecard layout of the same trade.
- HVAC Contractor KPI Dashboard in Google Sheets – the same build for HVAC service firms.
- Plumbing Business KPI Dashboard in Google Sheets – the same build for plumbing.
- Electrical Contractor KPI Scorecard in Google Sheets – a neighbouring trade scorecard.
- Facility Services Dashboard in Google Sheets – the analytical dashboard style, for comparison.
Want to build skills like this step by step? The Excel Pivot Tables & Dashboards course on NextGenTemplates Academy covers KPI reporting with practice files.
Get the Roofing Contractor KPI Dashboard in Google Sheets
Frequently Asked Questions
Is this the KPI Dashboard or the KPI Scorecard template?
This is the KPI Dashboard build – month picker, traffic-light scorecard grid with MTD and YTD side by side, plus KPI Trend and KPI Analysis pages. The Roofing Contractor KPI Scorecard is a separate template with a different layout. You want one of them, not both.
How many KPIs are included?
15, across 5 groups. The sheets are wired for 22 KPIs and 9 groups, so there is room for 7 more without editing a single formula.
Do I need macros, add-ons or Apps Script?
No. It is formula-driven throughout, which is also why it opens instantly and never asks for permissions.
How do lower-is-better KPIs work?
Set the KPI to LTB on KPI Definition. Achievement then becomes Target / Actual, so beating a callback rate or a disposal cost target scores above 100%, and the vs-PY arrow colours by whether the movement is good for that KPI rather than by direction alone.
Can I change the On Target and At Risk thresholds?
Yes – they are plain formulas on the KPI Dashboard sheet. Edit them there and the analysis page follows.
Can crew leaders open it on a phone?
Yes, through the Google Sheets mobile app. Share view-only with the field and keep edit rights on the three input sheets.
What do I actually download?
A PDF that carries the “Make a copy” link plus a short setup guide. Clicking it puts a fully editable copy in your own Google Drive while the master file stays view-only.
About the Author
Built by PK – Microsoft Certified Professional with 15+ years of Excel, Google Sheets, and Power BI experience. Founder of NextGenTemplates, reaching 300K+ subscribers across YouTube channels. Every template is hand-built and tested before release.
Conclusion
A roofing company does not need forty metrics. It needs fifteen that are defined, owned, targeted and scored the same way every month – and a page that says plainly which two are the problem. The Roofing Contractor KPI Dashboard in Google Sheets is that page: one month dropdown, MTD and YTD together, direction-aware traffic lights, a trend view for any KPI and a top-and-bottom-five ranking for the year.
Get the Roofing Contractor KPI Dashboard in Google Sheets for a single payment, make your copy, and bring a scored page to the next production meeting. Prefer a different platform? The same dashboard ships as the Excel edition and the Power BI edition.
For walkthroughs of these Google Sheets builds, subscribe to @NeoTechNavigators on YouTube.