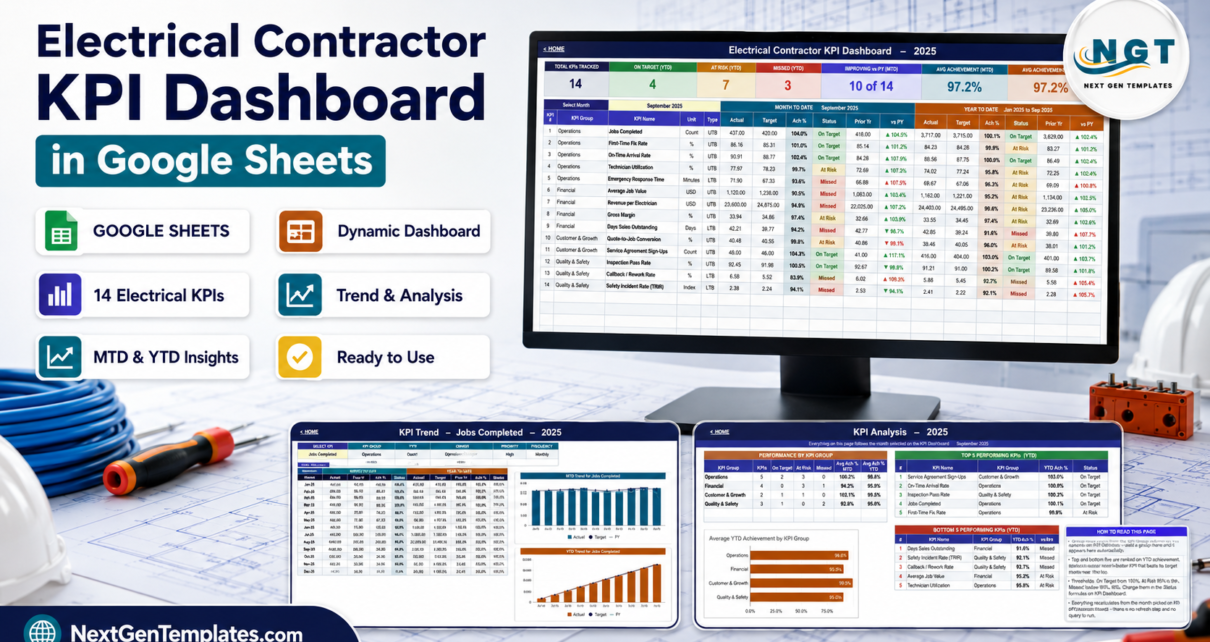
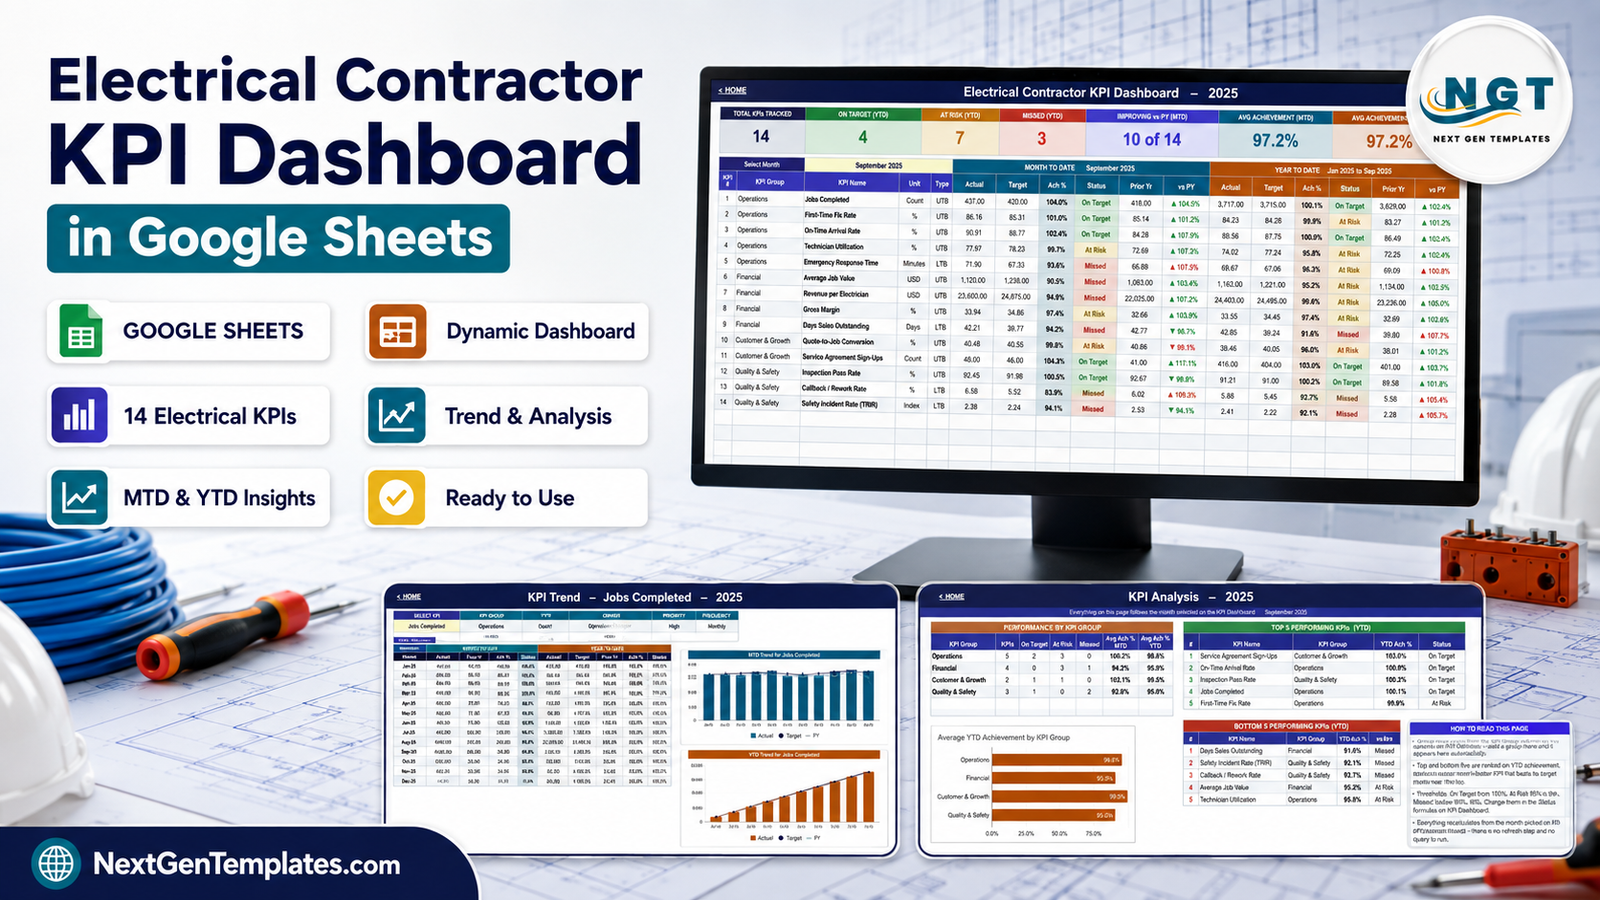
Most electrical contracting firms measure two things well – revenue and jobs booked – and everything else once a year, badly. Yet the numbers that decide whether a good year turns into a profitable one sit elsewhere: first-time fix rate, callback rate, technician utilization, days sales outstanding, and the safety incident rate that your insurer prices off. The ElectricalElectrical Contractor KPI Dashboard in Google Sheets Contractor KPI Dashboard in Google Sheets puts 14 of them on one traffic-light page, scores each against your own target, and shows Month-to-Date and Year-to-Date side by side with a prior-year column next to both.Electrical Contractor KPI Dashboard in Google Sheets
It is formula-driven from end to end. There is no add-on, no macro, no Apps Script and no refresh step – pick a month from one dropdown and all four pages re-read from it. On the sample data, September 2025 shows 14 KPIs tracked, 4 On Target, 7 At Risk and 3 Missed on the year, 10 of 14 improving against last year, and average achievement of 97.2% on both MTD and YTD. That single row of cards is the monthly meeting in seven numbers.Electrical Contractor KPI Dashboard in Google Sheets
Get the Electrical Contractor KPI Dashboard in Google Sheets
Key Features of the Electrical Contractor KPI Dashboard in Google Sheets
- 14 KPIs in four groups – Operations (5), Financial (4), Customer & Growth (2) and Quality & Safety (3).Electrical Contractor KPI Dashboard in Google Sheets
- A single month picker that drives the header cards, the scorecard grid, the trend page and the analysis page.Electrical Contractor KPI Dashboard in Google Sheets
- MTD and YTD blocks side by side, each carrying Actual, Target, Achievement %, Status, Prior Yr and vs PY.
- Upper-the-better and lower-the-better typing, so a falling DSO or a falling callback rate scores up, not down.Electrical Contractor KPI Dashboard in Google Sheets
- Traffic-light thresholds you can edit – On Target from 100%, At Risk 95% to 99%, Missed below 95%.Electrical Contractor KPI Dashboard in Google Sheets
- A KPI Trend page with twelve months of history and two charts for whichever KPI you select.Electrical Contractor KPI Dashboard in Google Sheets
- A KPI Analysis page with a group roll-up and Top 5 / Bottom 5 rankings on YTD achievement.
- An editable KPI Definition master list – change it and every other sheet follows, with no formula edits.
- Three plain input sheets for this year’s actuals, this year’s targets and last year’s results.
Dashboard Pages Explanation
Home
The landing page. Three coverage cards (14 KPIs, MTD + YTD, 100% formula-driven) sit above three link groups – Dashboard Pages, Input Sheets – Edit These, and Reference & Help – and a three-step start guide: enter your data, pick a month, read the scorecard.Electrical Contractor KPI Dashboard in Google Sheets
KPI Dashboard
The scorecard itself, and the page you will live on. Seven cards run across the top: Total KPIs Tracked, On Target (YTD), At Risk (YTD), Missed (YTD), Improving vs PY (MTD), Avg Achievement (MTD) and Avg Achievement (YTD). Below them, the month dropdown, then a 14-row grid: KPI #, KPI Group, KPI Name, Unit and Type, followed by the Month-to-Date block and the Year-to-Date block.
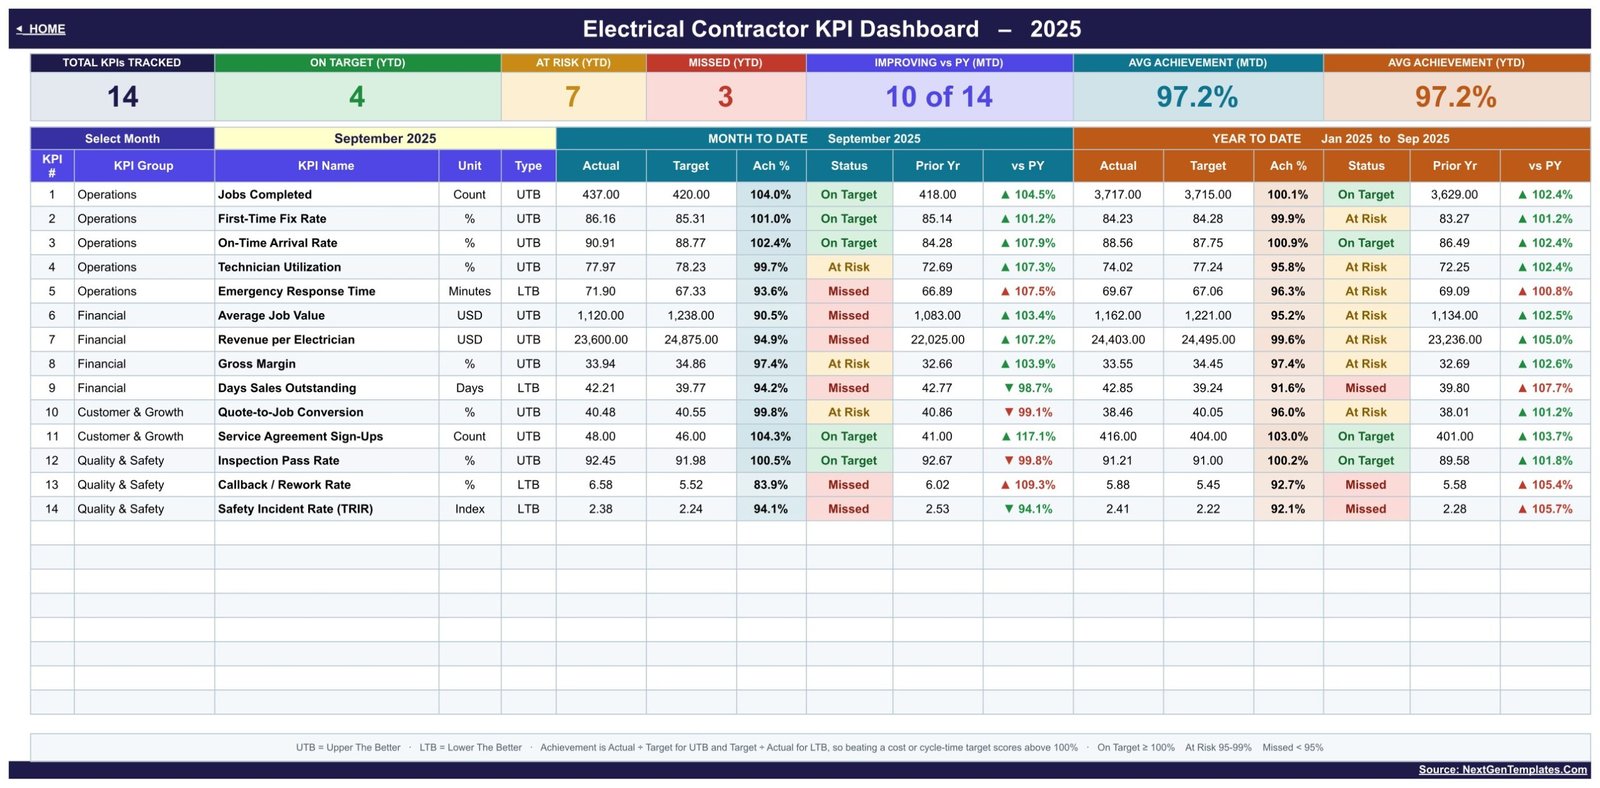
The full KPI list is: Jobs Completed, First-Time Fix Rate, On-Time Arrival Rate, Technician Utilization and Emergency Response Time (Operations); Average Job Value, Revenue per Electrician, Gross Margin and Days Sales Outstanding (Financial); Quote-to-Job Conversion and Service Agreement Sign-Ups (Customer & Growth); Inspection Pass Rate, Callback / Rework Rate and Safety Incident Rate (TRIR) (Quality & Safety).
Four of those are typed LTB – lower the better. Emergency Response Time, Days Sales Outstanding, Callback / Rework Rate and Safety Incident Rate (TRIR) are scored as Target ÷ Actual rather than Actual ÷ Target, which is the small piece of logic that most home-made contractor spreadsheets get wrong. Without it, a rising callback rate quietly reads as a green result.
KPI Trend
Choose one KPI from a dropdown and the whole page rebuilds around it. Across the top you get its group, unit, type, owner, priority and frequency, plus the formula text and the plain-English definition. Then twelve rows – one per month, with the matching prior-year month – showing MTD Actual, Target, Prior Yr, Achievement % and Status, the same five columns on a YTD basis, and vs Prior Year for both.
Two charts sit underneath: MTD Trend for [KPI] and YTD Trend for [KPI]. Each plots Actual as columns with Target and PY as lines, so a month that beat target but fell behind last year is obvious at a glance.
KPI Analysis
The page for the monthly review. Performance by KPI Group counts the KPIs in each group and how many are On Target, At Risk and Missed, then averages MTD and YTD achievement per group – and it reads the group names straight from the KPI Definition sheet, so a group you invent appears here automatically.
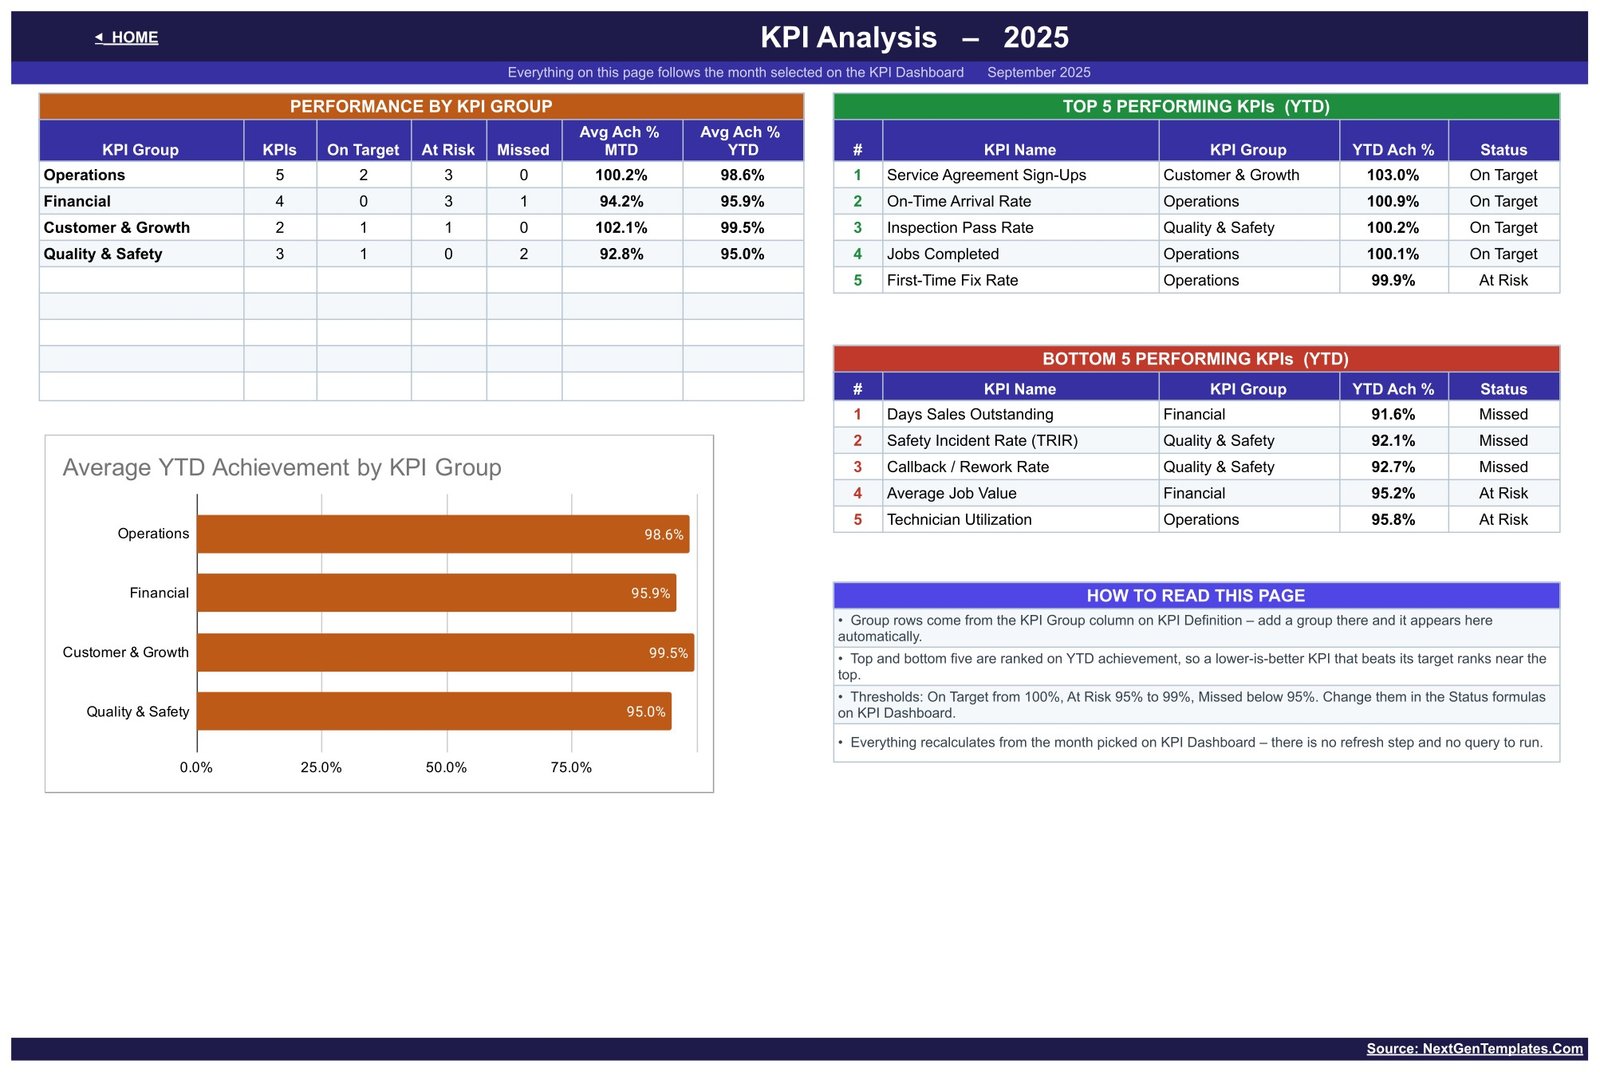
Beside it, Top 5 Performing KPIs (YTD) and Bottom 5 Performing KPIs (YTD) rank everything by year-to-date achievement with its group and status. An Average YTD Achievement by KPI Group bar chart sits below the group table, and a How To Read This Page box explains the ranking rule and the thresholds.
KPI Input – Actual, Target and PY
Three identical grids, one row per KPI, two columns per month (MTD and YTD), with the entry cells shaded yellow. Cell E3 sets the first month of the reporting year – change it and the whole workbook re-bases without touching a formula.
KPI Definition
The master list, and the sheet that makes the template yours: KPI Number, KPI Group, KPI Name, Unit, Formula, Definition, Type, Owner, Priority and Frequency for all 14 KPIs. Ownership is assigned realistically – Dispatch Supervisor owns On-Time Arrival Rate and Emergency Response Time, the Finance Controller owns Gross Margin and DSO, the Safety Manager owns TRIR.
Electrical Contractor KPI Dashboard vs. Excel vs. Paid Field-Service SaaS – Feature Comparison
| This template (Google Sheets) | Excel KPI dashboard | ServiceTitan / Housecall Pro | |
|---|---|---|---|
| Cost | One payment, under $15 | One payment, typically $13-$20 | $99-$400+ per user per month |
| Platform | Google Sheets, any browser | Desktop Excel | Vendor cloud platform |
| Setup time | Copy the sheet, type your numbers – about 20 minutes | Download, open, type your numbers | Weeks of onboarding and migration |
| Real-time team collaboration | Yes, native multi-user editing | Only via OneDrive co-authoring | Yes |
| Mobile access | Yes, Google Sheets app | Limited | Yes, dedicated apps |
| Customisable KPIs | Yes – edit the KPI Definition sheet | Yes, with formula edits | Only what the vendor exposes |
| Share with a link | Yes | No | Seat-based access only |
| Year-1 cost at 5 users | Under $15 | $13-$20 | $6,000-$24,000 |
| Lower-the-better KPI scoring | Built in | Built in | Varies; often a custom report |
| Prior-year comparison | Built in on MTD and YTD | Built in | Usually a paid analytics add-on |
Who Should Use This Template
It suits owner-operated and mid-sized electrical contracting firms – roughly 3 to 60 electricians – that already capture the raw numbers somewhere but have no monthly scorecard. Operations managers get first-time fix, on-time arrival and utilization on the same page as gross margin. Finance controllers get DSO and average job value scored the same way as the field metrics rather than in a separate pack. Safety managers get TRIR reviewed monthly instead of at renewal time.
It is not a dispatch board, a job-costing system or an integration. It holds monthly totals, not individual jobs; there is no per-job P&L; and nothing syncs from QuickBooks, Xero or a field-service platform. You export twelve monthly figures per KPI and paste them in. If you want per-technician league tables rather than firm-level KPIs, this is the wrong shape.
Real-World Use Cases
The monthly partners’ meeting. Open KPI Analysis, read the Bottom 5. On the sample data that is Days Sales Outstanding at 91.6%, Safety Incident Rate at 92.1% and Callback / Rework Rate at 92.7% – three Missed KPIs owned by three different people, which is a far more useful agenda than “revenue is up”.
Diagnosing a quality slide. Callback / Rework Rate and First-Time Fix Rate move together. When callbacks drift above target, the KPI Trend page shows whether it started in one month – a specific crew, a specific job type – or has been creeping all year.
Deciding whether to hire. Technician Utilization at 95.8% YTD with Jobs Completed On Target says the crew is busy on smaller work, not short-handed. Average Job Value at 95.2% confirms it. That is an estimating problem, not a headcount one – and the dashboard makes the difference visible before the payroll commitment is made.
Advantages of the Electrical Contractor KPI Dashboard
The single biggest advantage is that the scoring logic is correct. Lower-the-better KPIs are typed as such, so safety and receivables cannot flatter the scorecard. The second is that the KPI Definition sheet genuinely drives everything – rename a KPI, move it to a new group, or add a group, and the dashboard, the trend page and the group roll-up all follow. The third is that it is plain Google Sheets: it opens on a phone, it shares with a link, it survives the person who built it leaving, and it costs less than one hour of an electrician’s time.
Opportunities for Improvement
Be clear about what it does not do. There is no automated data feed, so somebody has to enter twelve numbers per KPI per year. It holds a single reporting year at a time – twelve months of actual, target and prior year – so multi-year analysis means keeping copies. There are no email alerts or scheduled reports; the review is something you diarise, not something the sheet nags you about. And the charts live on the KPI Trend page one KPI at a time rather than as a wall of small multiples.
Best Practices
Set your targets before the year starts and leave them alone – a target you edit in arrears is not a target. Enter actuals within the first week of the following month, while the numbers are still contested and correctable. Review by exception: work the Missed rows first, then the At Risk rows, and leave the green ones alone. Give every KPI a named owner on the KPI Definition sheet, because an unowned KPI is a statistic rather than a management tool. And share the file view-only with the wider team so the scorecard is common knowledge rather than a management document. If you are new to shared spreadsheets, Google’s own Google Sheets help centre covers sharing and permissions well.
Explore Relevant Templates
- Electrical Contractor KPI Scorecard in Google Sheets – the simpler one-page scorecard on the same topic.
- HVAC Contractor KPI Dashboard in Google Sheets – the same dashboard structure for HVAC firms.
- Plumbing Business KPI Dashboard in Google Sheets – for plumbing contractors.
- Electrical Contractor KPI Scorecard in Excel – if your team works in desktop Excel.
- Browse the full Google Sheets KPI Dashboard range.
If you want to go further with reporting like this, the Excel Pivot Tables & Dashboards course on NextGenTemplates Academy teaches the underlying skills with practice files.
Get the Electrical Contractor KPI Dashboard in Google Sheets
Frequently Asked Questions
Is this the KPI Dashboard or the KPI Scorecard?
This is the KPI Dashboard: a month picker, seven header cards, a 14-row MTD/YTD grid with prior-year columns, a KPI Trend page and a KPI Analysis page. The Electrical Contractor KPI Scorecard in Google Sheets is a separate, simpler single-page template. They complement each other; neither replaces the other.
How do I get my own copy?
The download is a PDF containing the “Make a copy” link. Click it while signed in to Google and a private copy lands in your own Drive.
Do I need an add-on, a macro or a script?
No. Every value on every page is a spreadsheet formula. Nothing to install, nothing to authorise, no refresh step.
Can I change the 14 KPIs?
Yes. Edit the KPI Definition sheet – rename, re-group, change the unit, or switch a KPI between UTB and LTB – and the dashboard, trend and analysis pages all follow automatically.
Can I change the traffic-light thresholds?
Yes. On Target from 100%, At Risk 95% to 99% and Missed below 95% are set in the Status formulas on the KPI Dashboard sheet.
Does it connect to accounting or field-service software?
No. You type or paste monthly figures into the three input sheets. Nothing syncs, imports or sends alerts.
How many months does it hold?
Twelve, with MTD and YTD actual, target and prior-year values per KPI. Cell E3 sets which month starts the year.
About the Author
Built by PK – Microsoft Certified Professional with 15+ years of Excel, Google Sheets, and Power BI experience. Founder of NextGenTemplates, reaching 300K+ subscribers across YouTube channels. Every template is hand-built and tested before release.
Conclusion
An electrical contracting business is judged on three things at once: whether the work is safe, whether it is right the first time, and whether it makes money. The Electrical Contractor KPI Dashboard in Google Sheets scores all three every month, against your own targets, with last year sitting next to this year so a bad month reads as a trend rather than an argument. Twenty minutes of setup and twelve numbers a month is the whole cost.
Get the template here: Electrical Contractor KPI Dashboard in Google Sheets. Prefer the one-page version? Try the Electrical Contractor KPI Scorecard in Google Sheets.